
(T2108 measures the percentage of stocks trading above their respective 40-day moving averages [DMAs]. It helps to identify extremes in market sentiment that are likely to reverse. To learn more about it, see my T2108 Resource Page. You can follow real-time T2108 commentary on twitter using the #T2108 hashtag. T2108-related trades and other trades are occasionally posted on twitter using the #120trade hashtag. T2107 measures the percentage of stocks trading above their respective 200DMAs)
T2108 Status: 60.1%
T2107 Status: 75.2%
VIX Status: 12.5
General (Short-term) Trading Call: cautiously bearish
Active T2108 periods: Day #142 over 20%, Day #48 over 30%, Day #47 over 40%, Day #46 over 50%, Day #2 over 60% (overperiod), Day #24 under 70%
Commentary
Buyers got on track in the stock market with a surprising bullish divergence on Wednesday, September 7th. While the S&P 500 (SPY) essentially ended the day flat, T2108, the percentage of stocks closing above their respective 40-day moving averages (DMAs), gained a solid 3 percentage points to close at 62.9%. Today, another divergence appeared that demonstrated subtle buying strength. While the S&P 500 lost a marginal 0.2%, the PowerShares S&P 500 High Beta ETF (SPHB) surged 1.3% while the PowerShares S&P 500 Low Volatility ETF (SPLV) lost 0.3%. It is easier to see the significance in this divergence by looking at the recent trends: S&P 500 sideways, and SPLV down, SPHB up.
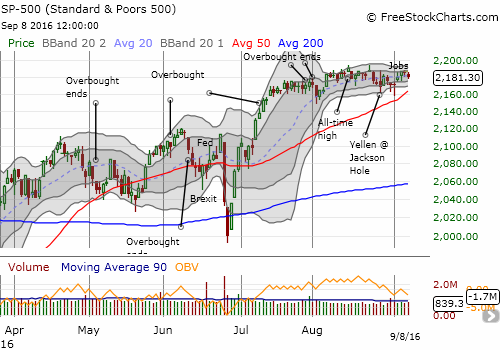
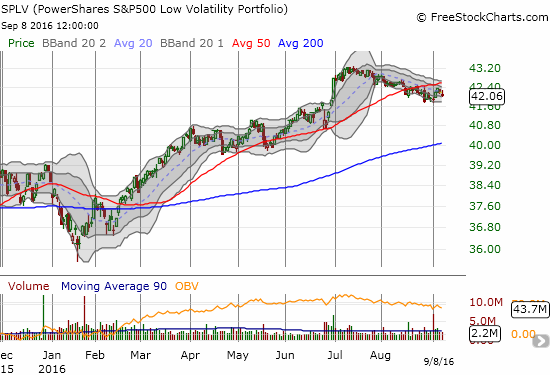
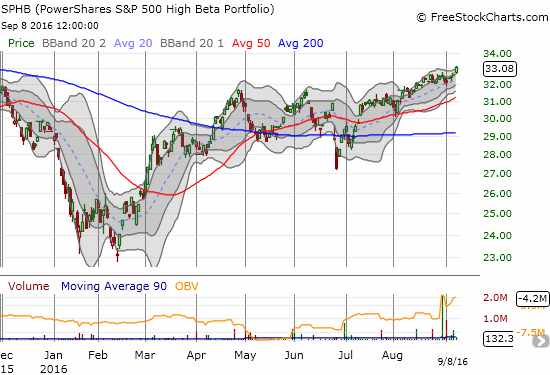
I am noticing that the year’s biggest pullbacks have been marked by particularly poor performance of SPHB. For example, SPHB made a new low for the year during February’s follow-on sell-off while SPLV stopped well short. Even during Brexit, SPHB took an out-sized hit compared to SPLV. In other words, weakness in SPHB is seemingly much more important than SPLV to the overall health of the S&P 500.
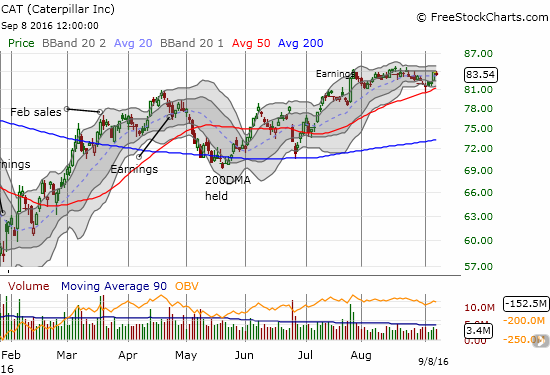
I am keeping the short-term trading bias at cautiously bearish given T2108 is still not in overbought territory. It is even possible SPHB is getting over-extended. However, note that I have been so cautious in my bearishness that put options on Caterpillar (CAT) remain the only new and significant bearish position I have taken since I switched the trading bias to short-term bearish. The hike in volatility that I expected has simply failed to arrive so far.
Other trades have had significant developments.
Chipotle Mexican Grill (CMG)
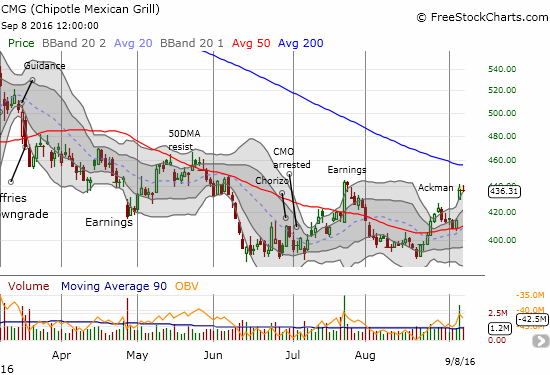
On Tuesday morning, I was close to deciding to let my shares of CMG ride without the weekly hedge repositioning. My thinking was to let the position bounce off 50DMA support. Instead, I decided to stick to the rules and buy the weekly put. That evening, CMG soared to as much as $443 (I believe) on news of a 9.9% stake taken by Bill Ackman’s Pershing Square. I sold my shares around $439, not wanting regular trading the next day to fade my profits. So far, CMG is holding up quite well. Going forward, I will put the weekly hedge trade on hold and see what kind of follow-tough Ackman’s investment is able to garner. I am not optimistic…
Baidu (BIDU)
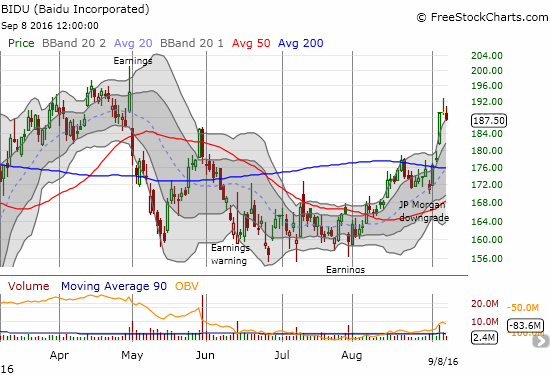
Last Wednesday, August 31st, JP Morgan (JPM) downgraded BIDU. The stock gapped down to its 20DMA support and the 200DMA looked like it would hold again as resistance. I decided to buy a put option as a play on at least 50DMA support. Surprisingly, not only did traders fade JP Morgan the very next day, but they sent the stock through the roof! BIDU closed above 200DMA resistance and has yet to look back since. As far as I can tell, no new news has printed to explain the move. While I have seen contrary trades to major analyst action before, THIS one pretty much takes the cake. In just 4 trading days, BIDU was up as much as 13%! With the stock facing down a topping pattern on the daily chart (called an evening star), I decided one more time to buy a put and play the stock to at least a reversal of this week’s big move if not a test of 200DMA support.
Apple (AAPL)
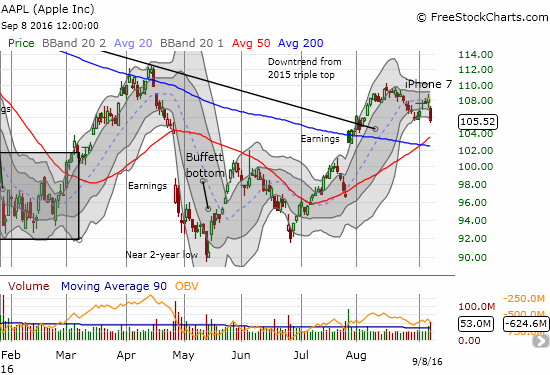
Today my latest trade on AAPL blew up. An analyst downgrade and the company’s refusal to release iPhone pre-order numbers seemed to combine to take down AAPL. I have also read multiple pieces wringing hands over AAPL’s growth potential given an underwhelming new product launch in the iPhone 7. Ironically, traders usually fade AAPL after a product announcement, but THIS time AAPL managed a strong close. I was readying myself for a nice breakout. Here is AAPL’s note to CNBC declaring the company’s decision not to release pre-order numbers.
JUST IN: Apple says it will not be releasing iPhone pre-order numbers as it traditionally has in the past. pic.twitter.com/kGXfPcUkKB
— CNBC Now (@CNBCnow) September 8, 2016
If I had not seen the stock’s reaction, I would have assumed AAPL just gave the market good news: demand is so high, they cannot keep up! Perhaps instead the interpretation is that AAPL will forgo sales….? Whatever is going on, the droop in AAPL now puts the converged 50 and 200DMAs in play. Needless to say, I have placed my 2-week call buying strategy for AAPL on the shelf…
— – —
Daily T2108 vs the S&P 500
")
Black line: T2108 (measured on the right); Green line: S&P 500 (for comparative purposes)
Red line: T2108 Overbought (70%); Blue line: T2108 Oversold (20%)
Weekly T2108

*All charts created using freestockcharts.com unless otherwise stated
The charts above are the my LATEST updates independent of the date of this given T2108 post. For my latest T2108 post click here.
Related links:
The T2108 Resource Page
Be careful out there!
Full disclosure: long SDS, long AAPL call options, long BIDU put options, long CAT put options