
The Market Breadth Summary
- My internal urge to dismiss the bearish signal from market breadth reflects my desire to defer to bullish price action.
- AT50 and AT200 indicators faded despite fresh highs, creating a bearish divergence that forced my deference to trading rules.
- Semiconductor leadership from Intel and AMD helped sustain upside momentum in tech.
- Earnings, central bank decisions, and geopolitical news may decide whether traders dismiss or confirm the warning.
Stock Market Commentary
Last week was bullish, and yet the bearish signal that bothered me early in the year returned. Market breadth flashed bearish even as the S&P 500 and the NASDAQ broke out to all-time highs. This bearish divergence is exactly the setup I did not want to see. The resulting complications in the trading dynamics turn the coming week into a critical juncture. The market will contend with a surplus of earnings announcements, pronouncements from five major Central Banks (including the Federal Reserve), and the constantly shifting headlines from the war against Iran and the resulting impact on oil prices and the global economy.
While the market has mainly moved on from the war, on Thursday headlines from the conflict briefly disrupted the bullish sentiment. An intraday dip on rumors of Israeli jets invading Iranian airspace quickly reversed after the rumors were debunked. I took an important lesson from that trading episode. Each incremental wave of bad news exhausts a fresh wave of motivated sellers, leaving buyers to fill the vacuum with higher prices than before. That imbalance further motivates me to dismiss the bearish signal from market breadth…for now.
The Stock Market Indices
S&P 500 (SPY)
The S&P 500 broke out to a new all-time high. That breakout was plainly bullish. The index cooled from its feverish runup into the week, and the choppy pause looked like price consolidation. As long as this breakout level holds, the bulls remain in control. In the short-term, only a breakdown below the low of the consolidation range (7,047) would get me considering a bearish trade on the index. Note well how the closing and intraday lows of the week essentially closed the gap from the previous Friday’s gap higher. A breakdown could quickly take the S&P 500 back to support from any of its major moving averages, the 20DMA (dotted line), the 50DMA (red line), and the 200DMA (the blue line).
Also note how much room the S&P 500 has to the upside until it touches its upper Bollinger Band (BB) (the black line shooting nearly straight up). This room to rally forms the major risk for any trader trying to pick a top here.
")
NASDAQ (COMPQ)
The NASDAQ also remains bullish. Unlike the S&P 500, the tech-laden index trended upward through the week despite intraday chop. That steady grind higher was constructive and showed persistent demand for growth and technology names. Tech stocks led the way for the week and formed the upside part diverging from the bearish market breadth signal. In the short-term, I would not bother considering a bearish trade on the NASDAQ until/unless it broke down below its double-top at the former all-time highs at 22,950. Like the S&P 500, note well how much room the NASDAQ has to the upside before it touches its upper Bollinger Band.
")
iShares Russell 2000 ETF (IWM)
IWM was previously the leading index, but now it has moved to the back of the line. The ETF of small caps remained in consolidation mode and failed to close at a new all-time high on Friday. IWM’s intraday dip on Thursday fell far short of closing the gap created by the previous Friday’s run-up. I go into the coming week with a bet on an eventual breakout with a weekly $280/$285 vertical calendar call spread.
")
The Short-Term Trading Call With An Urge to Dismiss Bearishness
- AT50 (MMFI) = 62.4% of stocks are trading above their respective 50-day moving averages
- AT200 (MMTH) = 55.9% of stocks are trading above their respective 200-day moving averages
- Short-term Trading Call: neutral
AT50 (MMFI), the percentage of stocks trading above their respective 50DMAs, closed the week at 62.4%. On an intraday basis, my favorite technical indicator twice traded above the 70% overbought threshold before fading significantly on Tuesday to 64.5%. Per the AT50 trading rules, this kind of fade from the overbought threshold is bearish. Thursday’s downside follow-through confirmed the bearish move. Friday’s surge in the major indices barely helped AT50, a cautionary sign.
")
AT200, the percentage of stocks trading above their 200DMAs, underlines the bearishness in market breadth. Tuesday’s fade looks worse than AT50’s as this indicator of the longer-term health of market breadth gapped higher to 61% before fading sharply to a close at 57%. AT200 even fell fractionally on Friday despite the strong rally in the major indices. Now AT200 is clinging to a former pivot formed by its level when the S&P 500 hit an all-time high in early 2025. Further downside from here would nudge me closer to a bearish call on the stock market.
")
While I do not want to go bearish because of the strong price action in the S&P 500 and the NASDAQ and the resilience of IWM, I am deferring to the AT50 trading rules by downgrading the short-term trading call from cautiously bullish to neutral. I cannot foresee returning to a bullish trading call until the major indices successfully test major support.
The volatility index (VIX) reinforced the bullishness of the price action in the indices by closing the week at a new low since last month’s blow-off top. Fear continues to fizzle as the Iran war’s drama fades from the market’s concerns. As a reminder, I do not expect the market to care about the war until/unless something happens worse than what the market already survived.
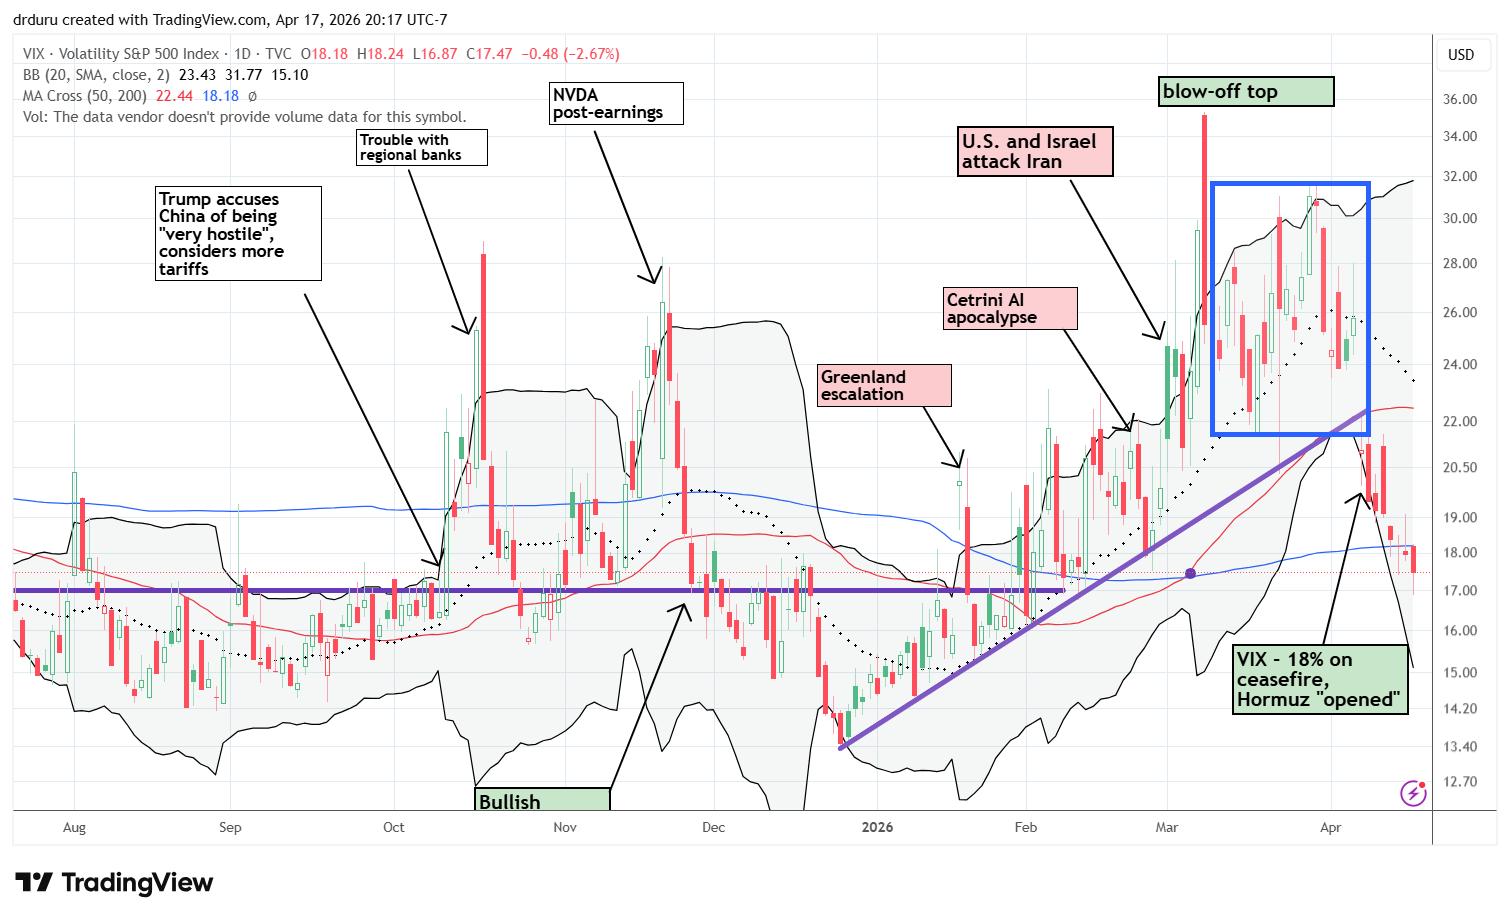
I project that this war is trending toward a new nuclear deal. The complete opening of the Strait of the Hormuz will be celebrated as its own victory even though it was already open before the war. If I am correct, then the market’s casual attitude is well-placed. It remains to be seen whether the very real damage unfolding in the global economy comes back to bite U.S. corporate earnings, especially given the AI trade has taken on new life.
In case you missed it…
I reviewed the pre-earnings technical setup for Microsoft (MSFT). The stock looks like it is slowly setting up a bearish to bullish reversal with higher lows and higher highs.
The Stocks and ETFs
Intel (INTC)
Description: Intel designs and manufactures semiconductor products, computing platforms, and related technologies.
Technical status: Intel Corp (INTC) surged by 23.6% post-earnings, leaping above its upper Bollinger Band and reaching a new all-time high.
Trade commentary: I am blown away by the dramatic change in sentiment for Intel. Although INTC is on my shopping list for 2026, I have not been aggressive enough in my trades. In its earnings report, Intel reported strong AI-driven demand for its CPUs: “We delivered robust Q1 results, reflecting the growing and essential role of the CPU in the AI era and unprecedented demand for silicon, as well as our disciplined execution to expand available supply.” The company implied that demand is stretching capacity limits, a bullish prospect that clearly has the stock market maximally excited.
")
Advanced Micro Devices (AMD)
Description: AMD designs processors, graphics products, and data center computing solutions.
Technical status: Advanced Micro Devices Inc (AMD) broke out to fresh highs and extended rapidly, rising above its double top and reaching a new all-time high.
Trade commentary: I bought AMD on Wednesday as a pure technical move. I did not anticipate any impact from Intel’s earnings report. Yet, INTC’s talk about constrained capacity for CPUs for AI applications translated into demand pressures for AMD as well. AMD gained 13.9% in sympathy with INTC. With the stock well above its upper Bollinger Band at the end of a near parabolic run-up, I took profits as a risk management move.
Davidson upgraded AMD with a price target of $375, and I am not interested in trying to squeeze every drop out of the stock. Still, AMD is a clear buy on the dips from here.
")
VanEck Semiconductor ETF (SMH)
Description: SMH is an exchange-traded fund focused on semiconductor companies.
Technical status: The VanEck Semiconductor ETF (SMH) rose upwards alongside the upper Bollinger Band, hitting a new all-time high.
Trade commentary: Semiconductor momentum has been relentless. INTC unexpectedly helped lead the entire group higher with SMH gaining 5.1% on Friday. I thought I would never see another day when INTC was strong enough to push the entire sector upward.
")
Amazon.com (AMZN)
Description: Amazon operates e-commerce platforms, cloud infrastructure services, and digital media businesses.
Technical status: Amazon.com Inc (AMZN) broke out to a new all-time high, ending the week with a 3.5% jump.
Trade commentary: I sold my AMZN holdings on the stock’s breakout above the former January, 2025 all-time high. I expected churn around that area of resistance from the former November, 2025 all-time high. Instead, the stock wasted no time in continuing its surge. Now I am watching for the reaction to earnings.
")
Nike, Inc (NKE)
Description: Nike designs, markets, and sells athletic footwear, apparel, and equipment.
Technical status: Nike Inc (NKE) partially recovered from its post-earnings drop thanks to insider buying but still failed at downtrending 20DMA resistance.
Trade commentary: I turned bullish on NKE because insiders bought shares. Unfortunately, the subsequent (albeit small) rally stopped cold at 20DMA resistance. Now the breakout from the bottoming pattern (see the purple box below) looks tenuous; I may even abandon my position on a new low (which would mark a fresh 11 1/2 year low for NKE!).
")
Dollar General (DG)
Description: Dollar General operates discount retail stores selling consumables, household goods, and general merchandise.
Technical status: Dollar General Corp (DG) struggled to hold prior 200DMA breakout support, testing 20DMA and 200DMA support again.
Trade commentary: I own DG as a trade on 200DMA support. If support breaks, I will stop out on a close below the previous low (around $115). Consumer discretionary stocks are part of the bearish story in the stock market, so my DG trade is particularly risky. Note that DG is down for the year despite what looked like a strong start after November’s breakout.
")
Dollar Tree (DLTR)
Description: Dollar Tree operates discount retail stores in North America.
Technical status: Dollar Tree Inc (DLTR) managed to temporarily break out above the 20DMA before returning to lower levels.
Trade commentary: DLTR is the cautionary tale for my DG trade. DLTR is in bearish territory below its 200DMA resistance.
")
Best Buy (BBY)
Description: Best Buy is a consumer electronics retailer offering products and services.
Technical status: Best Buy Co Inc (BBY) broke down below its 50DMA amidst CEO changes, approaching a new low for the year.
Trade commentary: I bought a BBY put option as a bet on 50DMA resistance holding in the wake of Goldman’s downgrade to sell. Instead, the stock continued to rally with a 50DMA breakout. That breakout turned into a fakeout after a negative reaction to a CEO change. I promptly took a profit on my position although Goldman’s downgrade suggests BBY will soon go a lot lower.
")
iShares Expanded Tech-Software Sector ETF (IGV)
Description: IGV is an exchange-traded fund focused on software and technology companies.
Technical status: iShares Expanded Tech-Software Sector ETF (IGV) rebounded off of 50DMA support after a strong 5.8% drop.
Trade commentary: If not for my full basket of software stocks, I would have tried a fresh trade in IGV for a bounce off 50DMA support. Given the weakness in market breadth, I am surprised IGV was able to hold support, especially after the deeply negative reaction on Thursday to earnings from International Business Machines (IBM) and ServiceNow (NOW). (I bought a fresh set of shares in IBM and almost added to NOW).
Anyway, if IGV fills the gap and continues to higher, the ETF will confirm a bottom for software stocks as a sector. Thus, upcoming Microsoft (MSFT) earnings are coming at an exceptionally critical time. (My latest PAIROS analysis on Atlassian Corporation (TEAM) increased my confidence in my contrarian software picks).
")
Manhattan Associates (MANH)
Description: Manhattan Associates provides supply chain, inventory, and commerce software solutions.
Technical status: Manhattan Associates Inc (MANH) broke out above its 50DMA post-earnings after a 5.6% jump, maintaining 50DMA support.
Trade commentary: MANH is on my buy list for next week as it looks set to continue its rally after recovering from a post-earnings fade and 50DMA breakdown. I first want to understand the catalyst(s) for the February post-earnings collapse to make sure there is not some structural flaw to the company’s business.
")
Zoom Communications (ZM)
Description: Zoom provides video communications, collaboration, and productivity software.
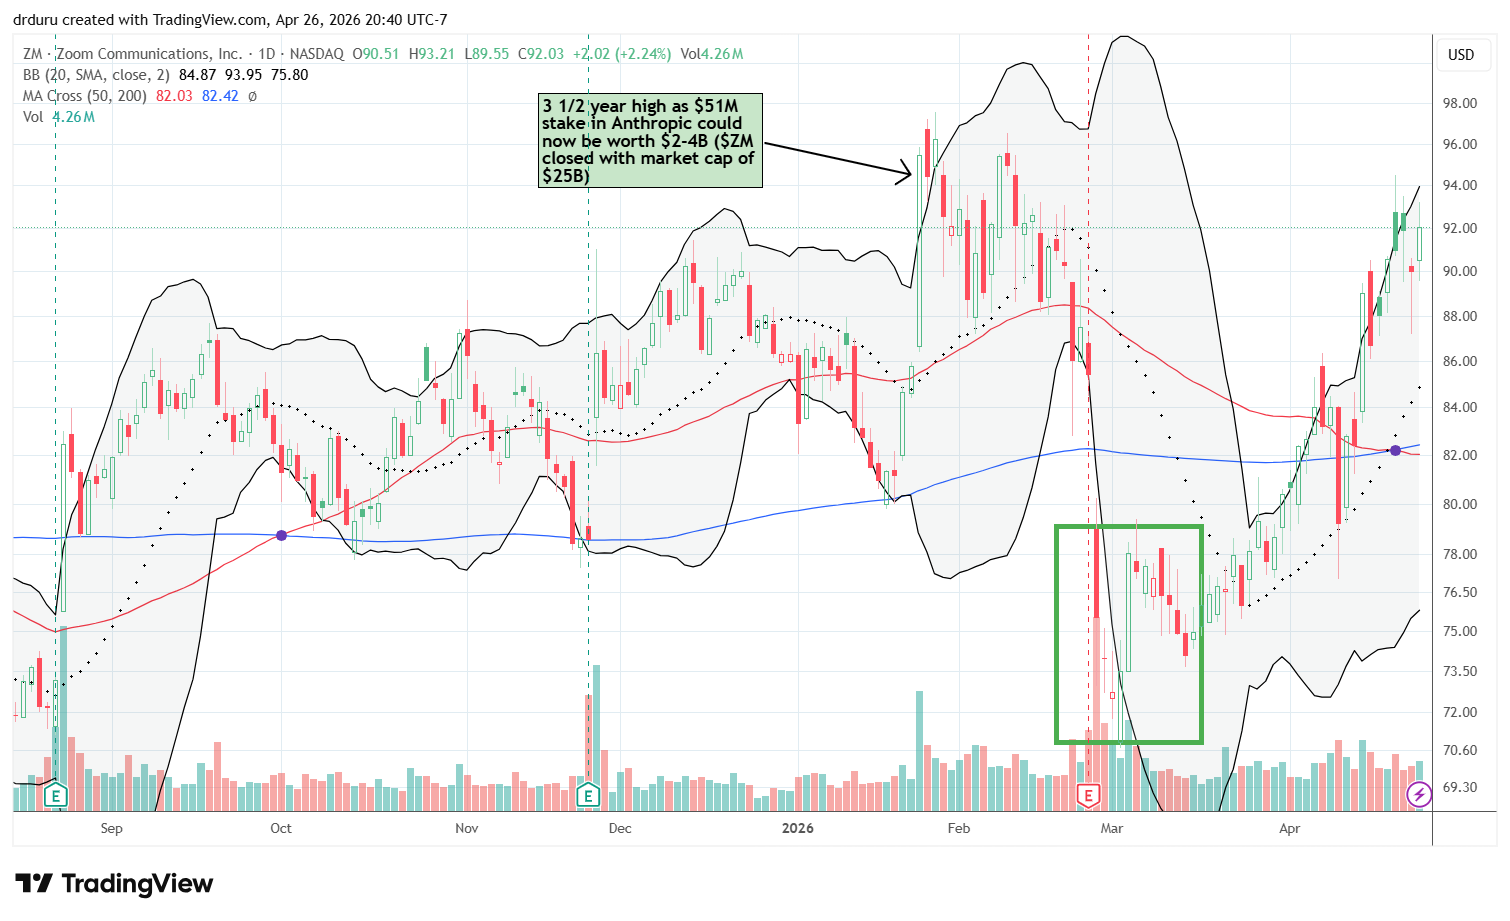
Technical status: ZM completed a bottoming breakout after its post-earnings decline.
Trade commentary: ZM has earned a permanent fixture on my shopping list of stocks. Its sharp swings up and down have surprised me as I keep expecting a sustained breakout at some point. January’s surge on news of the company’s investment in Anthropic looked like the long awaited breakout. Instead, the market quickly forgot about the news and I had to sell on a 50DMA breakdown to preserve remaining profits.
I dutifully bought back into ZM after its 11.6% post-earnings loss. The green box shows the stock’s area of resilience before buyers took back control. I locked in profits on Thursday’s dip.
If ZM stays trapped in years more of a trading range, at least it seems I can make money buying at the lows of the range.
Intuitive Surgical (ISRG)
Description: Intuitive Surgical develops robotic-assisted surgical systems and related instruments.
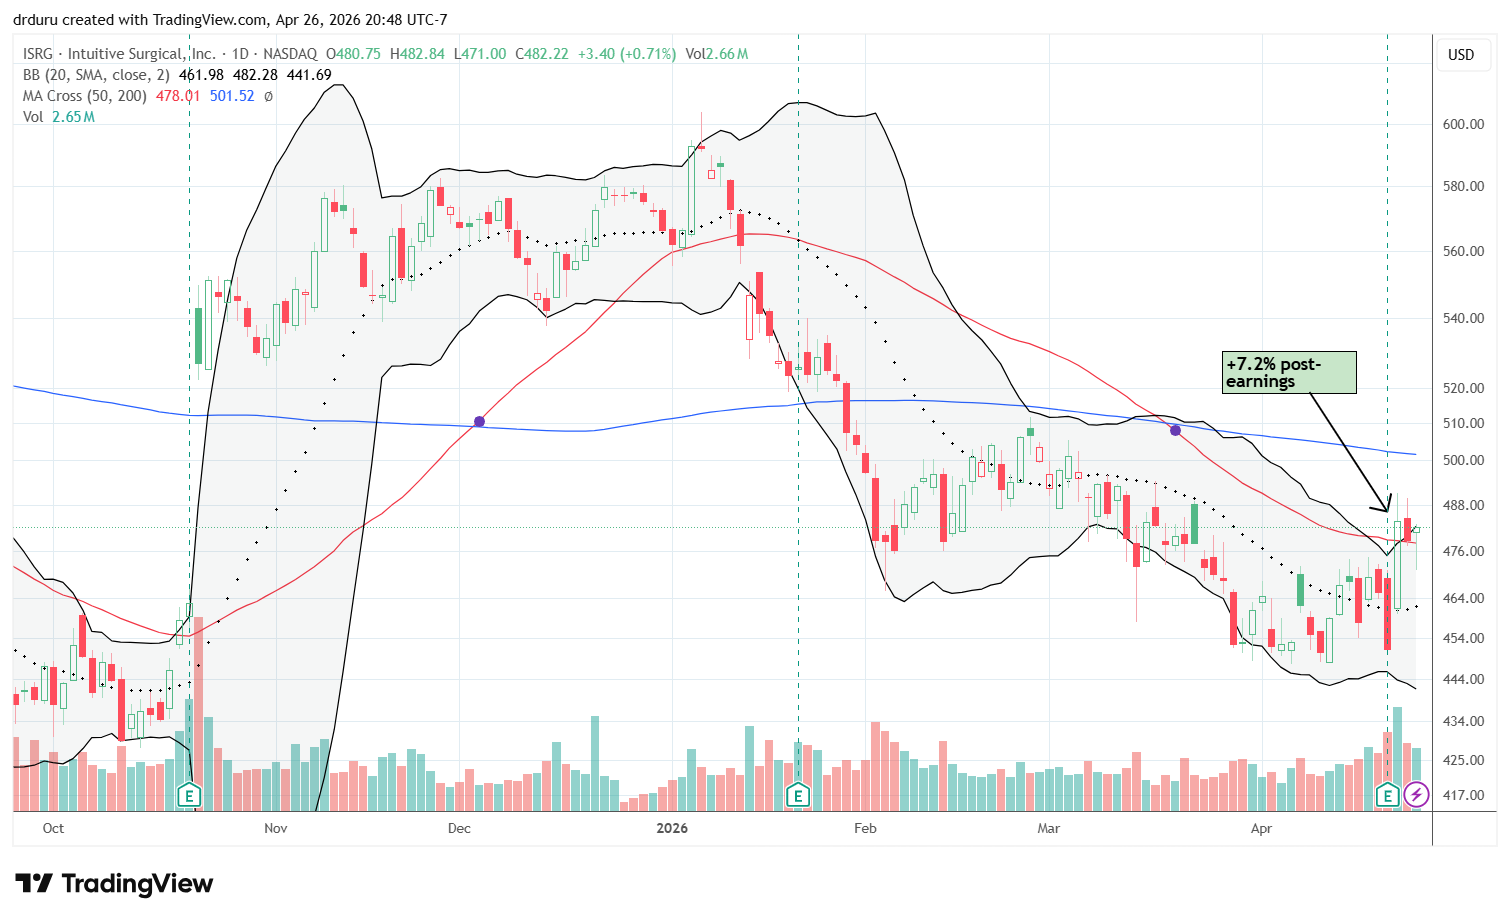
Technical status: Intuitive Surgical (ISRG) gained 7.2% on earnings and broke out above 50DMA resistance.
Trade commentary: I am now firmly holding ISRG for the long-term. I was relieved to see a constructive earnings response and hope it marks the start of a fresh recovery.
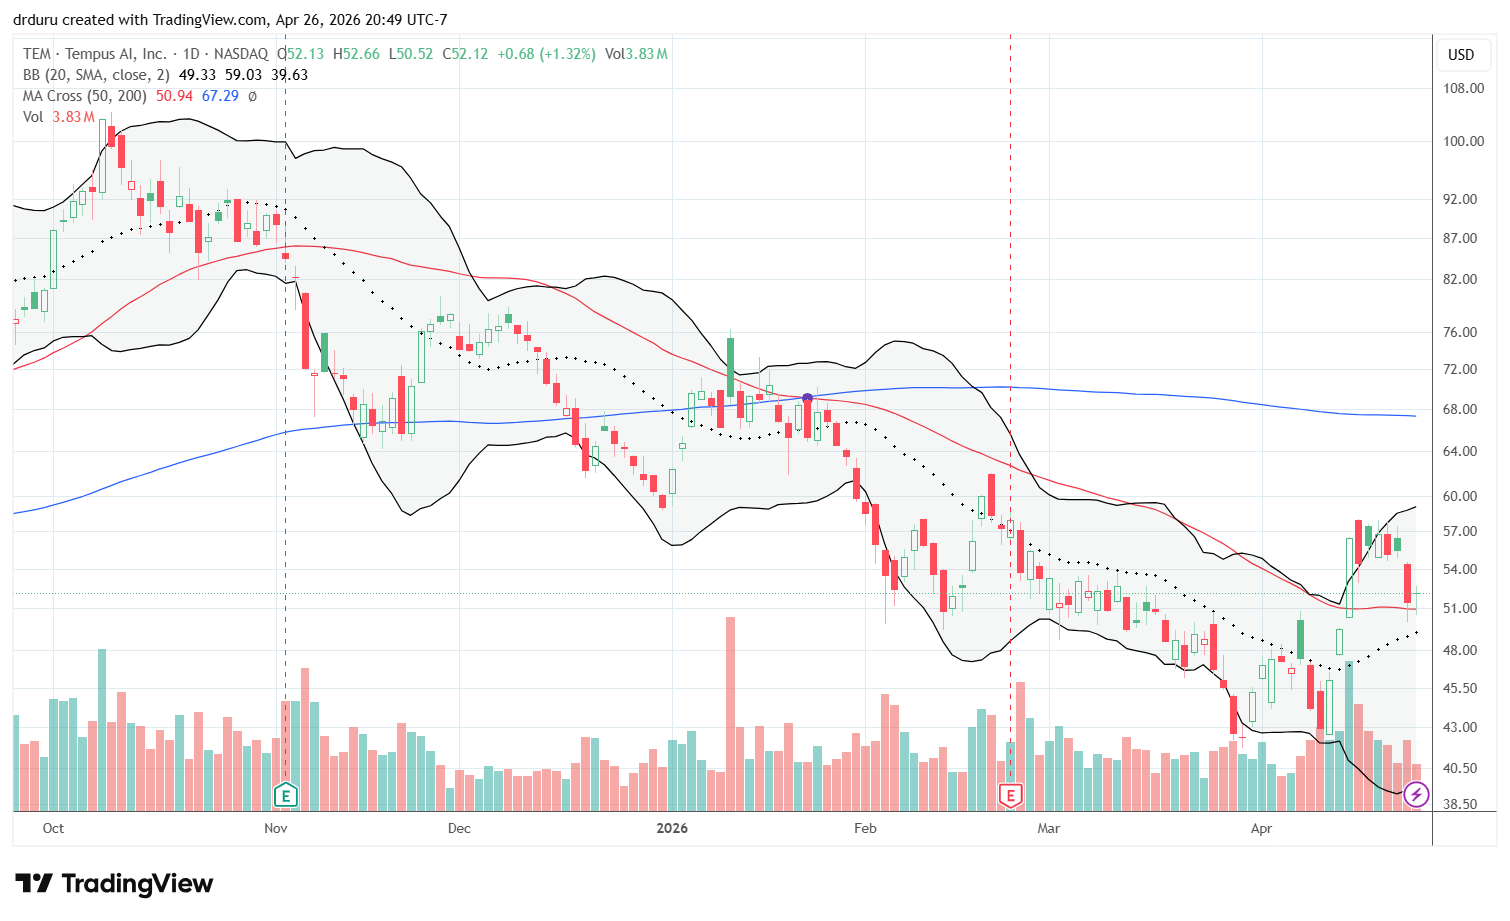
Tempus AI (TEM)
Description: Tempus AI provides data-driven precision medicine and healthcare technology services.
Technical status: Tempus AI (TEM) held 50DMA support twice despite Thursday’s sharp pullback. An uptrending 20DMA looks ready to provide additional support.
Trade commentary: I started watching TEM after the previous week’s 13.9% surge and 50DMA breakout. Now the stock is officially on my shopping list after holding 50DMA support on a pullback. The stock market is clearly fickle about this stock, so I will have a tight stop below 20DMA support. I also need to do more study on this business and figure out whether it is an AI play or subject to the AI Panic as a software stock.
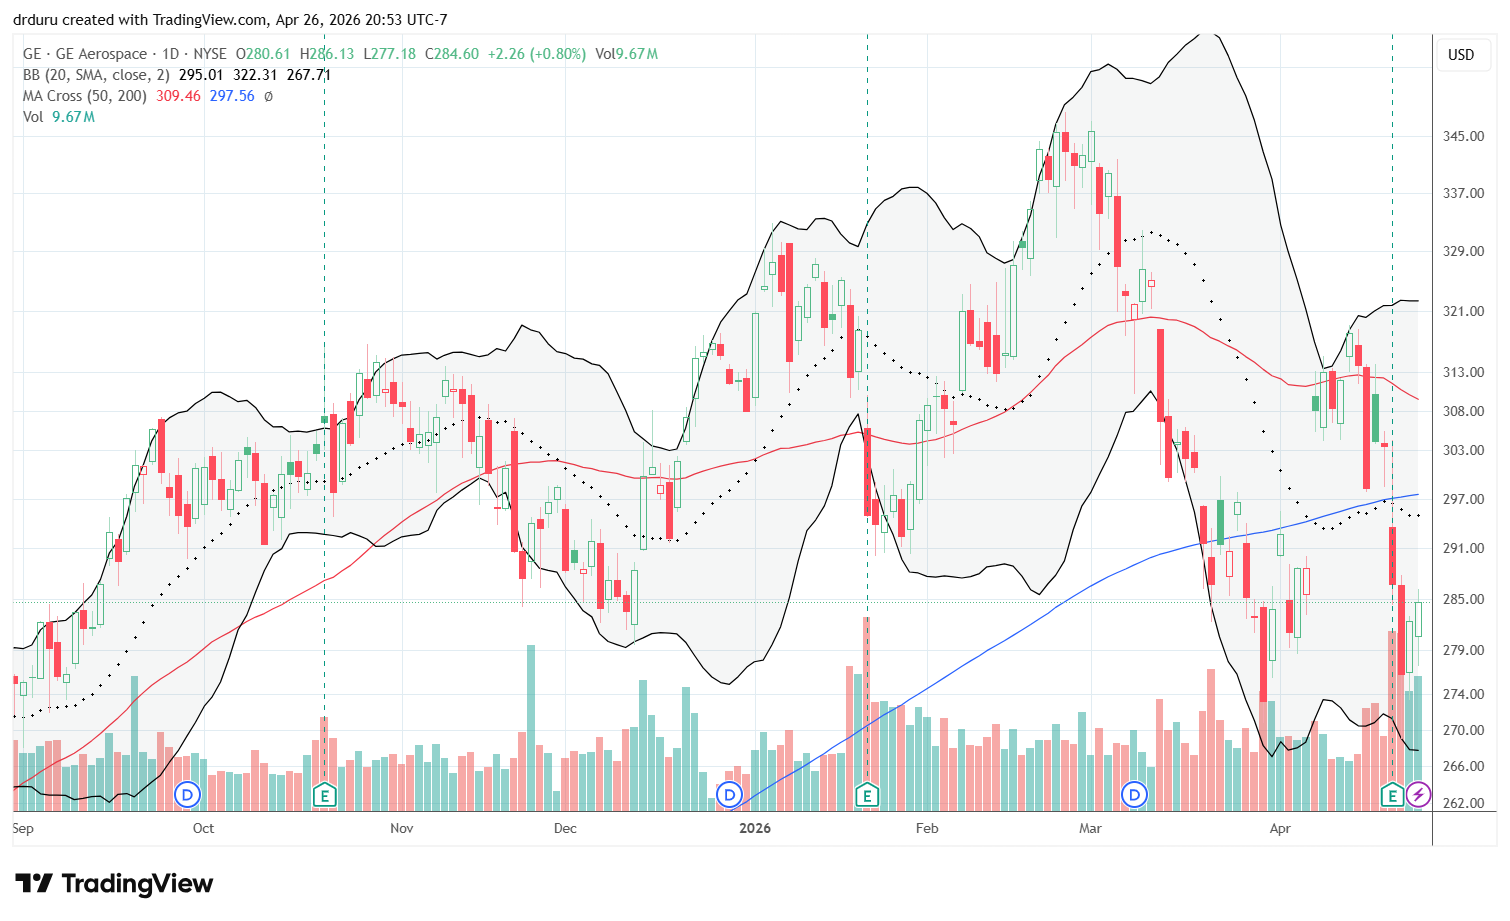
GE Aerospace (GE)
Description: GE Aerospace manufactures aircraft engines, aerospace systems, and related services.
Technical status: GE Aerospace (GE) fell below its 200DMA again on post-earnings weakness. A rebound to end the week preserved the 2026 lows as support.
Trade commentary: I am bullish on industrial stocks so seeing this weakness in GE concerns me. The stock is in bearish territory and has gone nowhere since last August. I might short the stock on a new 2026 low given how far the stock has run; almost four years ago GE traded around just $40.
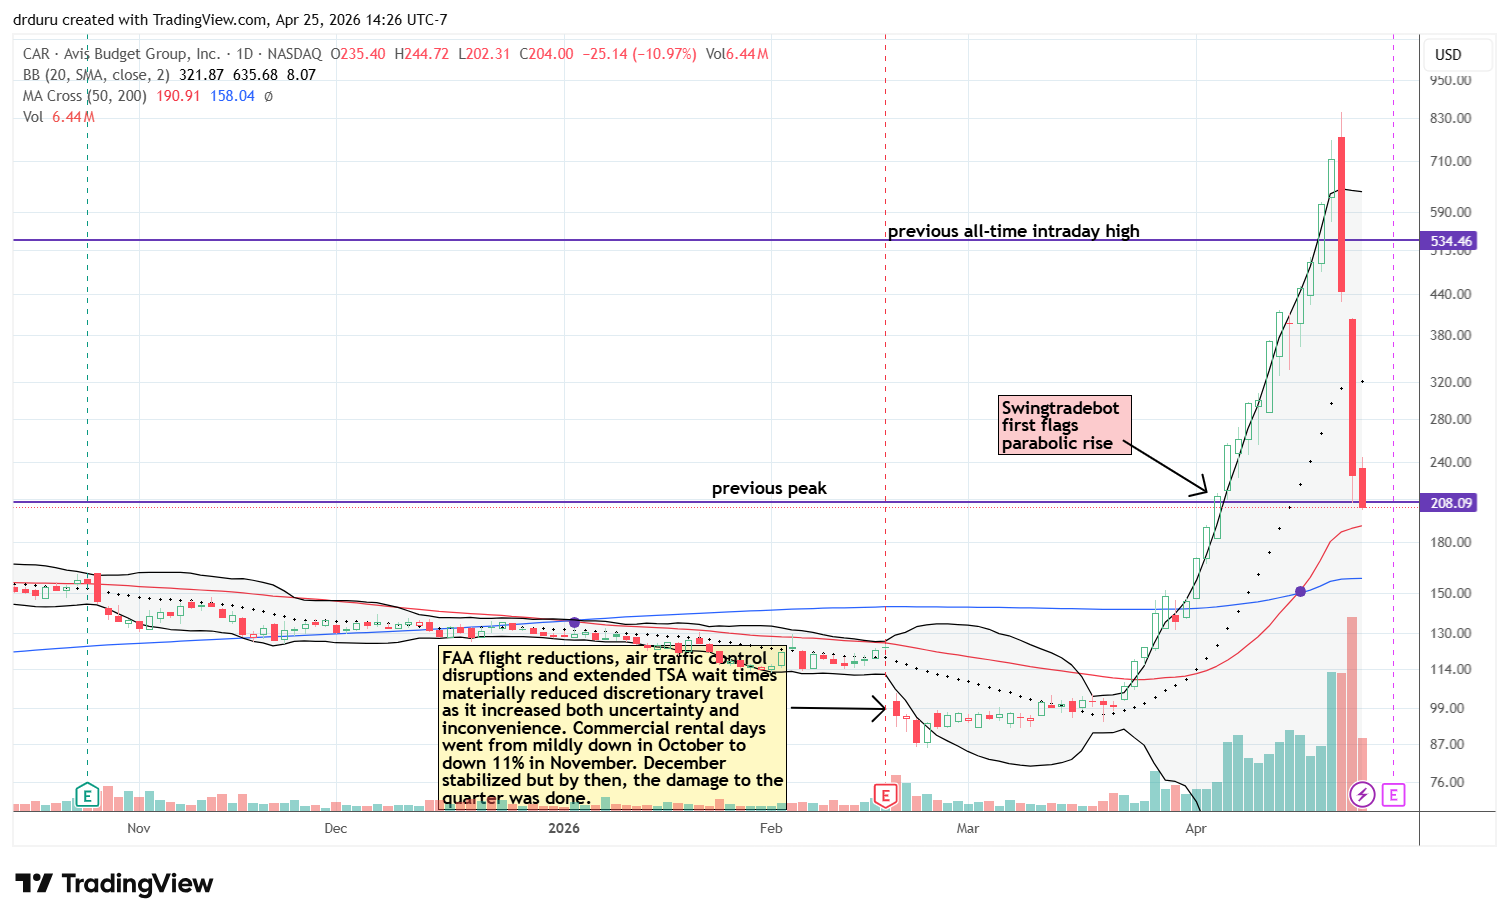
Avis Budget Group (CAR)
Description: Avis Budget Group provides vehicle rental and mobility services.
Technical status: Avis Budget Group (CAR) completed a parabolic rise followed by a violent collapse.
Trade commentary: I thought I took a small risk when nibbling on a few shares to short CAR earlier this month. I had to stop out of the stock as it just kept rising day after day despite nearly doubling in the two weeks before I shorted the stock. The stock went on to a total 8x gain before the inevitable force of gravity took over. CAR now holds the top position among my examples of the dangers of parabolic moves. Ironically, aggressive buyers can also take lessons from this episode: profits are available for nimble participation in such moves for a few days at a time with a tight stop.
Given the inevitability of a sharp sell-off whenever the buying frenzy ended, I remained focused on reentering a short position; the second round included a put spread. While I am glad I stayed focused on the short opportunity, I did not anticipate a near total collapse in just two days. On Wednesday, CAR made the classic blow-off top with a gap higher, well above its upper Bollinger Band, and then persistent selling the rest of the day. After sellers took CAR past the previous day’s intraday low, a bearish engulfing top was in place and the floodgates of selling opened up. CAR finished that day down 37.8%. I held my short position in anticipation of more downward momentum.
The gap down on Thursday confirmed ongoing weakness. I thought I did well to take profits at the 20DMA, but that support held for just a short time (lesson – wait to see the bounce before covering in such an ongoing collapse). Buyers looked completely exhausted from the mind-boggling run-up to $830. CAR continued to slide to a 48.4% loss on the day. Only support from the previous peak slowed down the selling. CAR lost 11.0% more on Friday as buyers struggled to defend support around $208.
This whole episode strikes me as completely manufactured by an algorithmic type of trading plan, whether a meme stock pump and dump and/or short squeeze. The buying on the way up was incredibly persistent and consistent with only the briefest of dips. The 15-minute chart reveals the orderly nature of the buying on the way up and the complete collapse as buyers disappeared on the way down.
You can also clearly see the technical nature of the trading as the selling finally slowed on the approach to $208 support. As soon as CAR turned negative on the 22nd, the profit-taking began in earnest. The algorithms previously driving the stock higher acted like they had their orders to abandon ship.
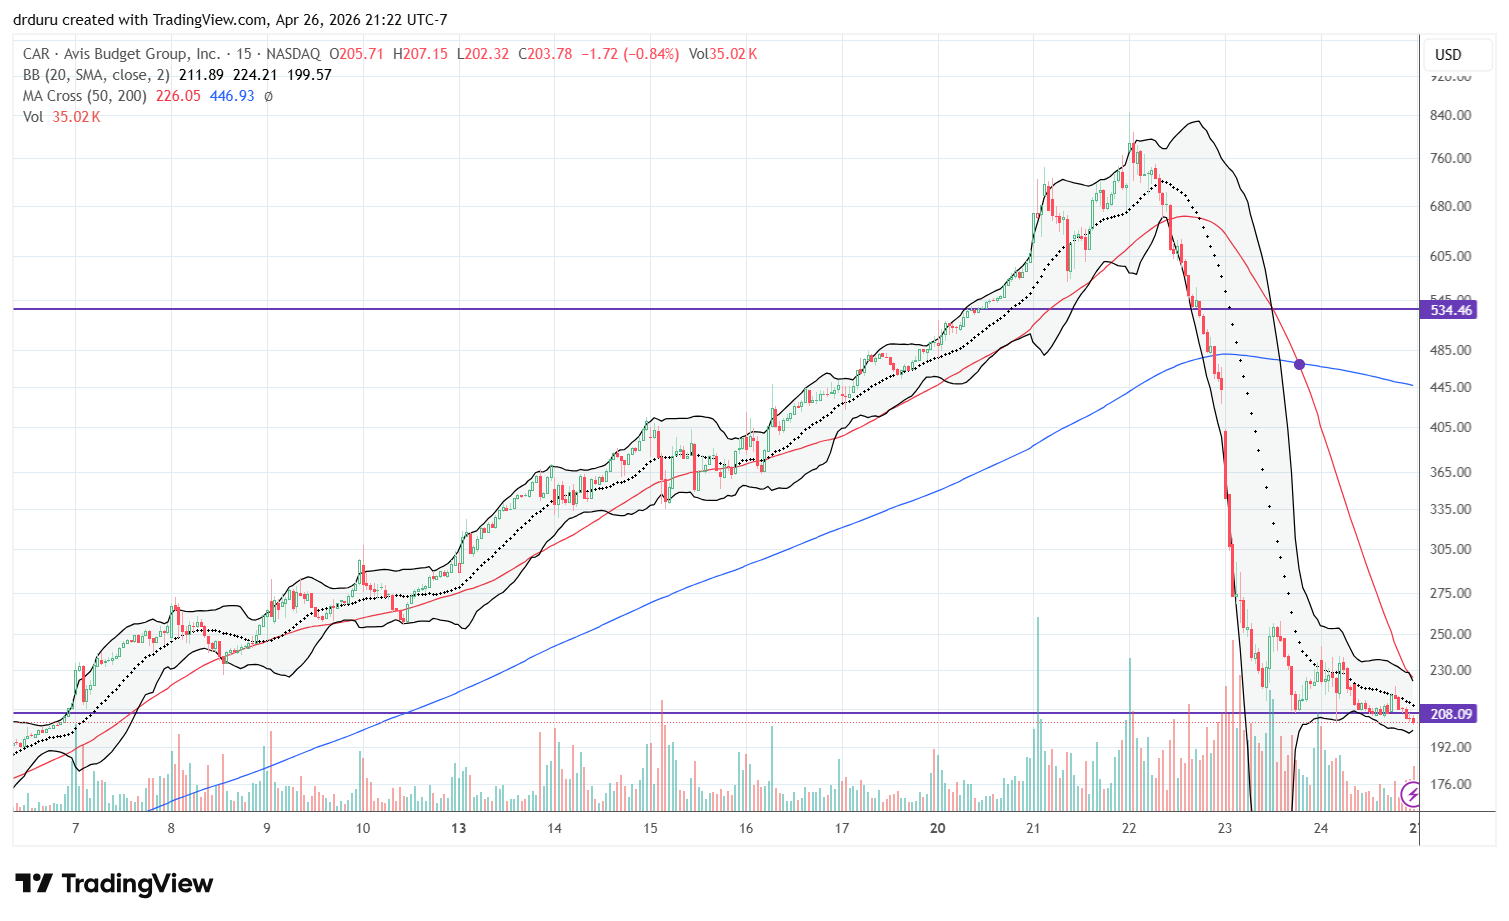
I took my second swing at a short position on the 21st. On that day CAR accelerated to the upside in what looked like the first part of a blow-off top. I patiently waited for confirmation. I thought the swift selling in the next two hours confirmed the blow-off top, and I reentered a small short position. However, the buyers managed one more run before the gas ran out for good on a sustained blow-off top.
This whole meme stock / short squeeze episode is even more mind-boggling given Avis has a very poor business. A high debt load is going to severely challenge the company in the next year or two as revenues stagnate. The video below explains the details of Avis’ poor financial position. Needless to say, I will be watching the company’s earnings closely after-market on April 29th.
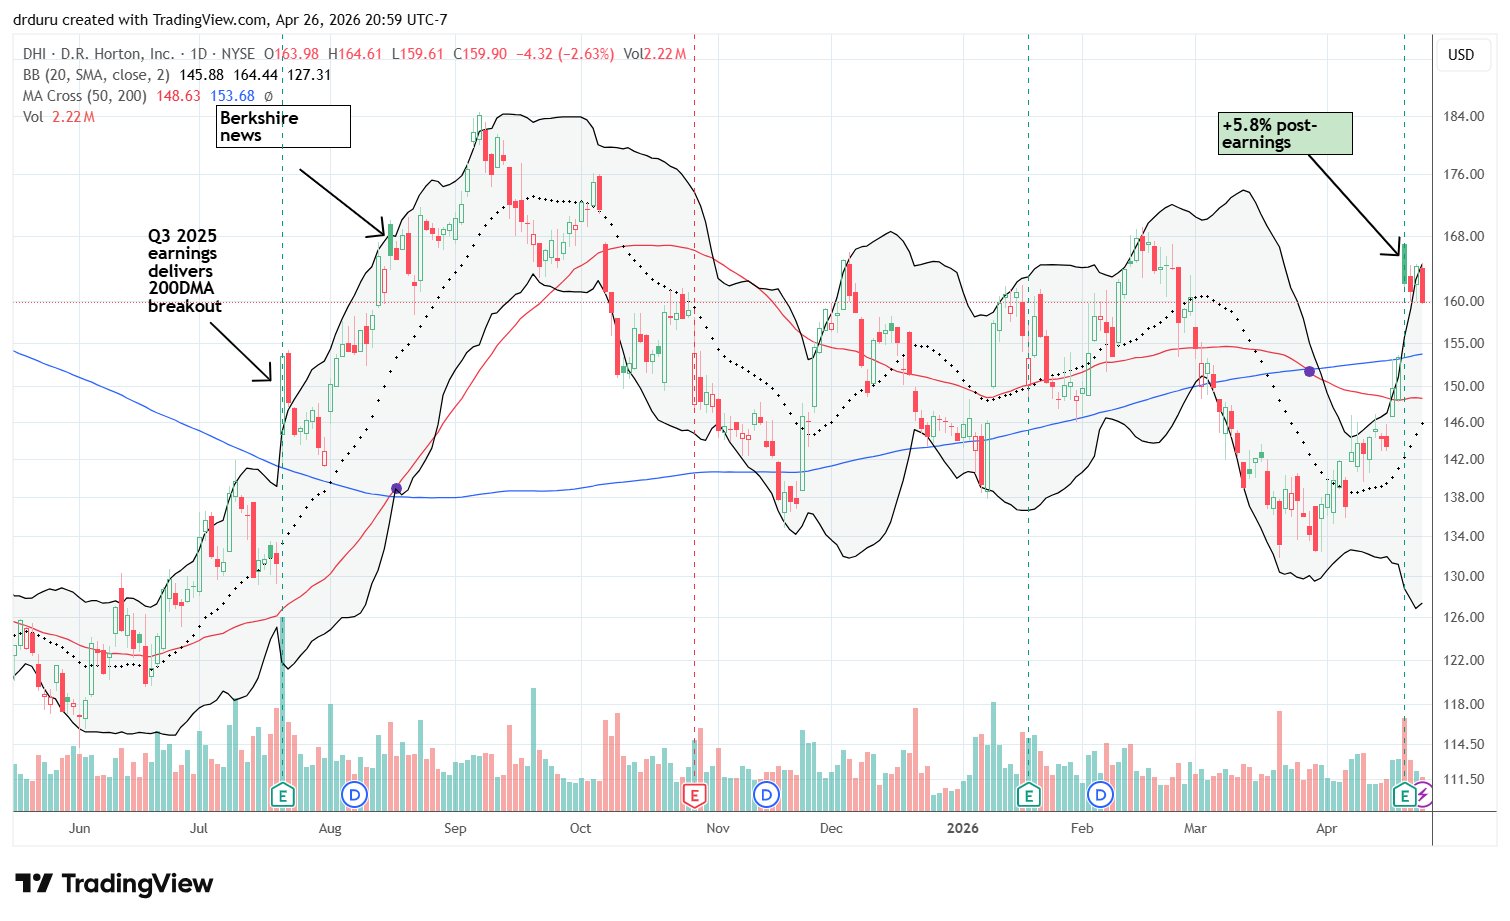
D.R. Horton (DHI)
Description: D.R. Horton builds and sells residential homes in the United States.
Technical status: D.R. Horton (DHI) jumped 5.8% post-earnings but faded after failing to break through resistance from the previous peak.
Trade commentary: I ended the seasonal homebuilder trade early, but I held my remaining positions. DHI was the last position I took in the trade as the stock dropped to 200DMA support in early March. I promptly took profits as the stock opened well above its upper Bollinger Band. Note how DHI not only stalled at resistance from the previous peak, but also the stock is stalling where it traded when news broke of Berkshire’s position in the company.
I have one position remaining from the seasonal trade on home builders. I will write more about my housing-related trades in this month’s housing market review.
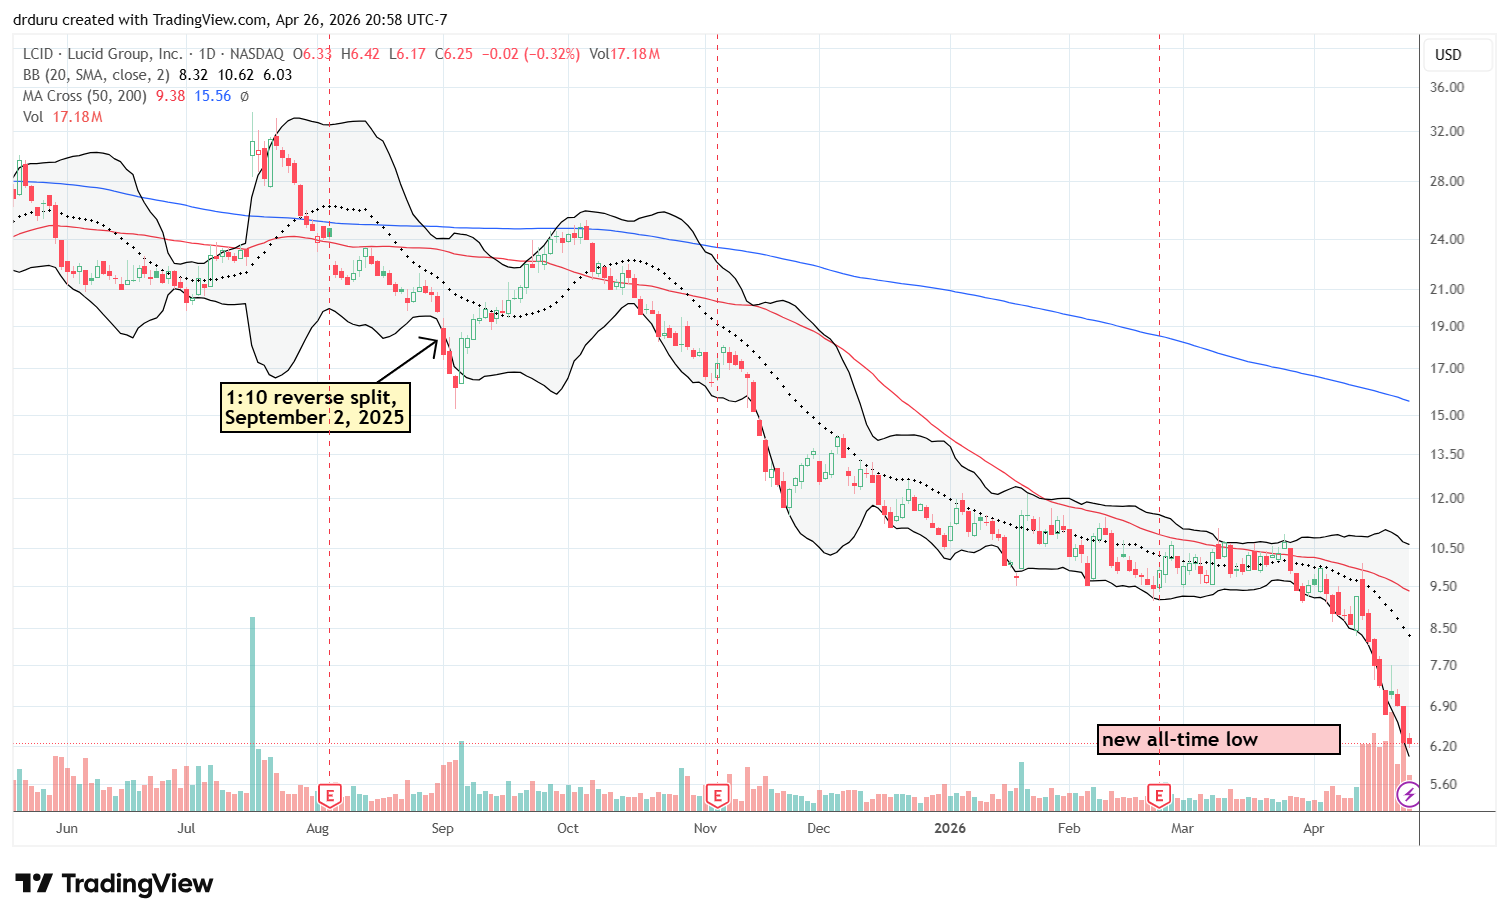
Lucid Group (LCID)
Description: Lucid Group designs and manufactures electric vehicles and related technology.
Technical status: Lucid Group, Inc (LCID) resumed its downtrend after failing at converged 20DMA and 50DMA resistance. Selling volume surged soon after.
Trade commentary: A new all-time low in November was enough to validate my exit from LCID; reverse splits are almost always a bad sign for a company. The stock has fallen almost 50% since the November all-time low. Worse, in the last two weeks trading volume has surged. Not even news of a partnership with Uber Technologies, Inc (UBER) slowed the selling. I am now worried that the company is on its way out. The EV business has been brutal and killed off a lot of hopeful entrants. Another reverse split will all but seal the deal and take Lucid permanently off my buy list…the stock and the car.
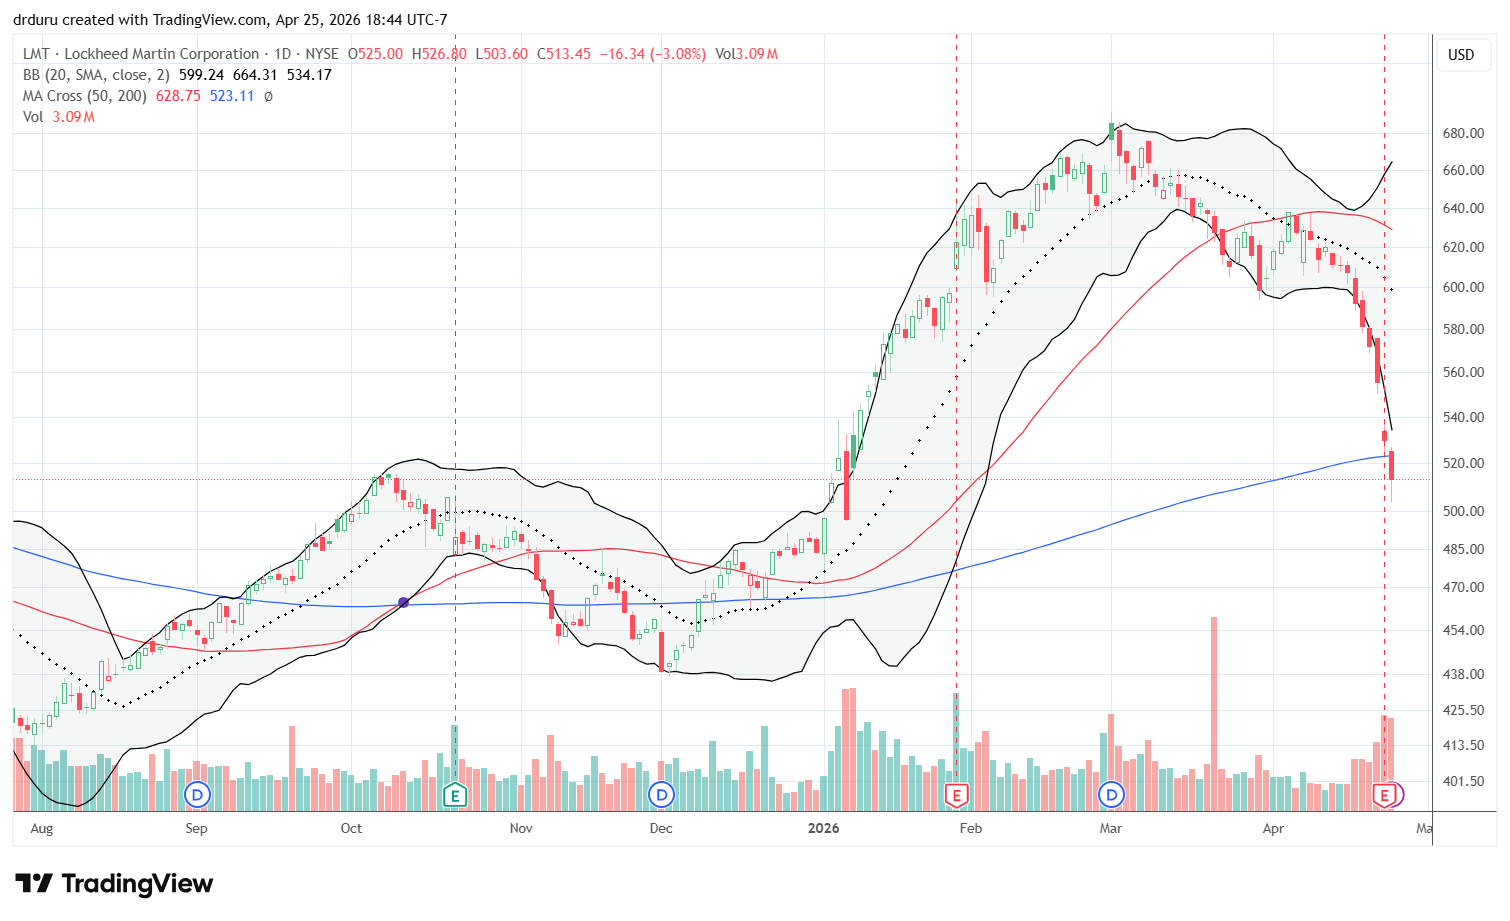
Lockheed Martin Corporation (LMT)
Description: Lockheed Martin Corporation is an aerospace and defense company that develops and manufactures military aircraft, missiles, space systems, and advanced technology products and services for government and commercial customers.
Technical status: Lockheed Martin Corporation (LMT) fell 4.6% post-earnings and the next day broke down below 200DMA support with an additional 3.1% loss.
Trade commentary: I am surprised to see defense stocks like Lockheed Martin Corporation (LMT) performing so poorly this year. Ironically, LMT peaked right before the start of the war with Iran. It has sold off ever since. Now, LMT is in bearish territory and adding to the drag on market breadth. Of course, this trading is consistent with a market that trades like the war will have no further impact on financial markets.
Be careful out there!
Footnotes
Subscribe for free to get email notifications of future posts!
“Above the 50” (AT50) uses the percentage of stocks trading above their respective 50-day moving averages (DMAs) to measure breadth in the stock market. Breadth defines the distribution of participation in a rally or sell-off. As a result, AT50 identifies extremes in market sentiment that are likely to reverse. Above the 50 is my alternative name for “MMFI” which is a symbol TradingView.com and other chart vendors use for this breadth indicator. Learn more about AT50 on my Market Breadth Resource Page. AT200, or MMTH, measures the percentage of stocks trading above their respective 200DMAs.
Active AT50 (MMFI) periods: Day #190 over 20%, Day #17 over 30%, Day #13 over 40%, Day #12 over 50%, Day #8 over 60% (overperiod), Day #163 under 70% (underperiod)
Source for charts unless otherwise noted: TradingView.com
Full disclosure: long SPY put spread, long MSFT, long NOW shares and call spread, long NKE, long DG, long ISRG, long IWM vertical calendar call spread
FOLLOW Dr. Duru’s commentary on financial markets via StockTwits, BlueSky, and even Instagram!
*Charting notes: Stock prices are not adjusted for dividends. Candlestick charts use hollow bodies: open candles indicate a close higher than the open, filled candles indicate an open higher than the close.
* Blog notes: this blog was partially written based on the heavily edited transcript of the following video that includes a live review of the stock charts featured in this post. I used ChatGPT to process the transcript.