
The Market Breadth Summary
- Oil looms over financial markets as geopolitical tensions and potential disruptions in the Strait of Hormuz pressure equities, commodities, and bonds.
- Rising oil prices have coincided with declining stock indices, reinforcing a short-term inverse relationship between energy prices and equity performance.
- Oversold signals are approaching as breadth declines and the Fear and Greed Index remains in extreme fear territory.
- Treasury bonds weakened despite economic concerns, suggesting inflation fears tied to higher oil prices are outweighing traditional safe-haven demand.
- Commodity producers broke key technical support levels.
- Risk management is ever more critical as oil looms over markets, making position sizing and disciplined trading decisions more important than attempting to predict geopolitical outcomes.
Stock Market Commentary
Oil prices loom over financial markets. Oil prices are being driven largely by whether the Strait of Hormuz remains effectively closed following Iran’s retaliation against attacks by the U.S. and Israel. The inverse correlation over the last two weeks has been clear: oil prices up, stock prices down and vice versa. The volatility has sent the indices on wild rides. Yet, while the major indices closed at their lowest points since the war began, the plunge in market breadth tells me that things could and should be a lot worse.
War is costly, destructive, and tragic. It is thus easy to let worry and concern slip into panic. However, history constantly reminds us that panic is a poor investing or trading strategy. Instead, this is a time to make sure portfolios and trades are well-aligned to risk tolerances. Short-term traders in particular should adjust by reducing trading sizes and frequency. Trying to predict the duration of the war or outcomes is not useful and even pointless. The only things a trade or investor controls are their decisions over risk management.
Thus, while oil looms over everything, I am not obsessing over oil prices. Oil prices will be volatile and move with the winds and whims of war. I will be treating this episode like any other shock to the system. At some point, things get bad enough that policy makers respond and reverse the shock and/or assets become priced well below their long-term value.
Speaking of policy makers, on Wednesday the Federal Reserve gets the difficult task of speaking calm into roiling markets. I am wondering whether Steve Miran will vote to lower interest rates even as all his other colleagues vote for no change. Will one lone “hawk” even vote to hike rates?
The Stock Market Indices
S&P 500 (SPY)
The S&P 500 continued its decline as oil pressure weighed on markets. Selling accelerated the last two days of the week, and the index closed at a 4-month low. This conclusion to the week ended a months-long pattern of buyers stepping into the fray as soon as the index dropped to or beyond its lower Bollinger Band (BB) (the solid black lines in the chart below). This change in behavior is a warning that buyers are losing their interest (and courage) and sellers are gaining sway over market dynamics. A test of support at the 200-day moving average (DMA) (the blue line below) is a day’s worth of losses away.
A test of 200DMA support would represent a major moment. The index has not touched that trendline since May of last year and has not closed below it since April.

NASDAQ (COMPQ)
The NASDAQ closed below its 200DMA to end the week. By my technical definition, a close below the 200DMA places the index in bear market territory. I do not wait for a 20% decline from the all-time high to define a bear market. A close below the 200DMA qualifies. A lower close from here would confirm a new bearish trading phase for technology stocks that would also further confirm the double top show below. The tech-laden index closed right at its closing low from last November. Like the S&P 500, the NASDAQ has effectively gone nowhere since September.

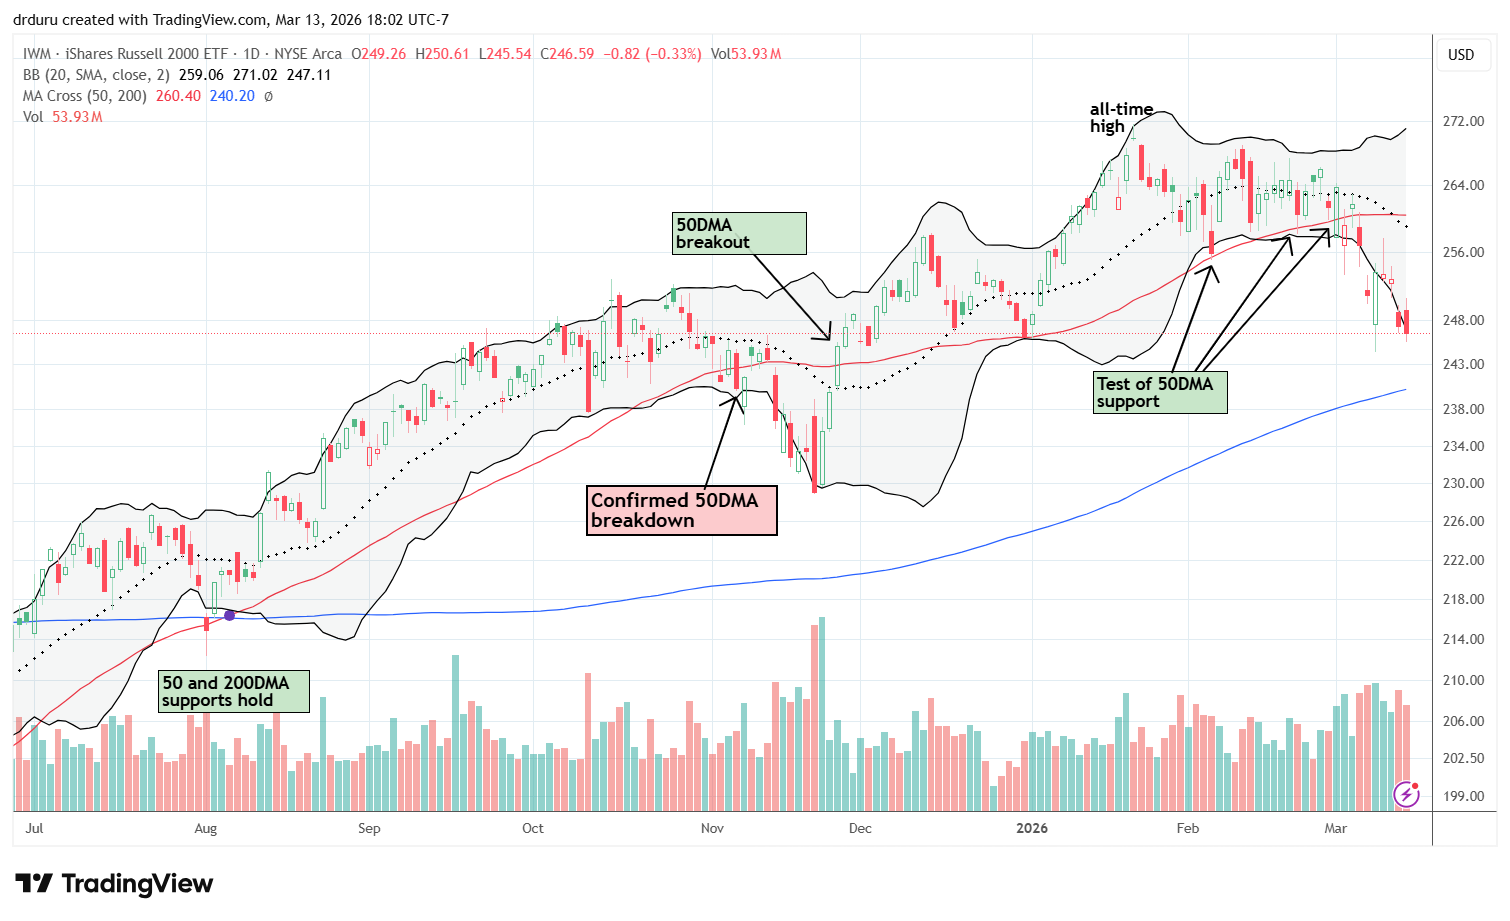
iShares Russell 2000 ETF (IWM)
IWM continues to outperform the other two major indices on a relative technical basis. Not only is IWM still well above its 200DMA, but also the ETF of small caps held support at its December closing low. However, I fully expect at this point an imminent test of 200DMA support. In the meantime, I have managed to trade fast enough to profit from my typical calendar call spread strategy. These weekly calendar calls are particularly effective during periods of high volatility because the short side falls much faster in value than the long side when volatility reverses. Moreover, the long side retains value better as time to expiration approaches for the short side.
The Short-Term Trading Call With Market Fears
- AT50 (MMFI) = 29.1% of stocks are trading above their respective 50-day moving averages
- AT200 (MMTH) = 46.3% of stocks are trading above their respective 200-day moving averages
- Short-term Trading Call: neutral
AT50 (MMFI), the percentage of stocks trading above their respective 50DMAs, closed the week at 29.1%. My favorite technical indicator undercut the intraday low from Monday’s big reversal day and closed right at its closing low from November. A sharp fade from intraday highs on Tuesday ignited a persistent slide in market breadth that threatens to revive the bearish trend I though ended at the beginning of the week. It is tempting to flip bearish on the short-term trading call given the technical breakdowns accompanying market breadth’s decline. However, AT50 is now close to oversold levels. By rule, I never change the market call this close to AT50 levels that come with an automatic change in trading call. The short-term trading call is always bullish when AT50 trades below 20%.
")
A fresh deterioration in longer-term market breadth is adding to the bearish pressure in the stock market. AT200 (MMTH), the percentage of stocks trading above their 200DMAs, suffered an accelerated descent last week. The indicator closed well below its November low and returned to levels last seen in August of last year.
")
While AT50 has not yet reached my oversold level, the CNN Fear and Greed Index has been in its oversold, extreme fear zone since last week. A similar gap in oversold readings occurred last November. Thus, I recognize that traders and investors may jump into buying mode at any time before AT50 gets to 20%. Yet one more reason to avoid getting bearish at this juncture.

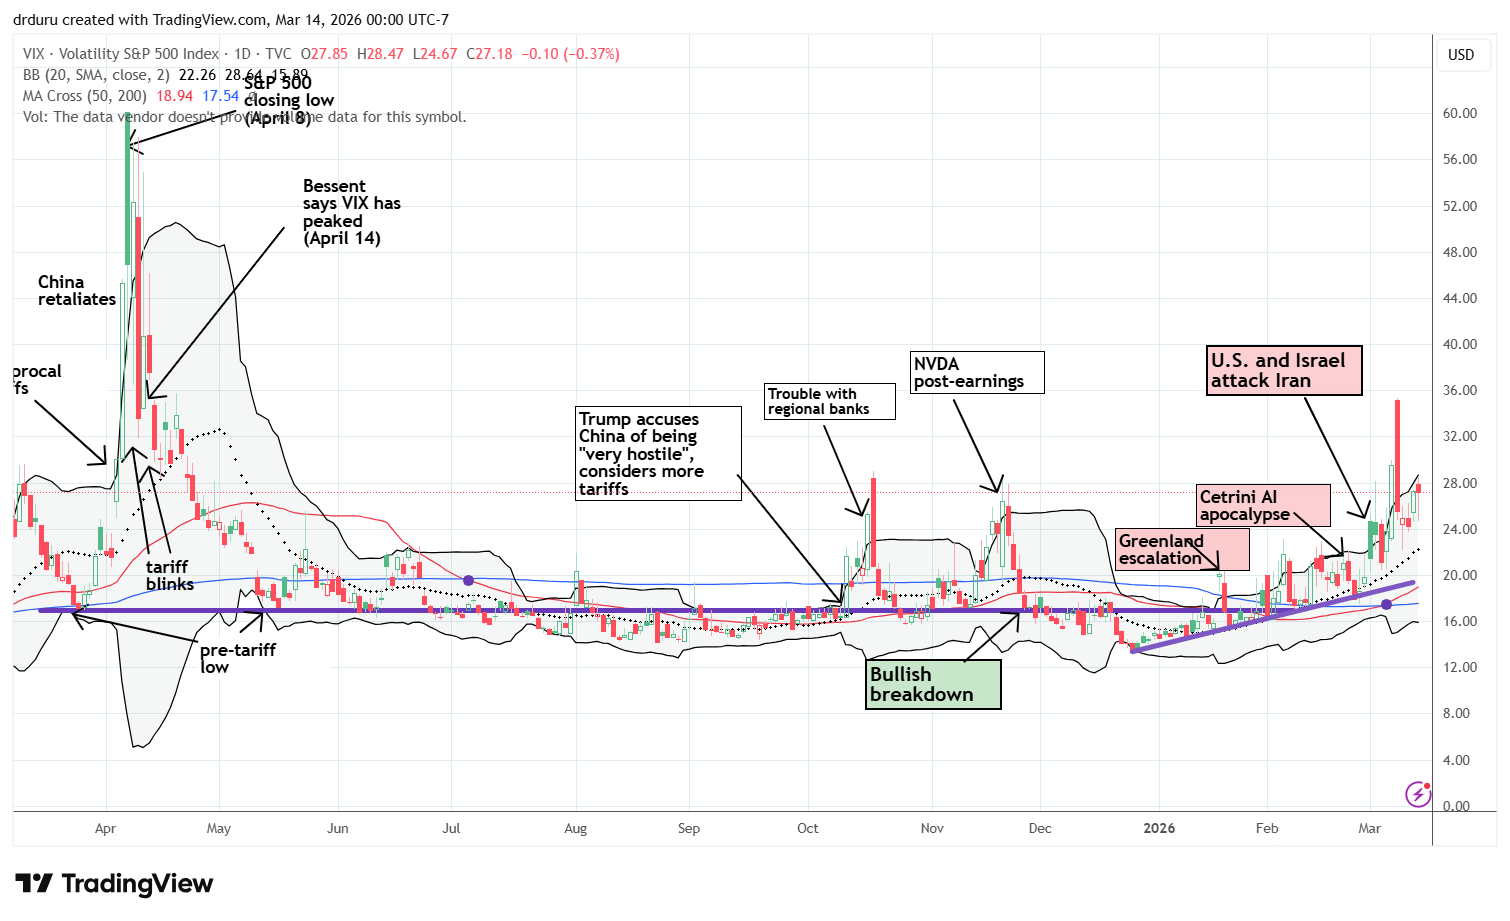
The volatility index (VIX) actually lost 7.8% for the week, a surprising divergence from the closing lows across the indices. This decline for the week masks the VIX’s surge on Monday that featured a gap open to 35.1, a 19% jump from the elevated close from the previous Friday. The subsequent sharp fade to a 13.5% loss on the day is a classic VIX topping signal and helped to convince me in the bullishness of Tuesday’s trading action. The ability of the VIX to creep higher for the remainder of the week represents the staying power of sellers over buyers.
In case you missed it…
Vertiv Holdings (VRT), my favorite AI play among individual stocks, FINALLY got the nod for S&P 500 inclusion. However, the data suggest this event could mark the end of the stock’s outperformance (in the short-term). I also discussed the concept of “war proofing” your money using classic risk amangement.
United States Oil Fund (USO)
Description: The United States Oil Fund (USO) is an exchange-traded fund designed to track the daily price movements of West Texas Intermediate crude oil.
Technical status: United States Oil Fund (USO) rose rapidly after the U.S. and Israel attack on Iran, and quickly recovered after a sharp reversal.
Trade commentary: USO serves as a proxy for oil prices. The inverse correlation between rising oil and falling stock prices was even clearer in the second week of the war against Iran. USO’s sharp fade on Monday had the classic structure of a blow-off top. When oil fell further the next day – after the U.S. Energy Secretary erroneously reported that a U.S. Navy ship successfully escorted a tanker through the Strait of Hormuz – the follow through seemed to confirm a top for oil. That day’s relief faded into a fresh rally for oil and stocks slid for the rest of the week as oil continued higher. Oil prices remained resilient even after both the U.S. and the International Energy Agency (IEA) announced plans to release oil from strategic reserves. Clearly, as long as the Strait of Hormuz remains effectively closed, oil will stay resilient, even go higher.
In the meantime, I tried one more fade of USO with a calendar put spread. I consider this a trade worth having in place just in case the situation turns on a dime. A March $82 remains from my first ill-fated fade. I next moved to monthly calendar put spreads with strike prices of $88 and $90. I fully expect to go into April with the long sides of these puts in place. One more attempted fade makes sense to me if USO reaches $140. Again, the premise is that at some point conditions bad enough that policy makers are forced to respond as the market demands.
")
iShares 20+ Year Treasury Bond ETF (TLT)
Description: The iShares 20+ Year Treasury Bond ETF (TLT) tracks the investment results of an index composed of United States Treasury bonds with remaining maturities greater than twenty years.
Technical status: The iShares 20+ Year Treasury Bond ETF (TLT) broke down below both its 50DMA and 200DMA, dropping down to the February low.
Trade commentary: Rising oil prices increased inflation concerns enough to get bond players selling Treasury bonds. The increase in yields pushed TLT down. The result is an unusual situation in which bonds are not serving their typical safe-haven role. This plunge in TLT is even more stark because weakening GDP growth is flashing warning signs for the economy. I fully expect safe haven buying to wake up in due time, so I am buying TLT per my new strategy to play along with the bond market’s (previous) complacency about the prospects for inflation.
")
SPDR Gold Shares (GLD)
Description: SPDR Gold Shares (GLD) is an exchange-traded fund designed to track the price performance of gold bullion.
Technical status: SPDR Gold Trust (GLD) initially gapped higher after the war began but quickly reversed with a gap down the following day, falling through its 20DMA.
Trade commentary: My gold trade currently consists of a GLD April $500 call option after I closed the near worthless short side of my calendar call spread. Since shorting a February $400 GLD put, I am still in the green, but now my April $500 needs to carry its weight. Unfortunately, current momentum suggests GLD will test 50DMA support before rallying again. (As a reminder, VanEck Real Assets ETF (RAAX) has become my core gold and commodities play).
")
BHP Group (BHP)
Description: BHP Group (BHP) is a multinational mining company producing commodities such as iron ore, copper, nickel, and other resources.
Technical status: BHP Group Ltd (BHP) fell sharply from its all-time high, breaking down below its 50DMA and closing the week at a 1-month low.
Trade commentary: I stopped out of BHP after the stock’s breakdown below its 50DMA. Given the stock market’s sell-off, my risk management rules compelled me to protect my remaining profits. I was hopeful after the rebound from its first 50DMA breakdown. A second 50DMA breakdown is a huge red flag. Once oil prices fall, I expect commodity producers like BHP to rebound quickly since commodity producers rely on oil to power much of their machinery. The big wildcard will be the health of the global economy in the aftermath of the war.
")
Rio Tinto (RIO)
Description: Rio Tinto (RIO) is a global mining company producing iron ore, aluminum, copper, and other industrial minerals.
Technical status: Rio Tinto plc (RIO) broke down below its 50DMA, and dropped again after failing its 50DMA resistance test.
Trade commentary: Like BHP, I gave RIO room after it first broke down below its 50DMA. My case was even stronger to stop out of the position and preserve remaining profits. RIO never truly recovered from the breakdown and created a failure at 50DMA resistance in the final two days of the week. That selling confirmed a bearish 50DMA breakdown for RIO.
")
Freeport-McMoRan (FCX)
Description: Freeport-McMoRan (FCX) is a mining company primarily producing copper, gold, and molybdenum.
Technical status: Freeport-McMoRan Inc (FCX) broke down below its 50DMA, continuing to drop until hitting its lower Bollinger Band.
Trade commentary: I took profits in my FCX position after its first 50DMA breakdown. At the time I hoped RIO and BHP would remain in my portfolio and maybe I would buy back into FCX on a confirmed recovery. Instead, I am now left with my rare earth positions as stock specific commodity plays. I am currently wrestling with whether I need to change my strategy for rare earth stocks.
")
SPDR S&P Retail ETF (XRT)
Description: SPDR S&P Retail ETF (XRT) tracks the performance of retail companies in the S&P Total Market Index.
Technical status: The State Street SPDR S&P Retail ETF (XRT) declined throughout the month and broke below its 200DMA, closing at price levels last seen in November.
Trade commentary: Higher oil prices reduce consumer spending power. That dynamic has weighed heavily on retail stocks. I previously bought a XRT call option last month when the main headline was tariff refunds. That trade immediately went south and the war eliminated any hope for a short-term recovery. Now I am considering shorting XRT as long as oil prices remain elevated.
")
Dollar General (DG)
Description: Dollar General (DG) operates discount retail stores offering household goods, consumables, and general merchandise.
Technical status: Dollar General Corp (DG) dropped by 6% post-earnings, confirmed a 50DMA breakdown, and over-extended below its lower Bollinger Band.
Trade commentary: Even though discount retailers can perform well during recessions, DG broke down after earnings. I expect the downward momentum to continue toward a test of the 200DMA. Last month, I took profits in DG’s peer Dollar Tree (DLTR). That decision now looks timely as DLTR broke down below its 200DMA before earnings. The narrative on both DG and DLTR seem to be shifting away from the bearish to bullish reversal that the two stocks enjoyed into February. Still, I am interested in buying into either stock at key support levels like the 200DMA.

Kohl’s Corporation (KSS)
Description: Kohl’s Corporation (KSS) operates department stores offering apparel, footwear, accessories, and home products.
Technical status: Kohls Corp (KSS) has trended down since a late November peak. This month, KSS broke down below its 200DMA and continued to drop after a severe post-earnings fade.
Trade commentary: KSS surged as much as 13% after earnings before fading. The stock now sits below the levels reached during last summer’s meme stock surge. The chart suggests that a full reversal of that meme-driven move is underway. I have no interest in speculating again in KSS until it recovers 200DMA support.
")
Nike (NKE)
Description: Nike (NKE) designs, markets, and sells athletic footwear, apparel, equipment, and accessories.
Technical status: Nike Inc (NKE) continued its long-term downtrend, reaching its lowest point since last April.
Trade commentary: I continue to use NKE as an example of the dangers of buying against a persistent downtrend in a stock. NKE topped in 2021 and has trended downward ever since. The recent weakness tied to rising oil prices and geopolitical stress has pushed NKE back toward major support levels from the April tariff drama, trauma, and noise.
")
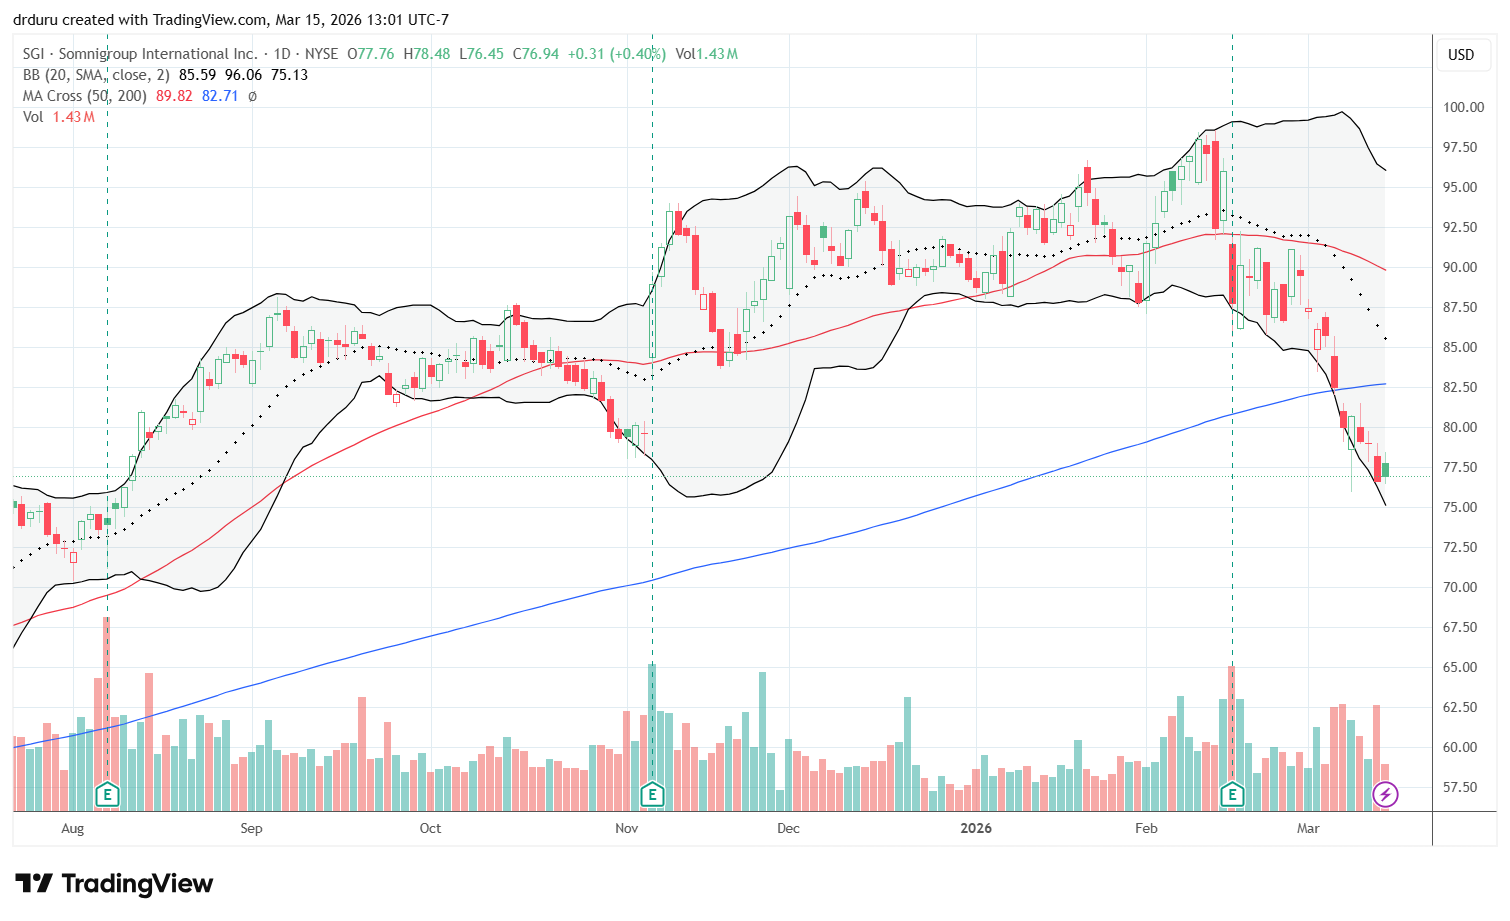
Somnigroup International (SGI)
Description: Somnigroup International (SGI) manufactures and sells mattresses and sleep-related products through various brands.
Technical status: Somnigroup International (SGI) broke below its 200DMA and entered bearish territory. The stock traded near levels last seen in August of the previous year.
Trade commentary: I initiated a short position in SGI after its Thursday follow-through on the bearish breakdown. Even though the market is approaching oversold conditions, I am selectively adding shorts as hedges and as trades to profit from the move toward oversold levels.
Robo Global Artificial Intelligence ETF (THNQ)
Description: Robo Global Artificial Intelligence ETF (THNQ) invests in companies involved in artificial intelligence technologies and applications.
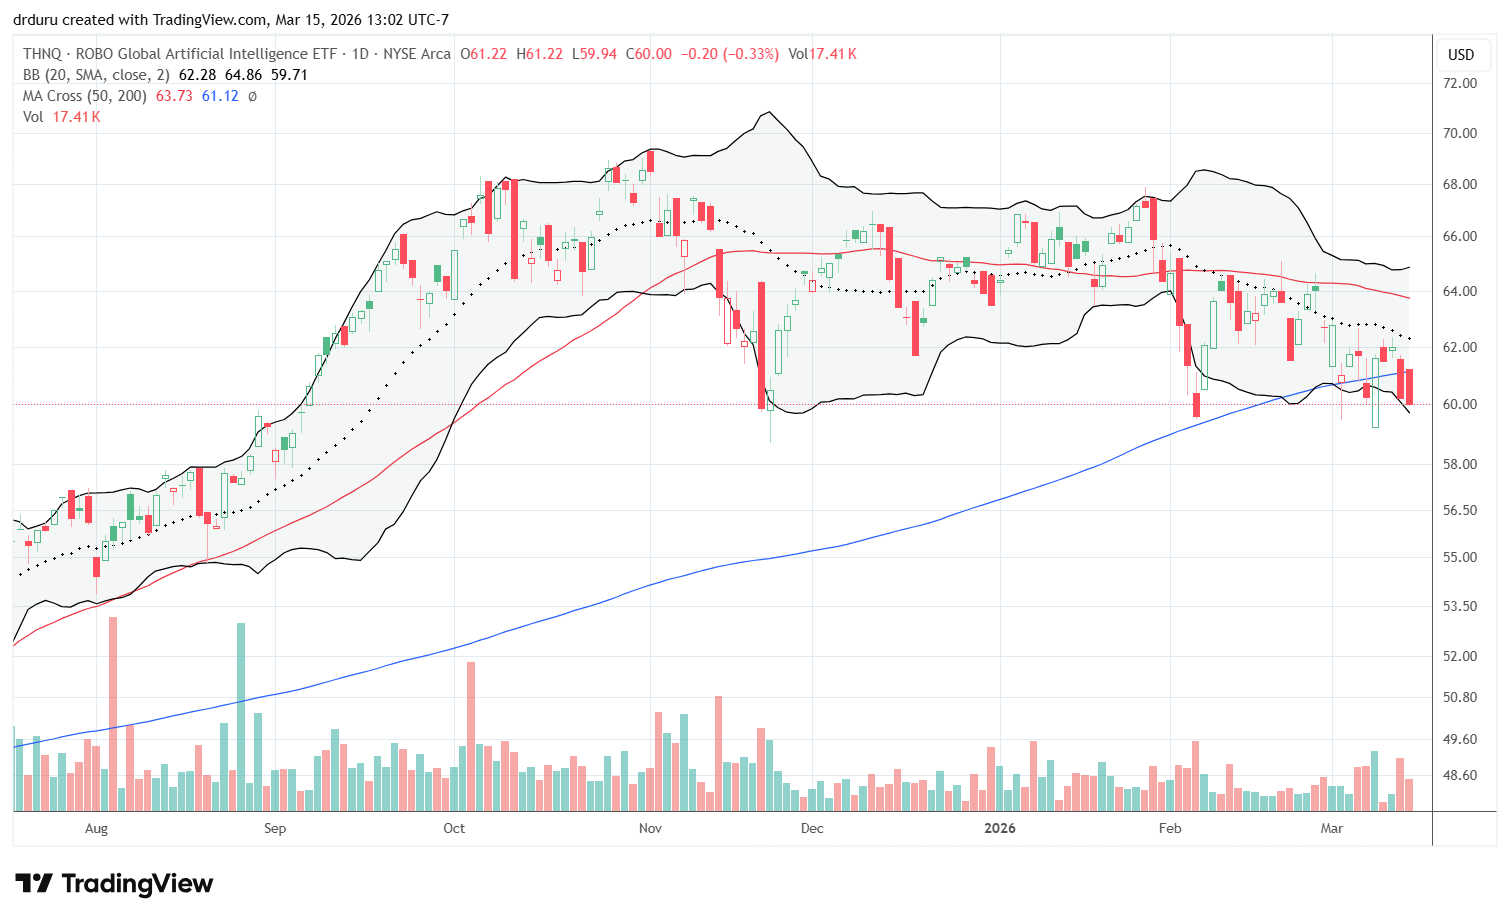
Technical status: Robo Global Artificial Intelligence ETF (THNQ) topped in October and has traded sideways within a broad range since September. The current struggles with 200DMA support add to a topping dynamic for the AI trade.
Trade commentary: THNQ represents my core AI exposure because as an ETF it removes most company-specific risks. Unfortunately, like NVDA, the ETF has gone nowhere for months. As the AI trade continues to struggle in what looks like a topping pattern, THNQ will become the last position standing. As a core position, I am going to stick by it and use future selloffs to pick my way back into individual AI-related stocks.
Vertiv Holdings (VRT)
Description: Vertiv Holdings (VRT) provides digital infrastructure solutions including power management, thermal management, and equipment for data centers.
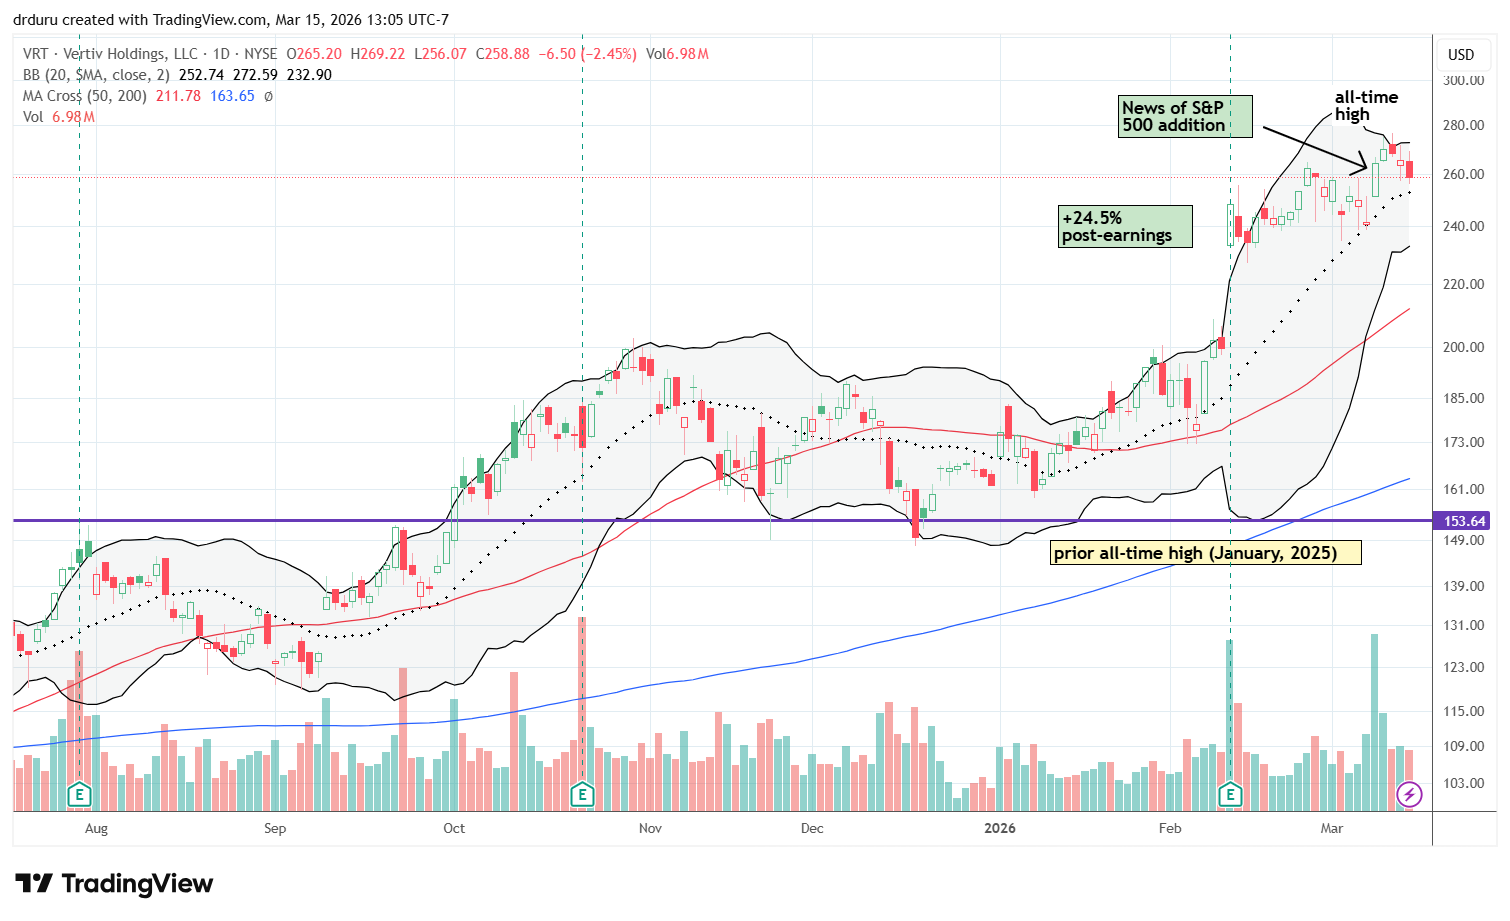
Technical status: Vertiv Holdings (VRT) remains just below its all-time high and held above the opening level from the day news of its S&P 500 inclusion was announced.
Trade commentary: VRT remains my favorite individual AI-related stock. By virtue of substantial appreciation, VRT is one of my largest positions. Thus, my risk management spotlight shines brightest on VRT. If the stock falls below the opening level from the day its S&P 500 inclusion was announced, I will start to reduce the position. As I explained in the video above, the short-term history is precarious for stocks after their inclusion to the S&P 500. A complete reversal of the initial excitement flags a high likelihood of substantial downside to come. Index inclusion can draw in the market’s last enthusiastic buyers for a stock.
iShares Expanded Tech Software Sector ETF (IGV)
Description: iShares Expanded Tech Software Sector ETF (IGV) tracks the performance of North American software companies.
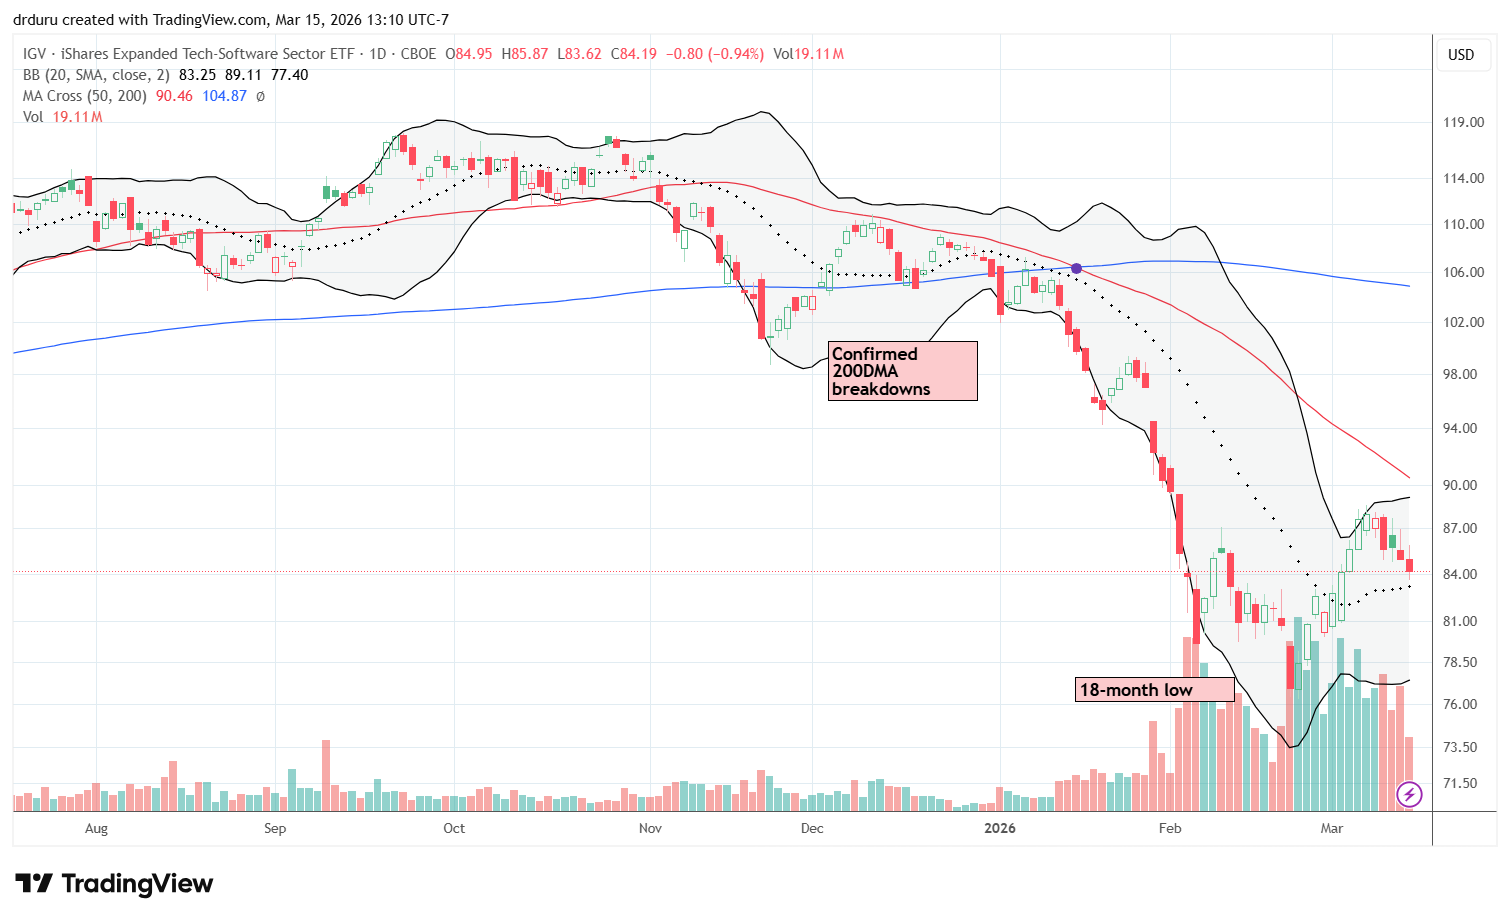
Technical status: iShares Expanded Tech Software Sector ETF (IGV) cooled off after a strong oversold rally from the bottom. The ETF stalled far short of 50DMA resistance.
Trade commentary: The pullback in IGV does not surprise me after a sharp rebound from extreme oversold conditions. I believe the bottom will still hold. However, another test of that bottom remains possible as the AI panic and fears around software stocks continue. Layoffs at Atlassian (TEAM) raised the specter of the SaaSpocalypse yet again.
Domo, Inc (DOMO)
Description: Domo, Inc (DOMO) provides a cloud-based business intelligence and analytics platform for enterprise data management and visualization.
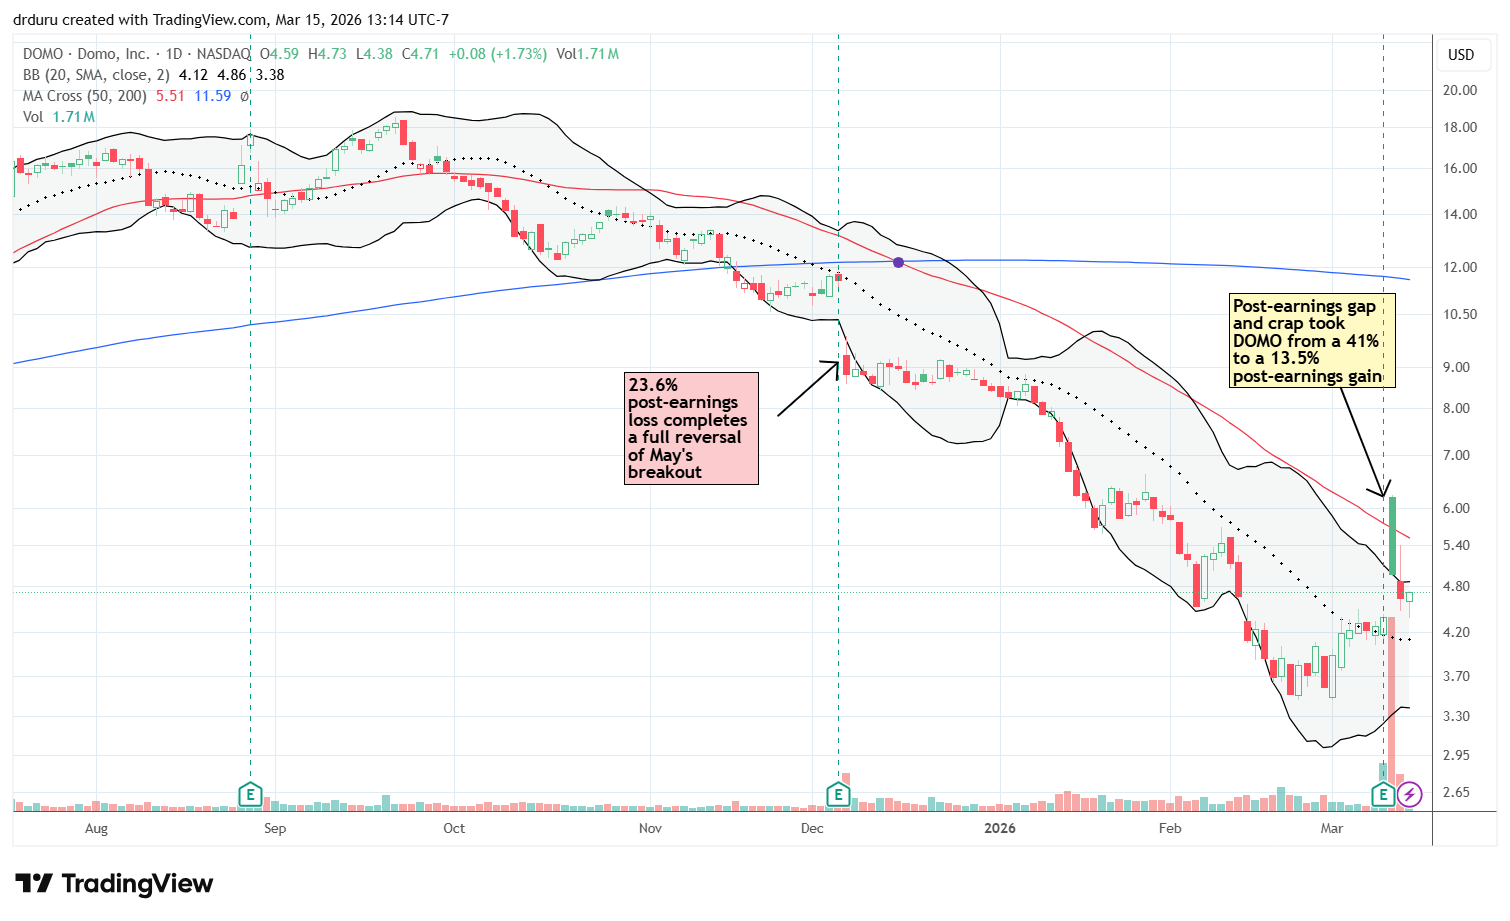
Technical status: Domo, Inc (DOMO) initially surged roughly 41% post-earnings, but two days of fading nearly erased the entire gain.
Trade commentary: DOMO went into the SaaSpocalypse as a stock trying to make a major recovery. That recovery officially ended with a large gap down in December earnings that confirmed 200DMA resistance. I tried to give the stock a chance given my belief the turnaround thesis remained intact. The technicals easily won the narrative. After the company announced it is considering strategic alternatives, this stock and my position became an exit story. The post-earnings surge demonstrated that I had not yet solidified my strategy: a 40%+ gain should have been enough to define an exit. I doubt a suitor will pay much more than $6 or $7 for DOMO.
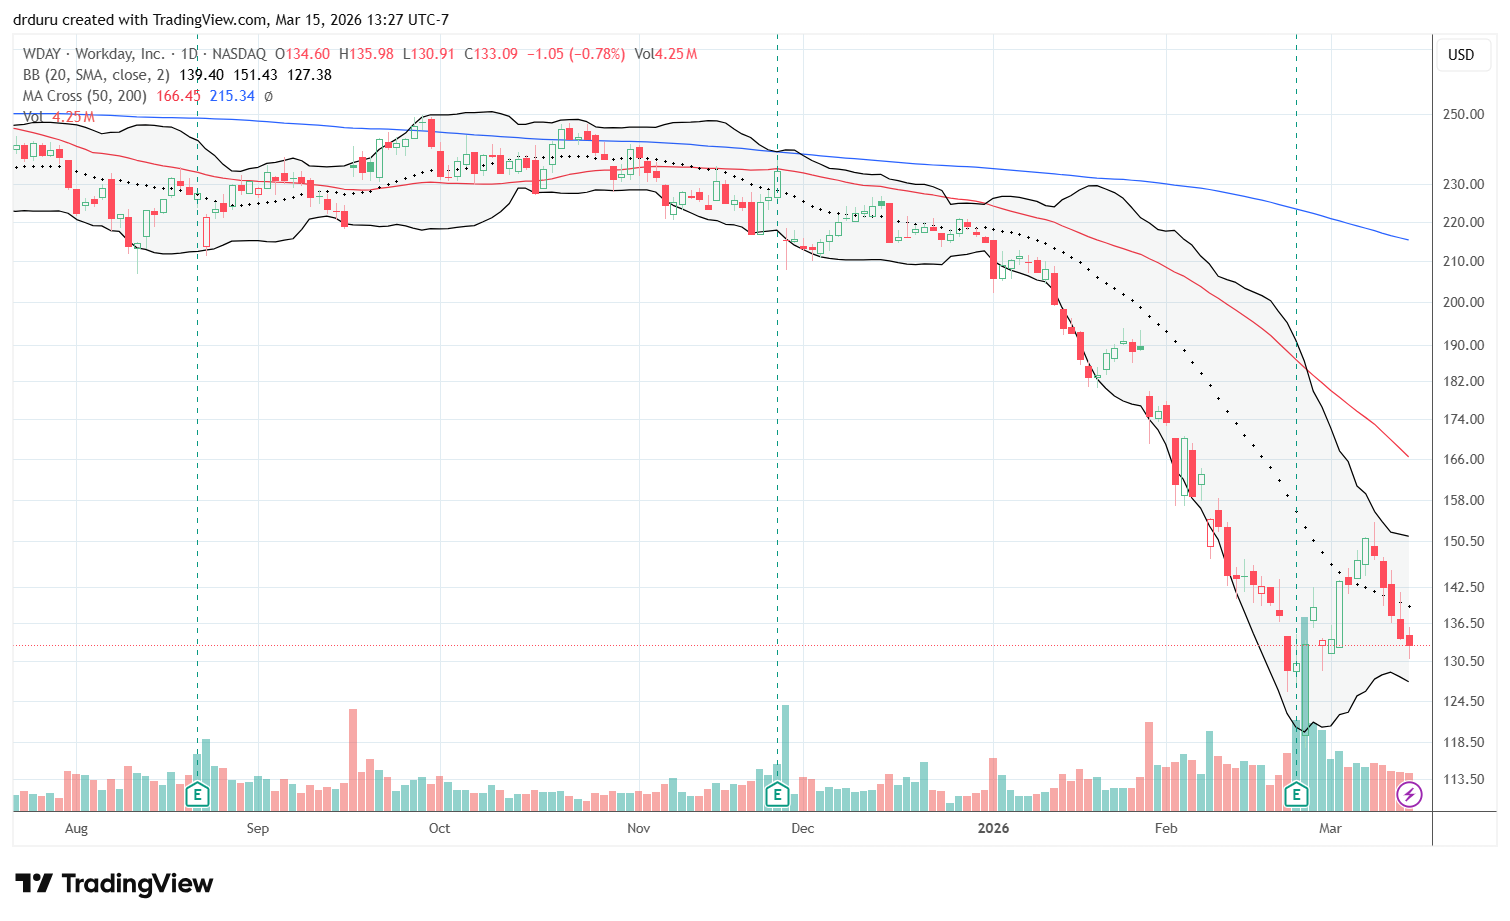
Workday (WDAY)
Description: Workday (WDAY) provides cloud-based enterprise applications for finance, human resources, and planning.
Technical status: Workday (WDAY) sold off throughout the week after a post-earnings rally. I am ready to buy back into the stock after locking in profits before the reversal.
Trade commentary: I took profits in WDAY during the previous rally because I expected a cooldown. That decision proved timely. WDAY is now approaching a level where I want to buy again. If WDAY breaks down below its pre-earnings low, I will assume a new bearish phase has begun. Otherwise, WDAY remains a member of my contrarian group of SaaSpocalypse victims.
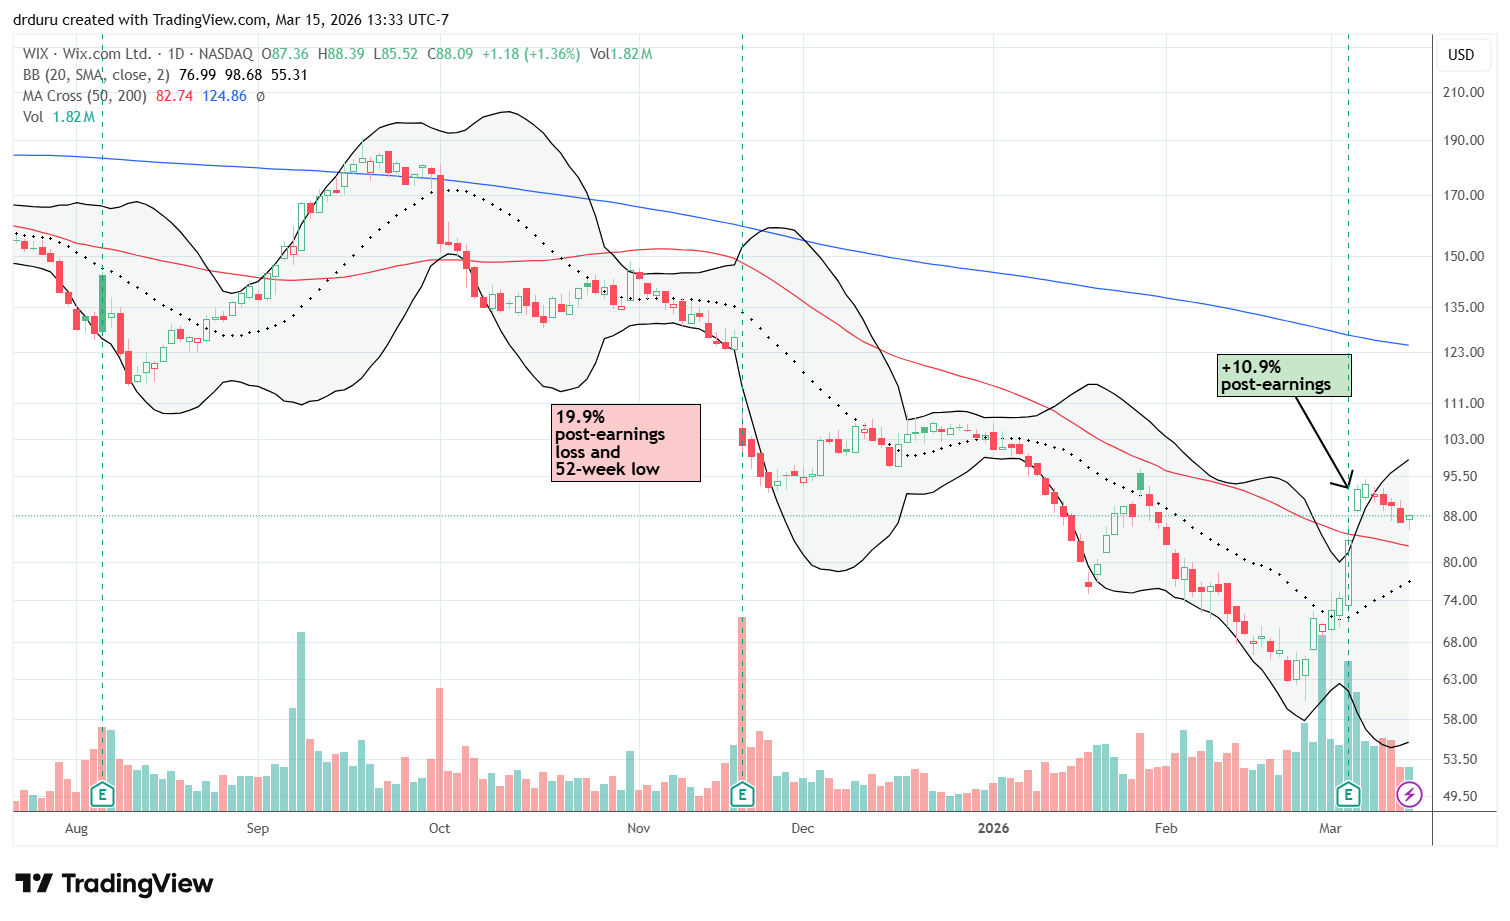
Wix.com (WIX)
Description: Wix.com (WIX) provides a cloud-based platform for building and managing websites and online business tools.
Technical status: Wix.com (WIX) jumped 10.9% post-earnings a day after surging 12.7%. So far, WIX is staying resilient above its 50DMA support.
Trade commentary: WIX surprised me given the stock is on my list of SaaSpocalypse victims that will not survive. Instead, the surge from recent lows, including the post-earnings gains, indicates that the stock has found a sustainable bottom. I am eyeing 50DMA support as a critical test to determine whether I speculate on a continued recovery. (Note my SaaSpocalypse analytical framework rated WIX a survivor based on the latest earnings report. I am so surprised, I am working on fine tuning the model! More to come later…).
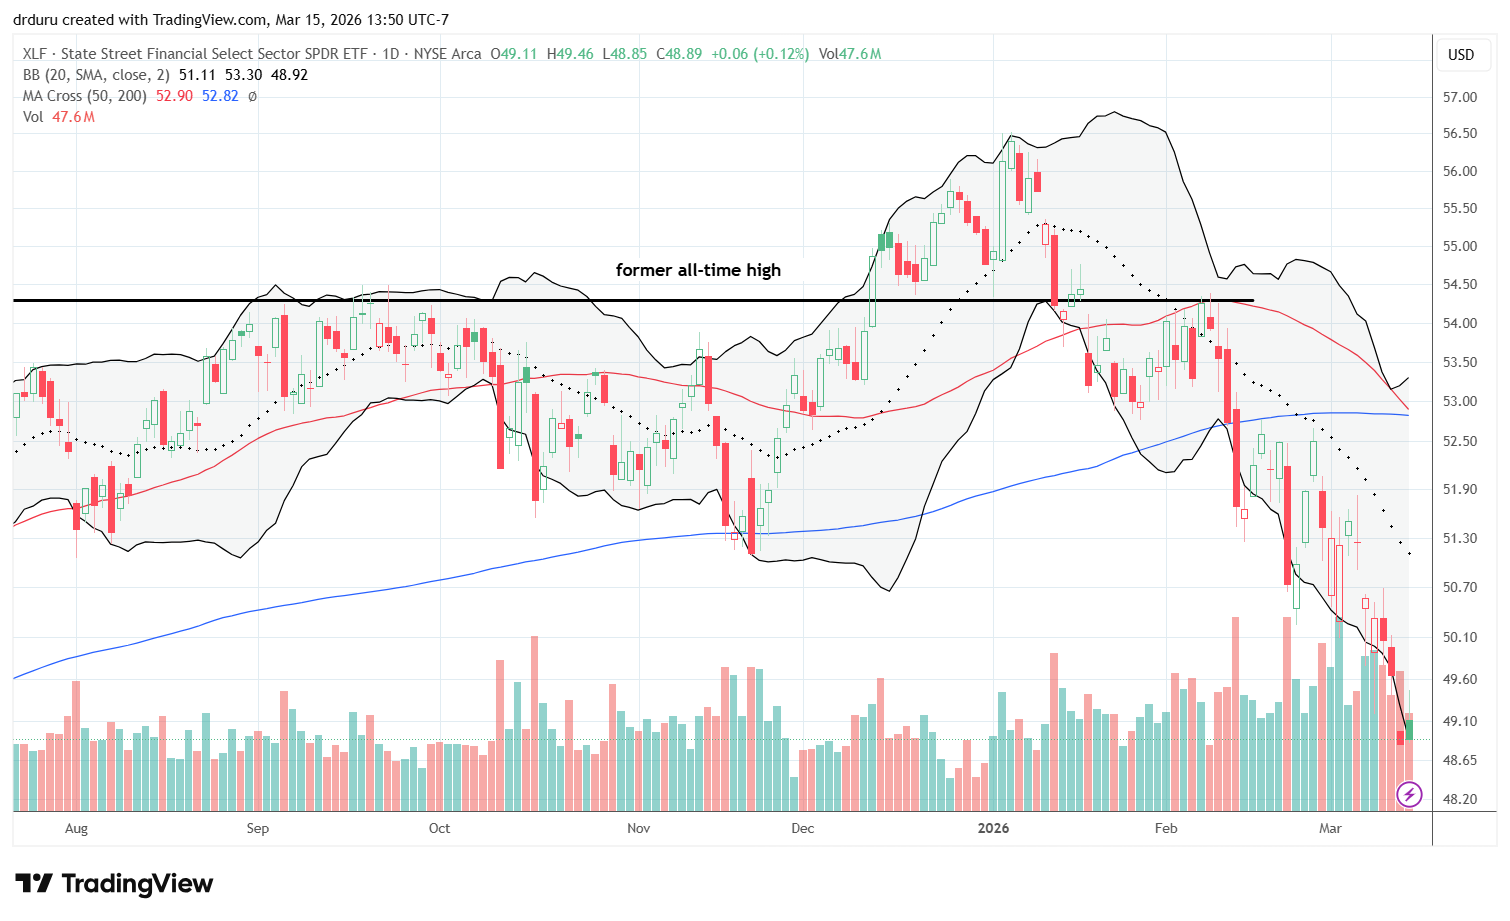
Financial Select Sector SPDR Fund (XLF)
Description: Financial Select Sector SPDR Fund (XLF) is an exchange-traded fund that tracks large U.S. financial companies including banks, insurers, and capital markets firms.
Technical status: The Financial Select Sector SPDR Fund (XLF) declined steadily after reaching an all-time high in December. The sell-off accelerated starting in February and pushed the ETF back to levels last seen in April.
Trade commentary: Financials concern me because the sector has been trending downward all year. It is difficult to be bullish on the stock market while financials are bearish. The current steep trajectory points toward dragging the overall market into oversold trading conditions.
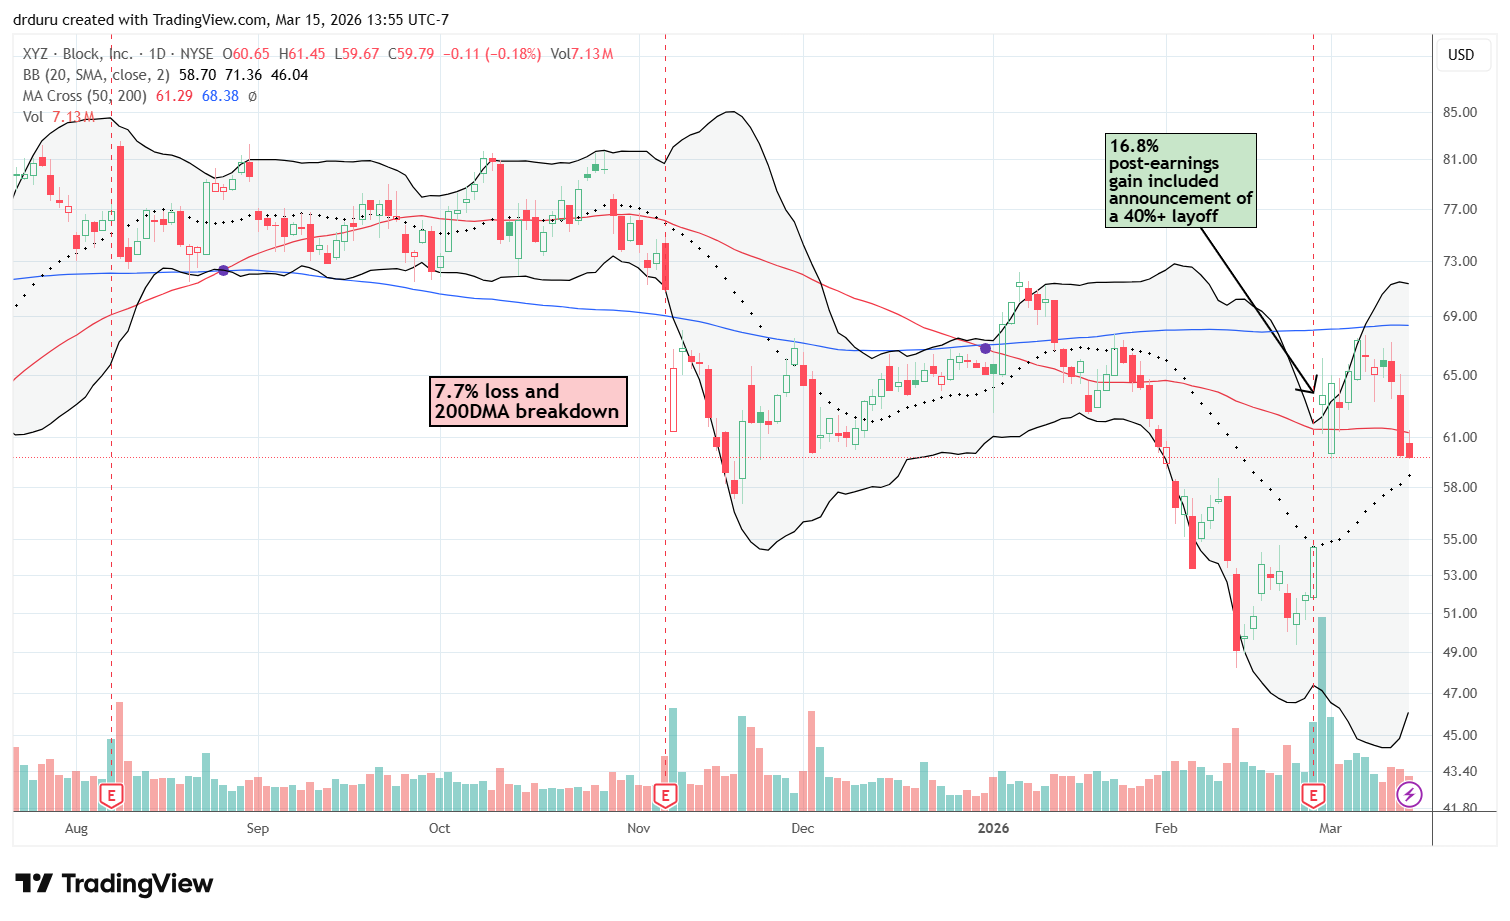
Block (XYZ)
Description: Block (XYZ) provides financial technology solutions including digital payment services, merchant tools, and peer-to-peer payment platforms.
Technical status: Block (XYZ) surged 16.8% after earnings only to fade from 200DMA resistance and drop into a 50DMA breakdown. A gap fill is now in play.
Trade commentary: The post-earnings excitement in XYZ is fading. Wall Street loved the news of the 40%+ layoff, but I am extremely skeptical. The CEO claimed AI enabled the layoffs, but the explanation sounds like “AI Washing”, that is, using claims of AI efficiencies and expertise to mask fundamental business problems. I bought a put option after the 50DMA breakdown in anticipation of an eventual complete reversal of the post-earnings gains. XYZ will likely stay on my list of potential shorts for some time to come.
Be careful out there!
Footnotes
Subscribe for free to get email notifications of future posts!
“Above the 50” (AT50) uses the percentage of stocks trading above their respective 50-day moving averages (DMAs) to measure breadth in the stock market. Breadth defines the distribution of participation in a rally or sell-off. As a result, AT50 identifies extremes in market sentiment that are likely to reverse. Above the 50 is my alternative name for “MMFI” which is a symbol TradingView.com and other chart vendors use for this breadth indicator. Learn more about AT50 on my Market Breadth Resource Page. AT200, or MMTH, measures the percentage of stocks trading above their respective 200DMAs.
Active AT50 (MMFI) periods: Day #170 over 20% (overperiod), Day #1 under 30% (underperiod ending 58 days over 30%), Day #6 under 40%, Day #9 under 50%, Day #17 under 60%, Day #143 under 70%
Source for charts unless otherwise noted: TradingView.com
Full disclosure: long IWM shares, calls, and calendar call spread; long XYZ put option, long SPUU, long VRT, long USO calendar put spread and puts, long TLT, long GLD call, long RAXX, short SGI, long THNQ, long DOMO
FOLLOW Dr. Duru’s commentary on financial markets via StockTwits, BlueSky, and even Instagram!
*Charting notes: Stock prices are not adjusted for dividends. Candlestick charts use hollow bodies: open candles indicate a close higher than the open, filled candles indicate an open higher than the close.
* Blog notes: this blog was partially written based on the heavily edited transcript of the following video that includes a live review of the stock charts featured in this post. I used ChatGPT to process the transcript.