
The Market Breadth Summary
- A tariff showdown erupted after a 6–3 Supreme Court decision invalidated tariffs under the IEEPA, triggering sharp but short-lived moves in tariff-sensitive stocks.
- The S&P 500 continued its pattern of quick rebounds from breakdowns below its 50-day moving average, while the NASDAQ and Russell 2000 hovered near technical inflection points.
- Market breadth indicators showed mixed signals, with AT50 holding steady but bearish and longer-term AT200 beginning to weaken.
- Volatility remained elevated but contained, suggesting investors are bracing for policy headlines without fully retreating from risk assets.
- Sector divergences widened, with retail and select AI infrastructure names holding firm while software and cybersecurity stocks faced renewed selling pressure.
- Bitcoin paused its decline near a key historical level, as narratives around AI-driven capital flows added a new dimension to crypto market dynamics.
Stock Market Commentary
The Supreme Court finally issued a judgement on the President’s tariffs enacted under the cover of the International Economic Emergency Powers Act (IEEPA). In a 6-3 decision, the court invalidated the tariffs thus making them illegal. The news came first thing Friday morning and injected a little bit of excitement in an otherwise boring week of trading. In a display of bot-like trading, tariff-sensitive stocks immediately surged on the news. Within 30 minutes sellers faded all the gains and even turned some of these stocks negative before buyers stepped in one more time. The end result looks like a tariff showdown mirrored by the President’s immediate retaliation in the form of 10% global tariffs (at the time of writing, these tariffs have already gone up to 15%). So here we are, right back to tariff trauma, drama, and noise. However, this time, the market seems much better prepared to absorb the chaos than last year.
The tariff news seemed to drown out the latest read on inflation. The PCE (Personal Consumption Expenditure), the Federal Reserve’s preferred measure of inflation, registered a hot 2.9% year-over-year change. Inflation not only looks sticky, but also it looks like it is bottoming. Such a bottoming has huge implications for a future featuring a new Federal Reserve Chair determined to lower rates and a President determined to tariff across the global economy. In other words, my conviction on gold only strengthened last week.
The President’s State of the Union address is coming on Tuesday. I am on the lookout for mysterious moves in individual stocks ahead of the address. I am also on alert for stocks to fade after the address. These addresses are full of a lot of hype and pomp, but they rarely deliver substantial changes in what we already know and understand.
Together, policy uncertainty and sticky inflation promise to keep volatility elevated, holding market breadth at a fragile equilibrium at best.
The Stock Market Indices
S&P 500 (SPY)
The S&P 500 barely moved before or after the Supreme Court’s tariff decision. All the day’s gains happened in a little over the first hour of trading. The subsequent intraday price consolidation resolved into the index closing a hair above its 50-day moving average (DMA) resistance. The S&P 500’s 0.7% gain on the day marks yet another success in a surprisingly consistent pattern in recent months. Buying the index on a 50DMA breakdown delivers profits within days, sometimes in just one day. I keep thinking this pattern could not possibly work yet again….and then it does. Next up for the index is resistance at its 20DMA (the dashed line).
")
NASDAQ (COMPQ)
The NASDAQ remains in bearish territory but now looks positioned to make a run for downtrending resistance from its 20DMA and then 50DMA. Given the previous week’s confirmation of resistance, I thought the next move would be a long overdue test of 200DMA support.
")
iShares Russell 2000 ETF (IWM)
It was a boring week for small caps. IWM pretty much closed flat on the week, with a lot of thrashing up and down. The only time I had an opportunity to buy my typical call option trade was an intraday dip on Tuesday that created a split second test of 50DMA support. IWM spent most of the week pivoting around its 20DMA. At least the ETF remains bullish.
")
The Short-Term Trading Call With Tariff Showdown
- AT50 (MMFI) = 56.4% of stocks are trading above their respective 50-day moving averages
- AT200 (MMTH) = 60.5% of stocks are trading above their respective 200-day moving averages
- Short-term Trading Call: neutral
AT50 (MMFI), the percentage of stocks trading above their respective 50DMAs, closed the week at 56.4%. The message from my favorite technical indicator did not change. AT50 gained slightly on Wednesday and churned the rest of the week.
AT200 (MMTH), the percentage of stocks trading above their respective 200DMAs, closed the week at 60.5%. Like AT50, AT200 thrashed the rest of the week after a small gain on Wednesday. While this long-term indicator of market breadth remains in bullish territory, it looks more and more “tired”. A new downtrend also seems to be unfolding. Thus, I am on alert for a freshly bearish turn in market breadth.
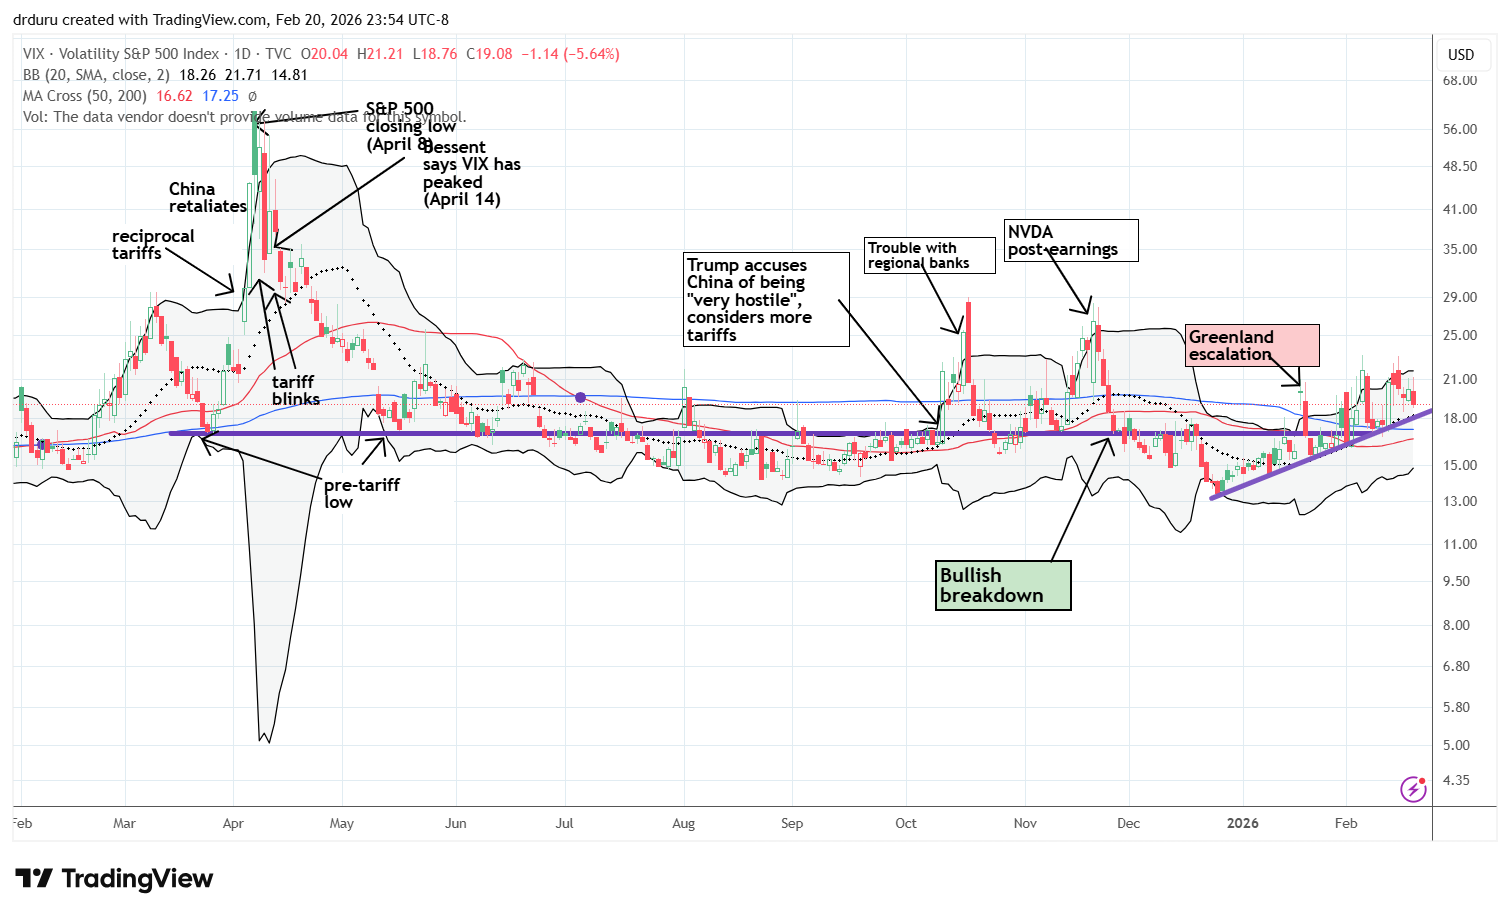
The volatility index (VIX) had a downward bias for the week but never challenged its uptrend line. Thus while the major indices are poised to respond favorably to the State of the Union, the VIX is positioned for the exact opposite. Under these conditions, staying neutral on the overall stock market makes a lot of sense to me.
In case you missed it…
I made the case for Atlassian ($TEAM) in the midst of the AI Panic about software companies and their stocks (aka the SaaSpocalypse), but I was forced to write a “eulogy” for Domo, Inc (DOMO).
State Street SPDR S&P Retail ETF (XRT)
Description: State Street SPDR S&P Retail ETF (XRT) seeks to track the total return performance of the S&P Retail Select Industry Index.
Technical status: State Street SPDR S&P Retail ETF (XRT) churned throughout the week alongside the 50DMA. XRT ended the week in tariff showdown between buyers and sellers.
Trade commentary: Friday was basically a tariff showdown day for XRT. XRT initially jumped as much as 2.3%. Buyers stopped cold at XRT’s upper Bollinger Band (BB) and sellers took XRT all the way back into negative territory before settling for a 0.7% gain. I speculated on a March $90 call option as the dust settled on the tariff showdown.
If you wondered why tariff-sensitive stocks did not react more strongly, just refer to months and months of debate and speculation about the Supreme Court’s decision. Moreover, prediction markets weighed on the side of a tariff rejection. The market was well-prepared to absorb the news.
")
NIKE, Inc. (NKE)
Description: NIKE, Inc. designs, develops, markets, and sells athletic footwear, apparel, equipment, accessories, and services.
Technical status: Nike Inc (NKE) held support at its 50DMA but faded from a 200DMA breakout as part of the tariff showdown that ended the week.
Trade commentary: NKE delivered a kind of exaggerated tariff showdown trading dynamic The stock surged at the open and pushed well above its 200DMA resistance, an important breakout for a stock in a prolonged downtrend. Next, sellers took NKE all the way back to a test of 20DMA and 50DMA supports where buyers stepped back in. On balance, NKE stalemated with a 0.3% gain. Still, the upturn in the 200DMA and the stabilization of a converged 20DMA and 50DMA suggest that buyers are itching to send NKE higher in coming weeks.
")
Dollar Tree, Inc. (DLTR)
Description: Dollar Tree, Inc. offers a wide selection of discounted consumable, variety, and seasonal merchandise.
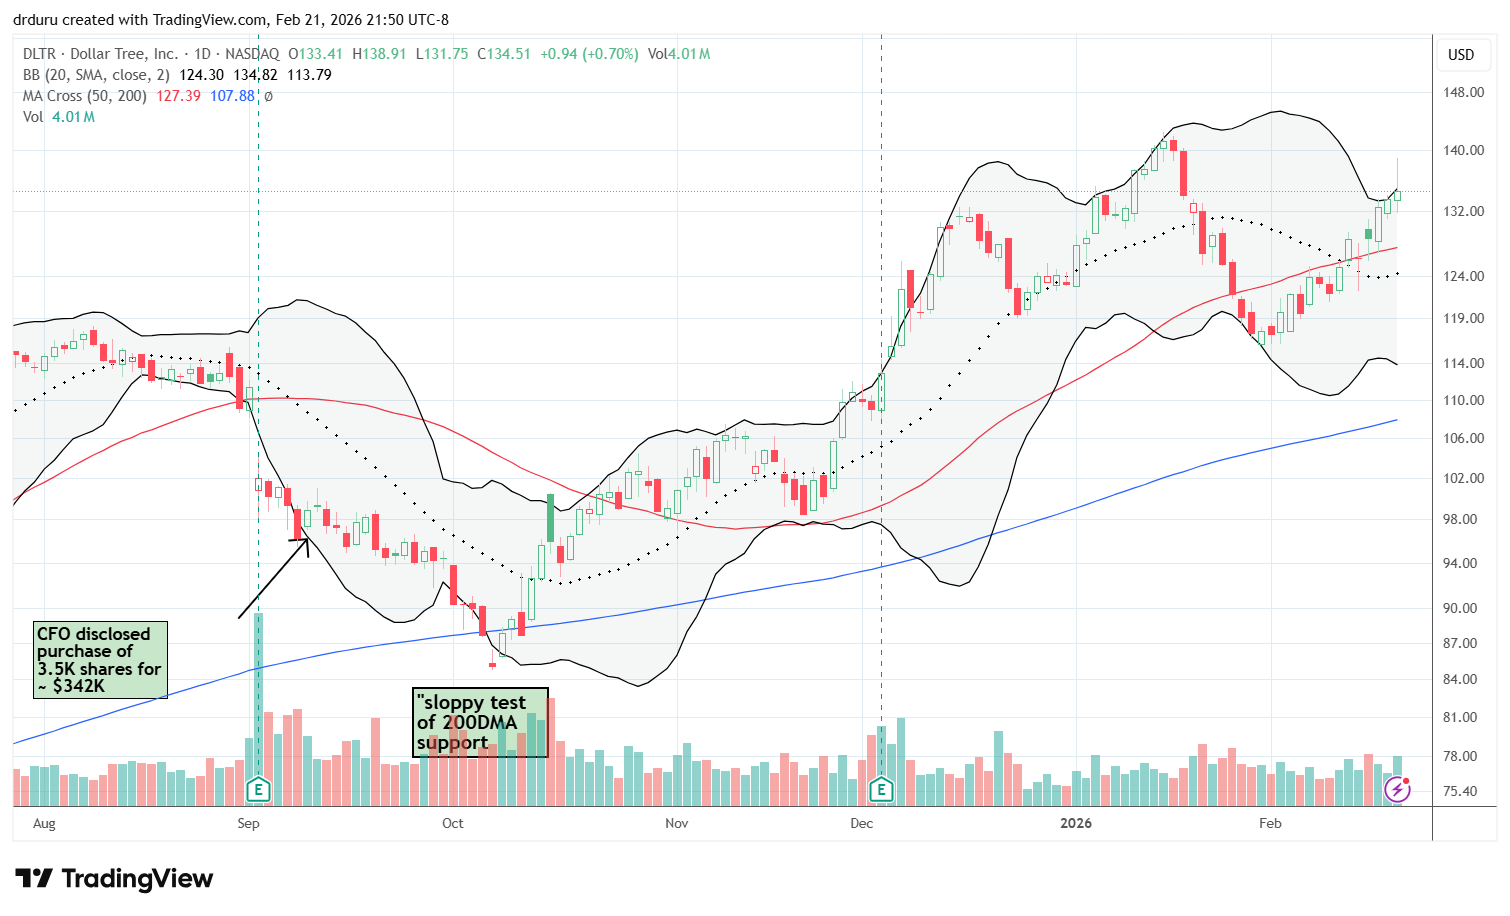
Technical status: Dollar Tree, Inc. (DLTR) extended above its upper Bollinger Band after the tariff decision. The fade near the recent peak puts DLTR on watch for a double top.
Trade commentary: I held my trade in DLTR despite a 50DMA breakdown. Fortunately, the stock did not trade much lower and quickly began a recovery. That recovery may have ended with the tariff showdown. Like XRT and NKE, DLTR reversed from the initial excitement. Given the position above the upper Bollinger Band and a fade near the previous high, I decided to take profits. I will look to buy back in on future dips.
Amazon.com, Inc. (AMZN)
Description: Amazon.com, Inc. runs retail businesses where selection, price, and convenience are key competitive factors, and it also provides cloud services and other offerings across its segments.
Technical status: Amazon.com Inc (AMZN) spent the week in a strong recovery from a post-earnings 9-month low. AMZN also filled a gap from its May 200DMA breakout.
Trade commentary: AMZN should benefit from lower tariffs. However, unlike the other tariff sensitive stocks, AMZN was able to hold its highs of the day. I bought shares for a long-term hold after the stock’s 6% post-earnings dip, but my calendar call trade failed. As a reminder, over the years I have found buying AMZN right after earnings, no matter whether up or down, results in profits within two weeks. In this latest round, AMZN closed exactly even after 2 weeks. My calendar call spread position was profitable the very next day but went downhill from there (I should have stopped out by the end of the first week of the trade).
AMZN remains in bearish position well below its 200DMA and still trading at an 8-month low.
")
Amplify Cybersecurity ETF (HACK)
Description: Amplify Cybersecurity ETF (HACK) provides exposure to companies in the cybersecurity industry through an exchange-traded fund structure.
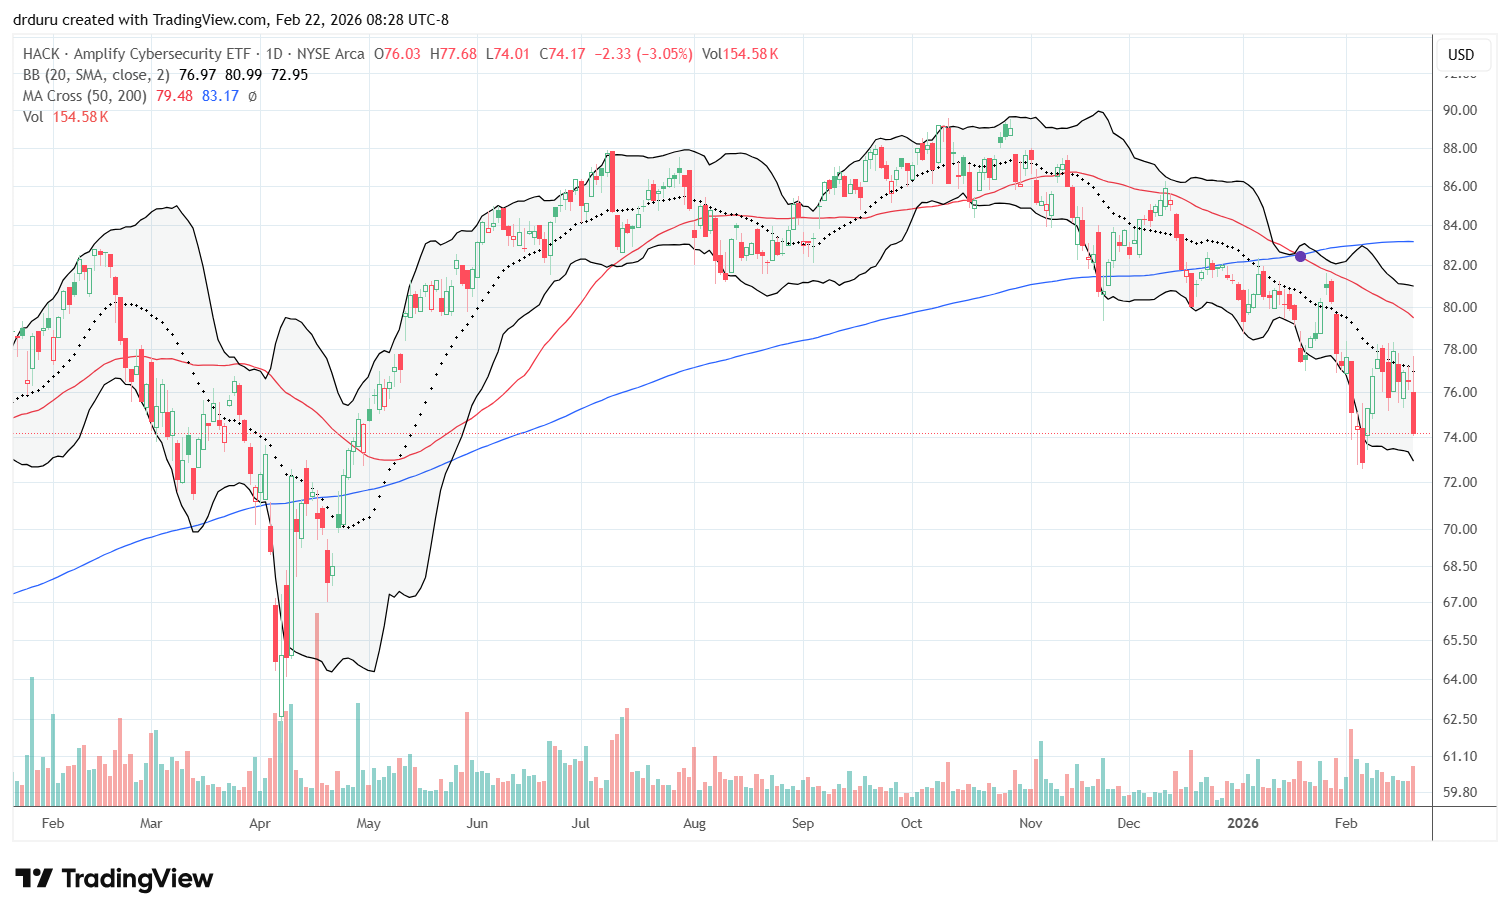
Technical status: Amplify Cybersecurity ETF (HACK) dropped 3.1% and stayed in an overall downtrend. HACK did not close below the earlier-month low.
Trade commentary: The AI Panic spread to cybersecurity stocks, a sector I assumed was immune from the indiscriminate selling. No serious enterprise would trust its cybersecurity to vibe coding, right? Well, another Anthropic release sent chills and thrills through tech. This time all it took was a research tool. From the press release: “Claude Code Security, a new capability built into Claude Code on the web, is now available in a limited research preview. It scans codebases for security vulnerabilities and suggests targeted software patches for human review, allowing teams to find and fix security issues that traditional methods often miss”.
Since HACK did not reach a new low for the year, I had to search among its components for the real damage…
Okta, Inc. (OKTA)
Description: Okta, Inc. provides identity management products and services that enable secure access, authentication, and authorization.
Technical status: Okta Inc (OKTA) fell 9.2% and hit a new 17 month low, after remaining rangebound since 2022.
Trade commentary: The cybersecurity AI Panic (cyberpocalypse?) showed up prominently in OKTA, a stock I have owned for a while. Until Friday, the stock was trading mostly in a range that allowed me to profitably sell call options against my position. Friday’s plunge took the stock out of range for that strategy. Now, I am considering when (or if) to add to my shares.
")
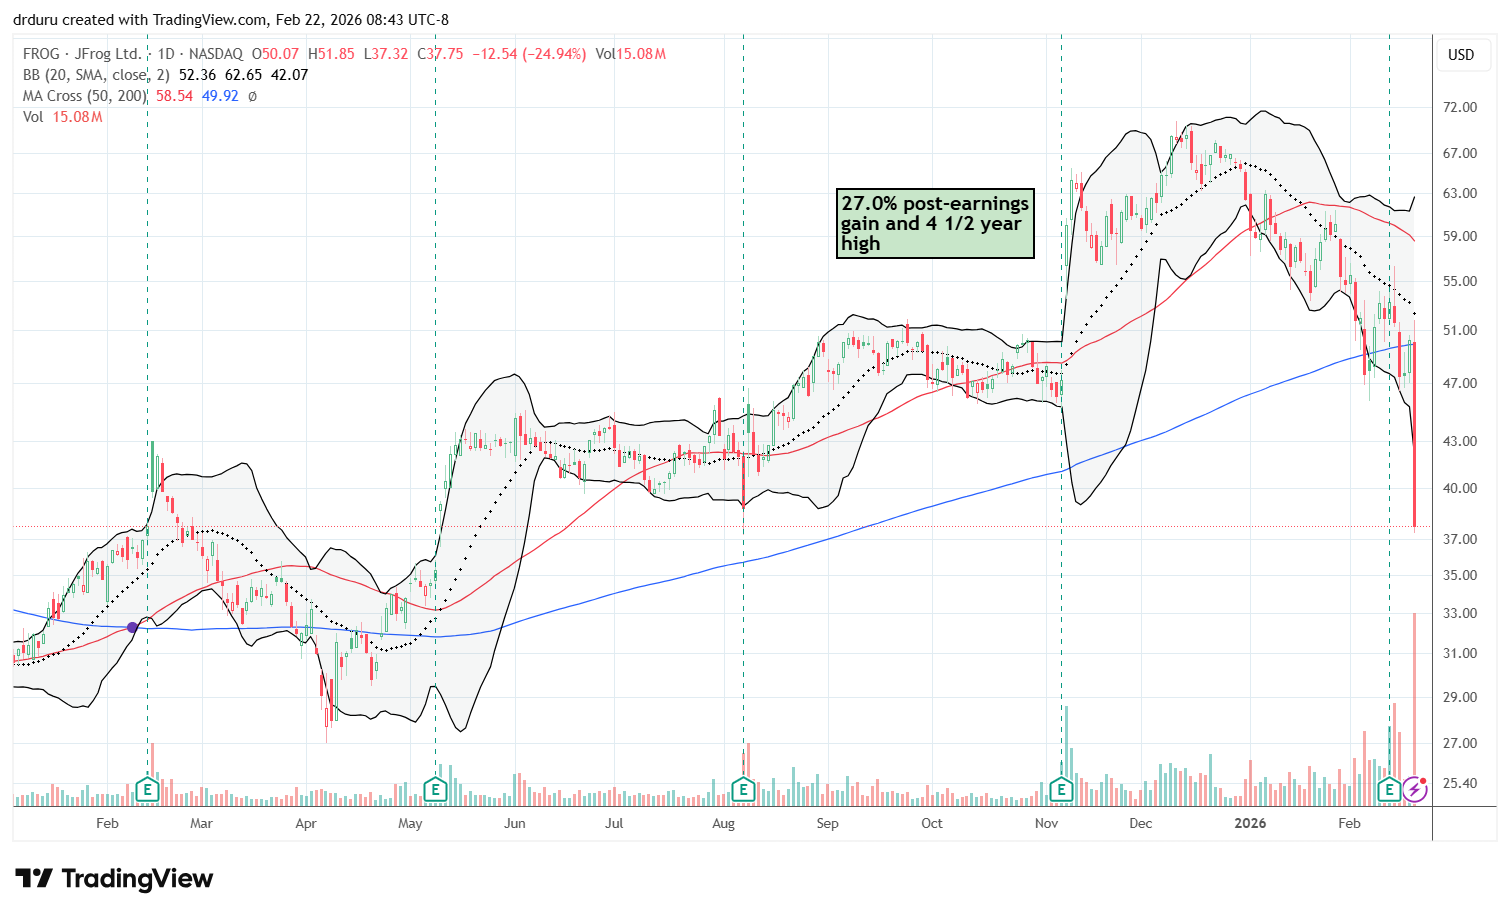
JFrog Ltd (FROG)
Description: JFrog Ltd. provides a universal, hybrid DevOps platform designed to manage, secure, and distribute software updates, often referred to as “Liquid Software”. The company specializes in automating the software supply chain from development to production, enabling fast, secure, and continuous software delivery for enterprises.
Technical status: JFrog Ltd (FROG) plunged 24.9% to a 9-month low.
Trade commentary: While OKTA’s plunge surprised me, FROG’s collapse shocked me. I asked ChatGPT to help my understanding. The response was detailed and long enough for its own article. Essentially, ChatGPT added to my suspicion that the selling is an overreaction to the potential for AI to eventually undermine all of FROG’s business. Thus, Friday’s selling is akin to the valuation compression going on in the SaaSpocalypse (FROG still trades at a rich 7.2x sales).
Note how FROG has been in a downtrend all year, just like most other software stocks. The final warning for traders came with the multiple breakdowns below 200DMA support. Still, FROG is on my shopping list for the coming week; I will likely start by selling a put option with a high risk premium. FROG is well over-stretched below its lower Bollinger Band.
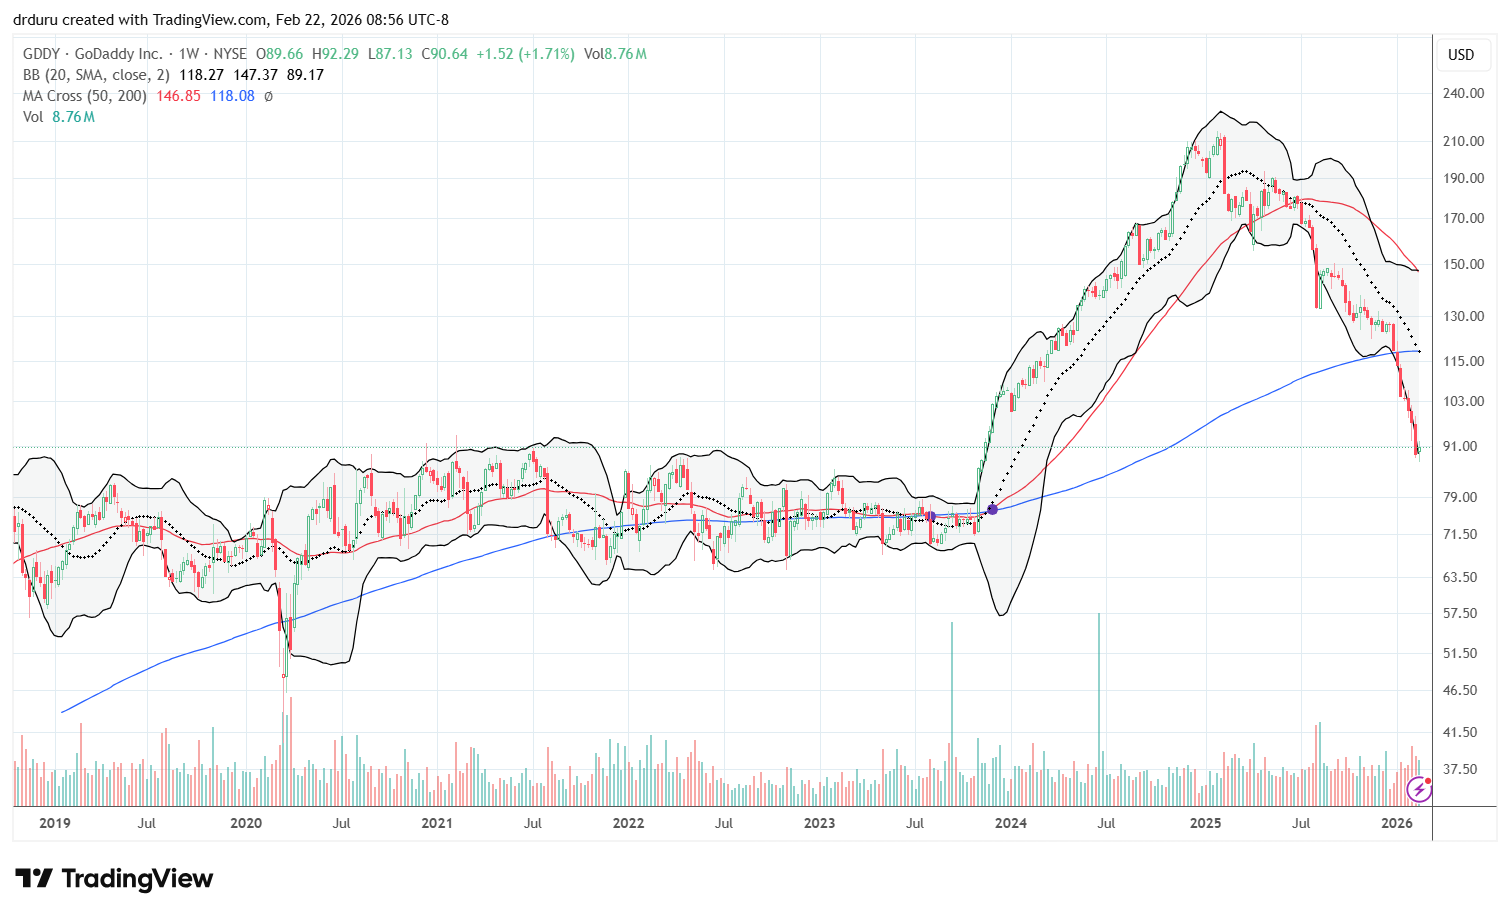
GoDaddy Inc. (GDDY)
Description: GoDaddy provides online tools for building websites, along with hosting, email, and marketing options.
Technical status: The weekly chart shows how GoDaddy Inc. (GDDY) printed a rare, long multi-year tight range followed by a sharp run-up and a sharp decline from the all-time high in 2025. Sellers have now fully erased the breakout.
Trade commentary: I suspect GDDY is getting hit by SaaSpocalypse given selling in the stock accelerated at the start of the year. Then again, I never understood why this old provider of domain names and websites suddenly caught fire in 2024 after years of going absolutely nowhere. So, the complete reversal of the breakout strikes me as a reversion to the “normal”. I will be watching earnings this week closely for more insight on what is going on.
Vertiv Holdings Co. (VRT)
Description: Vertiv provides critical digital infrastructure products and solutions, including power and thermal management technologies.
Technical status: Vertiv Holdings Co. (VRT) gained 24.5% the prior week on earnings and held momentum. VRT stayed in a bullish posture after the surge.
Trade commentary: While AI is creating destruction in software and other sectors, select AI-related stocks continue to thrive. I am fortunate that my favorite AI stock is still one of the big winners. I was tempted to sell VRT after its 24.5% post-earnings rally, but I decided to stick by the momentum. So far, so good as the stock consolidates. I will stop out and preserve profits if the stock closes below its post-earnings intraday low.
")
Credo Technology Group Holding Ltd (CRDO)
Description: Credo delivers high-speed, energy-efficient connectivity solutions used in AI, cloud computing, and hyperscale networks.
Technical status: Credo Technology Group Holding Ltd (CRDO) has formed a rounded top. A downtrending 50DMA and a pivot around 200DMA makes the technical outlook precarious.
Trade commentary: CRDO remains on my AI buy list after I took profits a little early. The stock was one of my best performers after I jumped into the stock on a classically bullish 200DMA breakout. However, CRDO is looking tired with a double top across November and December, a declining 20DMA and 50DMA, and a struggle to retain 200DMA support. This precarious technical positioning adds CRDO to the growing list of AI-related stocks that are suffering some buyer fatigue. Thus, I am very cautious about earnings coming on March 2.
")
Oklo Inc. (OKLO)
Description: Oklo is designing and deploying advanced fission power plants to provide clean, reliable, affordable energy.
Technical status: Oklo Inc. (OKLO) topped out in October and has trended downward ever since. The stock now trades in bearish territory well below its major moving averages.
Trade commentary: OKLO is one of the many AI-related trades (an innovative way to deliver the insatiable energy demands of the data center buildout) that has under-performed for months. A top in October unleashed a persistent downtrend all the way to bearish breakdowns below all the major moving averages. This breakdown is all the more precarious because OKLO does not yet earn revenue; the company is essentially a research and development play with mounting expenses.
I made the mistake of setting aside my skepticism for a trade off a 50DMA breakout supported by a rebound from 200DMA support. I made another try on a test of 200DMA support. With the stock struggling to hold recent lows, I took what I hope is my last loss as I do not intend to buy the stock in bearish territory. If not for the potential for random speculation to send the stock up 10% on any given day, I would short OKLO here.
")
Avis Budget Group, Inc. (CAR)
Description: Avis Budget Group provides global mobility solutions through brands including Avis, Budget, and Zipcar.
Technical status: Avis Budget Group Inc (CAR) harshly confirmed 50DMA resistance, crashing to a 9-month low after a 21.5% post-earnings drop.
Trade commentary: CAR is another cautionary tale about a downtrend. CAR dropped 15% last July and never recovered. A slow and grinding downtrend from there preceded last week’s 21.5% post-earnings plunge. If not for the exceptionally high short interest of 23.6%, I would have shorted CAR some time ago. I am a long-time skeptic of the valuation on this car rental business. With hindsight, I interpret 2025’s 4x run-up from lows to highs as a massive short squeeze. Last year’s high returned the stock to a former 2-year trading range.
")
Brinker International, Inc. (EAT)
Description: Brinker International, Inc. is a casual dining restaurant company and the home of Chili’s Grill & Bar and Maggiano’s Little Italy.
Technical status: Brinker International Inc (EAT) broke down below both its 50DMA and 200DMA with a double top from 2025 still in play.
Trade commentary: EAT is another stock whose run-up I failed to understand given the on-going economic pressures in fast food and casual dining sector. From the bear market low in 2022 to the all-time high in 2025, EAT increased almost 10x! Now, the momentum has stopped cold, including a double-top with last year’s all-time high. I have traded in and out of EAT with little success, but the latest breakdown below 50DMA and 200DMA supports has rekindled my interest in shorting the stock. My main hesitation is the relatively high short interest of 9.6%. Moreover, the stock is currently over-extended below its lower Bollinger Band.
")
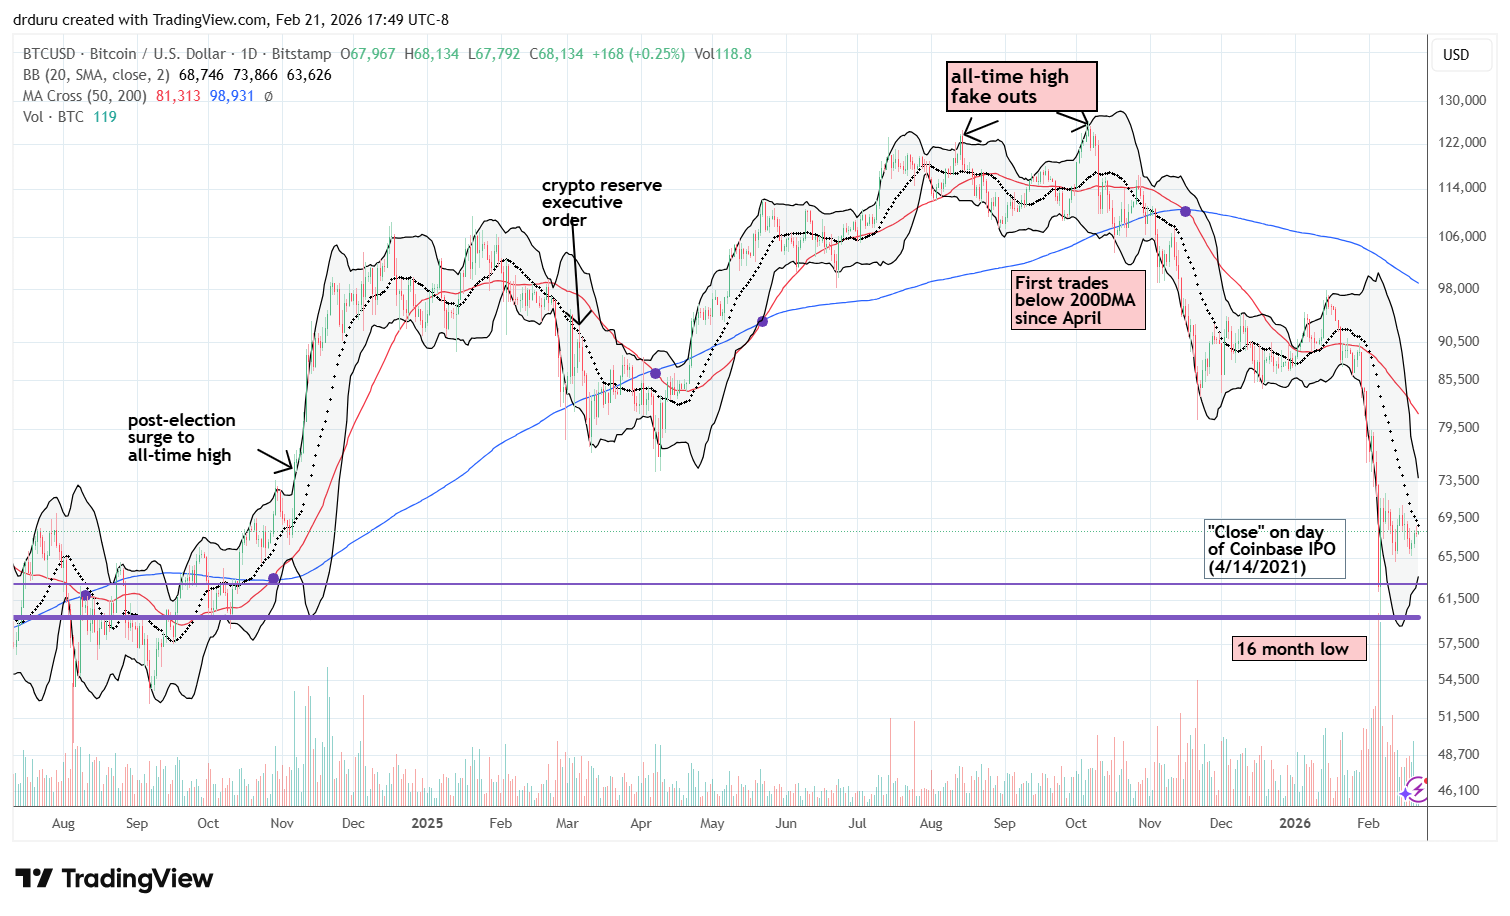
Bitcoin (BTC/USD)
Technical status: The Bitcoin (BTC/USD) sell-off has taken a two week hiatus after Bitcoin tested its price level from Coinbase’s 2021 IPO. Now Bitcoin must contend with its steeply downtrending 20DMA.
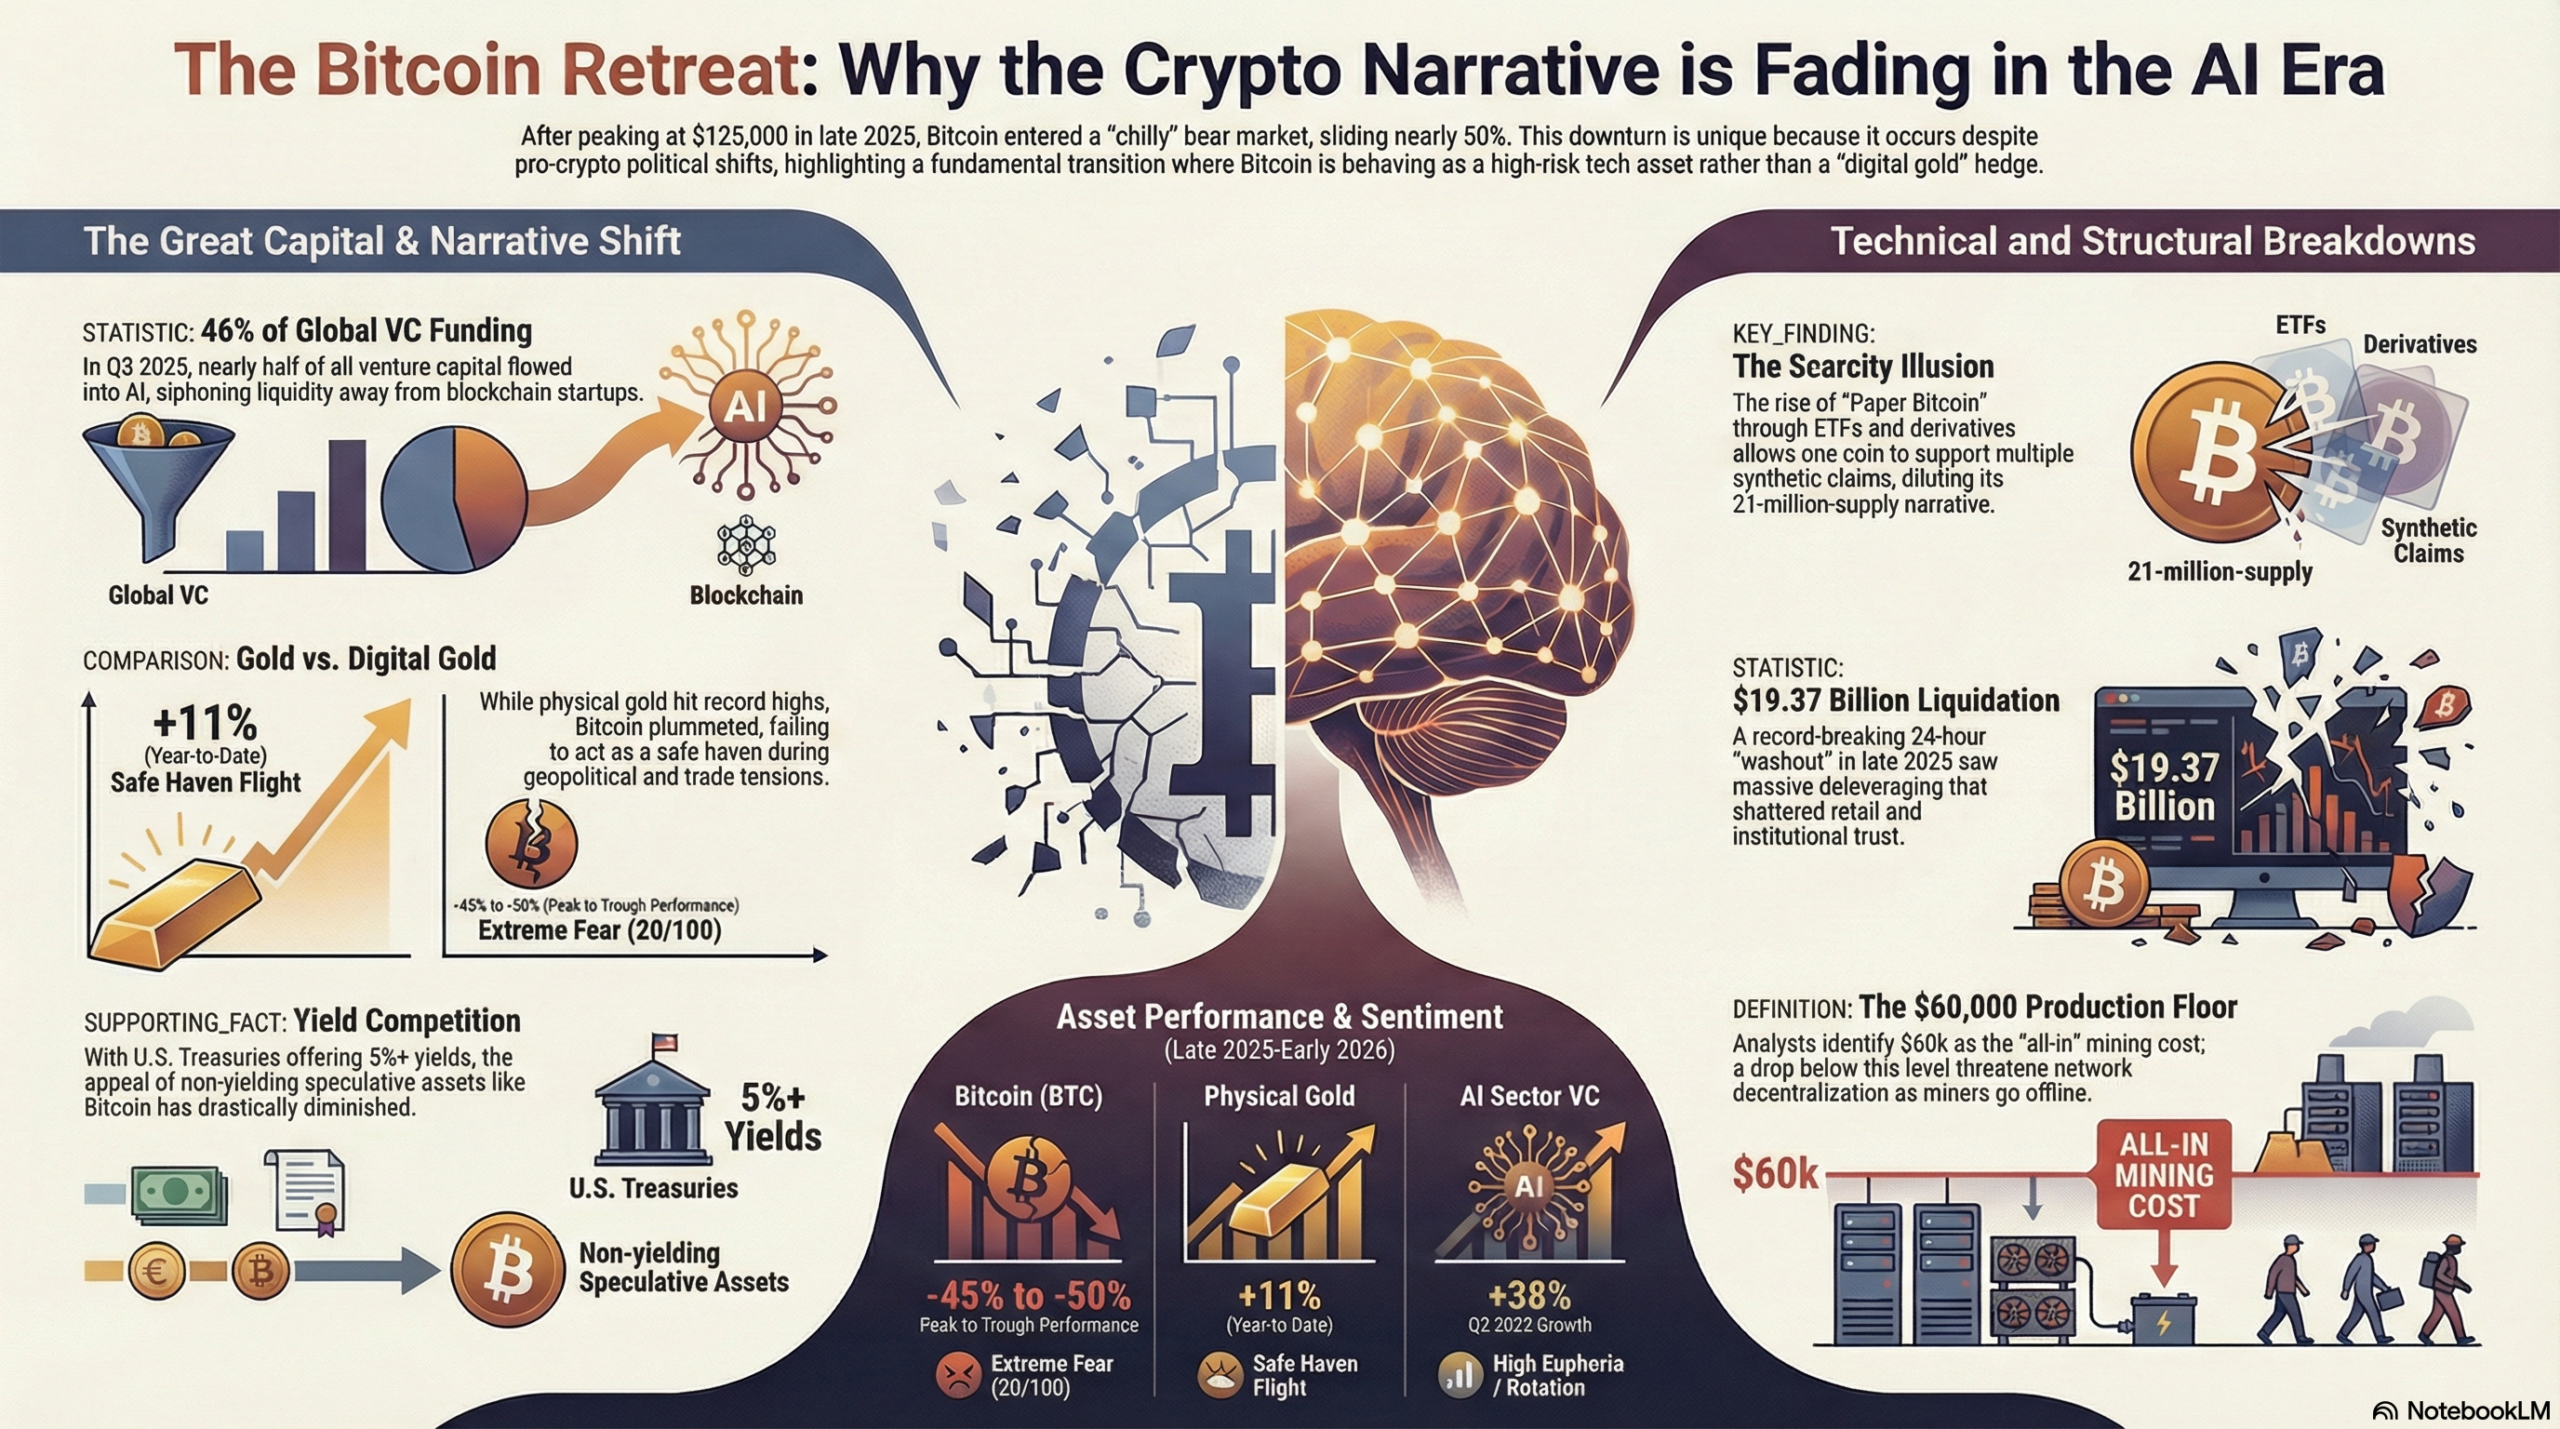
Trading Commentary: I have taken a pause from my small accumulation of Bitcoin as I await this next price test. The pause in selling at the Coinbase IPO level is likely not a coincidence. If Bitcoin can launch higher from here, I will assume a sustainable bottom is finally in place. A breach of the recent low would not just extend the crypto’s bear market, but also put my worst case scenario of $25,000 back into play. I recently read about the potential impact of AI investments draining interest and liquidity from Bitcoin. This narrative is one of the most convincing and compelling I have read. I have updated the infographic for my “explainer” with this theory.
")
")
Be careful out there!
Footnotes
Subscribe for free to get email notifications of future posts!
“Above the 50” (AT50) uses the percentage of stocks trading above their respective 50-day moving averages (DMAs) to measure breadth in the stock market. Breadth defines the distribution of participation in a rally or sell-off. As a result, AT50 identifies extremes in market sentiment that are likely to reverse. Above the 50 is my alternative name for “MMFI” which is a symbol TradingView.com and other chart vendors use for this breadth indicator. Learn more about AT50 on my Market Breadth Resource Page. AT200, or MMTH, measures the percentage of stocks trading above their respective 200DMAs.
Active AT50 (MMFI) periods: Day #160 over 20%, Day #49 over 30%, Day #47 over 40%, Day #42 over 50% (overperiod), Day #7 under 60% (underperiod), Day #133 under 70%
Source for charts unless otherwise noted: TradingView.com
Full disclosure: long IWM shares, long SPY put spread, long QQQ put spread, long XRT call, long AMZN, long OKTA, long VRT
FOLLOW Dr. Duru’s commentary on financial markets via StockTwits, BlueSky, and even Instagram!
*Charting notes: Stock prices are not adjusted for dividends. Candlestick charts use hollow bodies: open candles indicate a close higher than the open, filled candles indicate an open higher than the close.
* Blog notes: this blog was written based on the heavily edited transcript of the following video that includes a live review of the stock charts featured in this post. I used ChatGPT to process the transcript.
RIP to DOMO lol. A eulogy lol. Also I’ve researched between NOW and TEAM. On one hand NOW benefits from the AI automation as it pertains to automating workflow, Whereas wall street sees AI as a detriment to TEAM’s model JIRA seats necessity. ServiceNOW has a bit more stickiness with their roll out taking 9-18 months and costing millions, its a bit harder to leave NOW, whereas TEAM is more of a plug and play option. TEAM generates bing numbers and has the scalability of some of the biggest, but that 1.2 Billion dollar stock based compensation is a HUGE drawback. Albeit for the type of TEAM can generate, it’s at such a deep value all things considered. I used AI to project the intrinsic value in two bear case scenarios. 1. if growth pulls back to 10% from the previous 22%, then the intrinsic value put’s team at $105.40 per share. 2. if we consider a deep bear sentiment of lower earnings then the price would be projected between the $75-$80 that we’re currently seeing. IF the AI fears are actually realized there could be a $50-$60 floor. I like both NOW and TEAM, but I feel like NOW should be up but 30% by now.
I vote for your $105.40 price target on TEAM. 🙂
I have had my eye on NOW, but I have yet to pull the trigger since the indiscriminate selling continues in software.
Your analysis made me realize that a 1000 analysts are probably all running the same AI-driven scenarios and coming to similar conclusions. If I am right, it could help explain the herd behavior too.
Did you happen to ask what software companies emerge unscathed? The latest contagion hit cybersecurity stocks, a sector I assumed was safe from AI Panic. Nope! I find this contagion ironic given all these companies have been developing AI security features.