

Stock Market Commentary
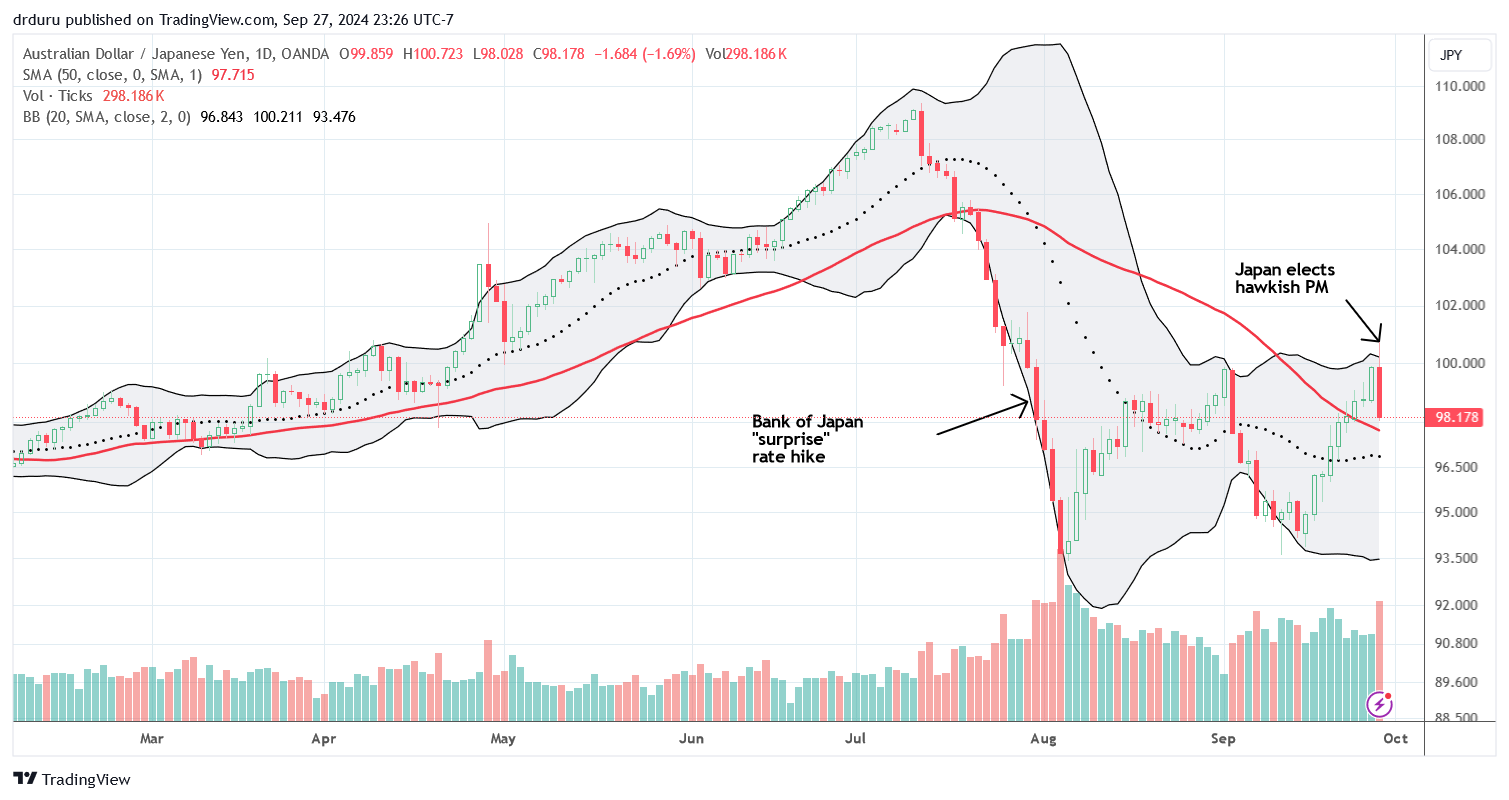
The U.S. stock market hardly reflected last week’s action-packed news. China scrambled to address a weakening economy with a massive stimulus program with news rolling nearly all week. In Japan, voters elected a Prime Minister who favors a stronger currency in the Japanese yen (FXY). Capping the anti-climactic feeling in U.S. stocks, PCE, the Fed’s preferred inflation indicator, came in lower than “expectations” further confirmed the Fed’s victory over inflation. While Chinese stocks soared all week, U.S. stocks watched the action from the sidelines as if in stand by mode. A resurgent Japanese yen failed to stir much concern on Friday.
David Tepper went on the bullish offensive in response to China’s massive stimulus program: “This is China. Buybacks, encouraging it, lending you money to do it and given money, you can put money out and have no losses…I want to be over there for some of this stuff.” Tepper is bullish by default on the U.S. market: “I don’t love the U.S. markets on a value standpoint but sure as heck won’t be short.” This discussion served as a clear reminder that international events are primed to kick the stock market out of stand by mode at any time.
Meanwhile, a resurgent Japanese yen threatens to quell China-driven excitement. My favorite currency indicator, the Australian dollar versus the Japanese yen (AUD/JPY), plunged on Friday by 1.7%. Rnewed strength in the yen could set the stage for an October pullback…just like July’s AUD/JPY plunge presaged the August calamity and AUD/JPY weakness accompanied the September pullback. One way or another, stand by mode should end in the coming days.
The Stock Market Indices
The S&P 500 (SPY) drifted higher for the week. The index closed at all-time highs 3 of 5 days in the week. Thus, the S&P 500 remains in bullish mode. However, the daily chart is levitating in a “limbo” zone with no direct support or resistance. It is a non-committal area which offers no clear entry for bulls or bears. This sleepy action is deceptive with the last of the market’s three most dangerous months coming in October. Stay alert even as stocks stand by!
")
The NASDAQ (COMPQ) also drifted for the week, but Friday’s lower close has tinges of buyer exhaustion. The tech-laden index pushed into the gap down from July but withdrew on Friday’s 0.4% loss. Thus the NASDAQ’s limbo looks ever so slightly precarious. Still, there is every reason for traders to stand by in anticipation of the next definitive signal.
")
The iShares Russell 2000 ETF (IWM) looks more exhausted than the NASDAQ. The ETF of small caps already fell short of important resistance in the previous week. From there, it has drifted downward while the other indices drifted upward. The good news is that IWM is still working with support at the converged, upward trending 20-day moving average (DMA) (dashed line below) and 50DMA (red line). I bought an IWM call option near support. I am still being hopeful that a resurgence is around the corner.
")
The Short-Term Trading Call While On Stand By
- AT50 (MMFI) = 64.4% of stocks are trading above their respective 50-day moving averages
- AT200 (MMTH) = 61.1% of stocks are trading above their respective 200-day moving averages
- Short-term Trading Call: neutral
AT50 (MMFI), the percentage of stocks trading above their respective 50DMAs, continued to follow IWM. Thus, there is a kind of bearish divergence on display. Moreover, my favorite technical indicator faded from the overbought threshold (at 70%) and faded from 68% on Friday, classic bearish signals from the AT50 trading rules that worked twice in August. However, I cannot make a corresponding change in the short-term trading call, much less aggressively go after shorts, because stocks are in this stand by mode. I see few good bearish setups. I have even taken to buying strangles (calls and puts of different strikes) in the hopes of waiting out some kind of big move either up or down while volatility remains low. The strangle position I mentioned on NVDA worked out on Thursday.
And of course Tepper’s caution against shorting will play over and over in my mind any time I think of initiating a bearish position.
There is no stand by in China. The stimulus from Chinese authorities sent Chinese stocks soaring. The iShares China Large-Cap ETF (FXI) gained 18.5% for the week, including a 9.8% gain on Tuesday. FXI is parabolic, so traders would do well to avoid chasing prices here: parabolic price action is not sustainable. However, on a weekly chart, FXI has pulled off a clear breakout from a bottoming pattern. Thus, I am on alert to go from stand by to taking the bait on a pullback.
I tried a strangle on Alibaba Group Holdings Ltd (BABA) with the stock up 7.9% on Tuesday. The next day BABA gapped down but only lost 1.8%. I took profits on Thursday’s resumption of the stimulus celebration; BABA closed that day with a 10.0% gain. Of course I thought odds favored profits on the puts not the calls!
")
During the August calamity, I feared that Vertiv Holdings, LLC (VRT), one of my most recent and now favorite additions to my generative AI trade, was in for a major pullback. I gritted my teeth and prepared to buy into some major discounts. VRT rode the market’s bounce from there and closed last week near the all-time high set over the summer. I would take profits here for a short-term trade, but VRT is too good to release. I am trying to keep this as a long-term position. New all-time highs could quickly translate into a resumption of the previous uptrend.
")
Dell Technologies Inc (DELL) is another generative AI trade on the rebound. However, DELL is still well off its all-time high. The stock is at least back in bullish position with a confirmed 50MA breakout. On the breakout I added to my shares with an October 120/130 call spread.
")
Two weeks ago, I wrote about the analyst-driven churn in semiconductor chip maker Micron Technology (MU). I managed to salvage some value from my call spread, but I went on stand by from there. MU pulled off a beautiful 50DMA breakout after reporting earnings. The 14.7% surge hurdled the August high. I am now looking to buy into the pullback, perhaps even around the upper Bollinger Band (BB).
")
Chasing MU a bit makes sense because semiconductors are back in bullish posistion. The VanEck Semiconductor ETF (SMH) confirmed a 50DMA breakout last week. Thursday’s rally in sympathy with MU took SMH above the August high. NVDA led SMH’s 1.9% pullback on Friday, but the ETF still looks good. I am a buyer on a test of converging 20DMA and 50DMA support.
")
I earlier demoted Alphabet Inc (GOOG) in the generative AI trade. GOOG’s rebound from the September low has taken it right to 50DMA resistance and the August highs. A close above the August high gets me back in, especially given the large upside potential from there.
")
Redfin Corporation (RDFN) was part of the giddy anticipation of a Fed rate cut. RDFN topped out right there with a 25.7% gain on the day. Buyers have gone on stand by since then. The stock has nearly reversed all those gains and came close to testing uptrending 20DMA support. Given the uptrend, RDFN is in buying position and at the top of my shopping list for the coming week.
")
The SPDR Select Sector Fund – Consumer Discretionary (XLY) is a clear winner in the post rate cut period. XLY broke out to an all-time high two Fridays ago. The ETF also gained 4 out of 5 days last week.
")
Four months ago, McDonalds Corporation (MCD) looked like it was deep in the throes of a major pullback. After a lower low in July, MCD began its recovery. I bought shares in July ahead of earnings and took profits about a week after MCD pulled off a post-earnings 50DMA breakout. Now MCD is back to an all-time high although it faded sharply on Friday. Those new $5 value meals must be working magic.
")
Food delivery service DoorDash, Inc (DASH) has reawakened. The stock has been in a bullish position ever since an 8.4% post-earnings 50DMA breakout. While I remain surprised DASH can continue delivering strong earnings results, I am a buyer on pullbacks to support. My last trade was a strangle as the stock drifted into the end of August. I took profits after DASH shifted from stand by to rally and breakout in September partially thanks to an analyst upgrade.
")
Giddy time now turns to Tesla, Inc (TSLA). The company will host a robotaxi event on October 10th called “We, Robot”, and the stock seems to be rallying in anticipation. I expect the rally to intensify next week. Accordingly, I bought a call spread. However, I could not help buying a weekly put option in case something goes spectacularly wrong with the trade. The worst case outcome is a steady drift all week in stand by mode waiting for the event.
")
")
")
Be careful out there!
Footnotes
Subscribe for free to get email notifications of future posts!
“Above the 50” (AT50) uses the percentage of stocks trading above their respective 50-day moving averages (DMAs) to measure breadth in the stock market. Breadth defines the distribution of participation in a rally or sell-off. As a result, AT50 identifies extremes in market sentiment that are likely to reverse. Above the 50 is my alternative name for “MMFI” which is a symbol TradingView.com and other chart vendors use for this breadth indicator. Learn more about AT50 on my Market Breadth Resource Page. AT200, or MMTH, measures the percentage of stocks trading above their respective 200DMAs.
Active AT50 (MMFI) periods: Day #213 over 20%, Day #112 over 30%, Day #36 over 40%, Day #11 over 50%, Day #2 over 60%, Day #51 under 70%
Source for charts unless otherwise noted: TradingView.com
Full disclosure: long SPY put spread, long IWM shares and call option, short AUD/JPY, long TSLA call spread and put option, long QQQ put spread, long VRT, long DELL shares and call spread, long XLY
FOLLOW Dr. Duru’s commentary on financial markets via StockTwits, Twitter, and even Instagram!
*Charting notes: Stock prices are not adjusted for dividends. Candlestick charts use hollow bodies: open candles indicate a close higher than the open, filled candles indicate an open higher than the close.