
Stock Market Statistics
- AT40 = 74.4% of stocks are trading above their respective 40-day moving averages (DMAs) (Day #1 overbought, 3 of last 4 days ooverbought)
- AT200 = 68.1%% of stocks are trading above their respective 200DMAs (near 3-year high and holding breakout above post financial crisis downtrend)
- VIX = 23.1
- Short-term Trading Call: neutral
Stock Market Commentary
“The U.S. added more than 184,000 confirmed COVID-19 cases on Friday, the fourth day in a row that the country has set a record for daily infections, according to data from the Johns Hopkins University Coronavirus Resource Center.”
U.S. Adds 184,000 Coronavirus Cases In 1 Day, With No End In Sight; NPR, November 14, 2020
The coronavirus pandemic is worse than ever in the United States with cases growing at a near exponential rate. For example, Chicago’s Mayor Lori Lightfoot urged city residents to effectively return to lockdown mode.
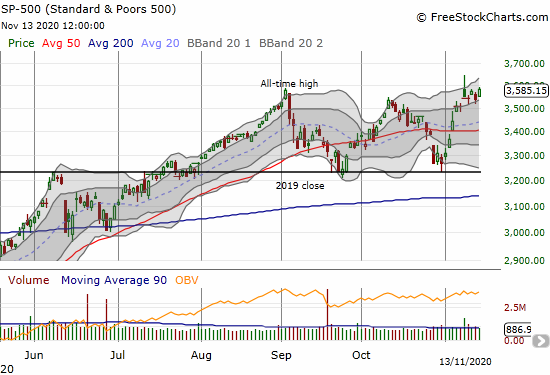
Some European hotspots are faring even worse. Despite the prospects for an even worse winter, the S&P 500 (SPY) managed to close the week at a new all-time high riding the increased popularity of the “reopen trade.” A reopen trade buys into the stocks of companies that will experience outsized growth as the economy recovers from the coronavirus pandemic and begins to normalize.
The stock market can look beyond the deepening crisis and see better days over the horizon for the reopen trade for two main reasons: 1) the Federal Reserve has already promised to provide a liquidity backstop for financial markets no matter, and 2) last Monday’s news about a COVID-19 vaccine with 90% effectiveness provides the most palpable hope yet that the end of the pandemic can come sooner than later. As a result of these catalysts, the “reopen trade” looks more attractive than ever.
The fresh rotation launched in force on Monday, took a break for three days, and resumed on Friday. The path from “here to there” for the reopen trade will surge and dip because the timing of a reopening still has a wide range of potential outcomes and big money institutions take time to reorient their portfolios.
The Stock Market Indices
The S&P 500 (SPY) increased 1.4%. Despite the new (marginal) all-time closing high, the index has not yet invalidated the topping pattern from Monday’s fade from an all-time intraday high.
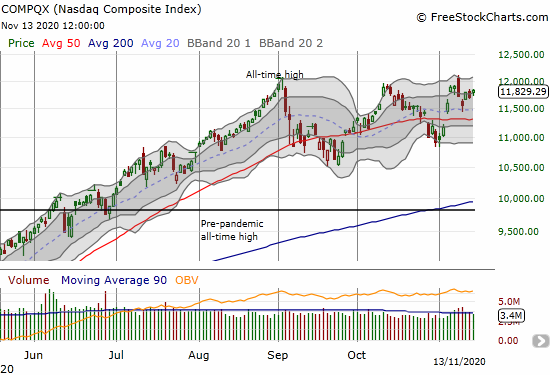
The NASDAQ (COMPQX) is lagging the S&P 500 given the lack of plays on the reopen trade. Still, the tech-laden index did manage to bounce off support at its 20-day moving average (DMA). Instead of a deepening sell-off, it looks like tech stocks will at least stubbornly hang on to the current 3-month trading range.
Stock Market Volatility
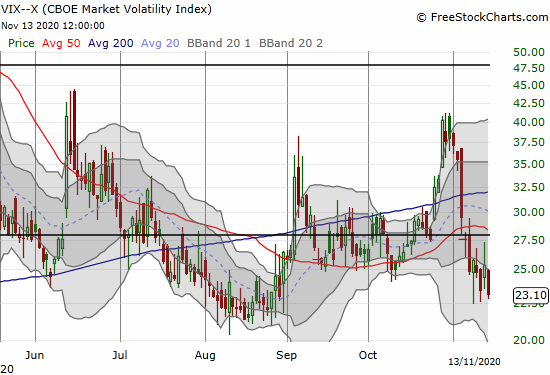
The volatility index (VIX) was itself very volatile throughout the week. From intraday high to intraday low, the VIX ranged from 23 to 27.4. The VIX closed the week near a 3-month low and finally looks ready to retest the August lows at 20. Recall that a VIX above 20 is considered elevated.
The Short-Term Trading Call: Overbought Conditions with the Reopen Trade

AT40 (T2108), the percentage of stocks trading above their respective 40DMAs, closed at 74.4%. AT40 once again crossed the overbought threshold of 70% after taking a one day break. The last overbought period began on Tuesday and lasted two days. AT200 (T2107), the percentage of stocks trading above their respective 200DMAs, pushed to a new 3-year high and further confirmed solid breadth in the stock market.
The reopen trade provided strong bookends to the week. Generally, reopen stocks soared to amazing extremes on Monday, cooled off for three days, and then resumed their collective momentum on Friday. Many of these stocks are now in “buy the dip” mode. Still, I am leaving the short-term trading call at neutral. Growing weakness in tech stocks could erode the stock market enough to create the next notable pullback. A neutral stance keeps me mentally ready to switch to a more bearish stance when the stock market confirms a breakdown from overbought trading conditions. Note that Thursday’s 1-day break from overbought conditions was not deep enough to trigger my alarms. Moreover, the break was immediately invalidated by Friday’s rebound into overbought territory.
Stock Chart Review Video
Stock Chart Reviews – Below the 50DMA
iShares Barclays Treasury Bond (TLT)
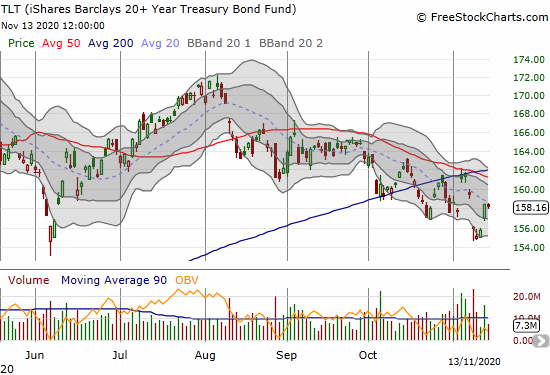
Until Thursday, interest rates and bond yields looked like they were making a beeline higher. The iShares Barclays Treasury Bond (TLT) popped 1.7% as that streak came to a temporary end. I am still holding residual TLT call options. However, I do not think they will amount to anything by November and December expirations. As a result, I do not see a reason to go long TLT again until/unless it closes above converged 50 and 200 ADMAs
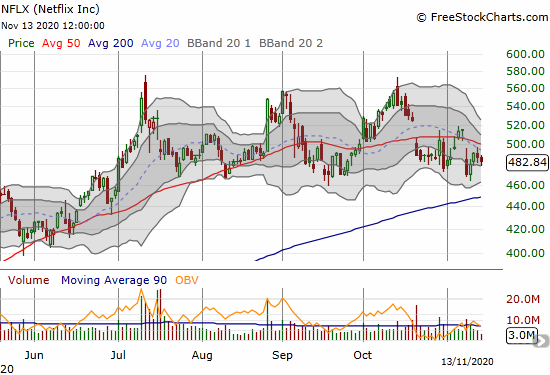
Netflix (NFLX)
Netflix (NFLX) gapped down and lost 8.7% to open the week as lockdown and work-from-home plays melted in favor of the reopen trade. NFLX rebounded the very next day and eliminated any thought I had to short shares. Instead, I reached for a strangle options play using a call and put option, both out-of-the-money, expiring Friday. I was expecting strong follow-through in one of the directions but instead NFLX just churned the rest of the week.
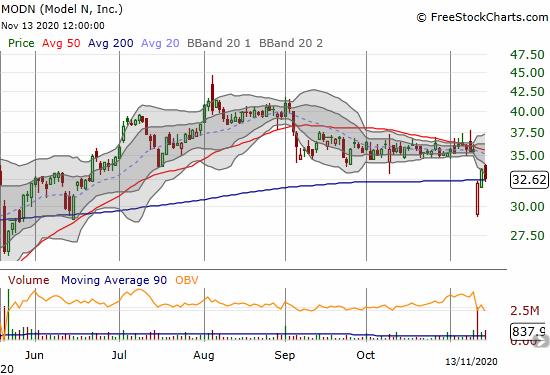
Model N, Inc. (MODN)
Earnings took software company Model N (MODN) below its 200DMA for the first time since May. Buyers immediately stepped into the breach. While MODN broke out above its 200DMA the next day, the stock wilted right back to its 200DMA to close the week. I have been looking for a buying opportunity in MODN for a long time. The setup here is still poor for now, making MODN a buy only on a close above the previous 2-month consolidation period.
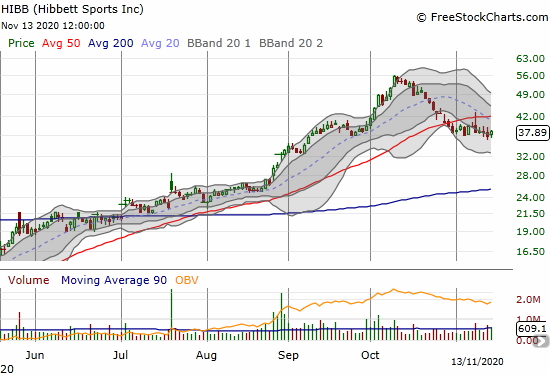
Hibbett Sports Inc (HIBB)
The sporting goods trade took a big hit in October. Since then, Hibbett Sports Inc (HIBB) has managed to hold steady under 50DMA resistance. The stock is in limbo land and is not interesting to me until a test of 200DMA support and/or a 50DMA breakout.
Stock Chart Reviews – Above the 50DMA
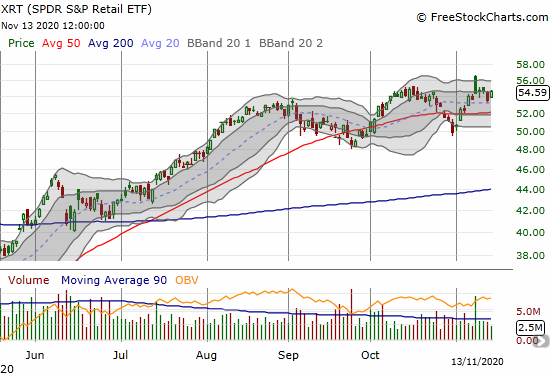
SPDR S&P Retail ETF (XRT)
The SPDR S&P Retail ETF (XRT) gapped higher on the reopen trade but sellers immediately crushed XRT back to near flat on the day. XRT churned its way the rest of the week. I do not see a trade here until XRT breaks below the October lows (short) or a fresh breakout to all-time highs (invalidate the nastiness of the gap and crap).
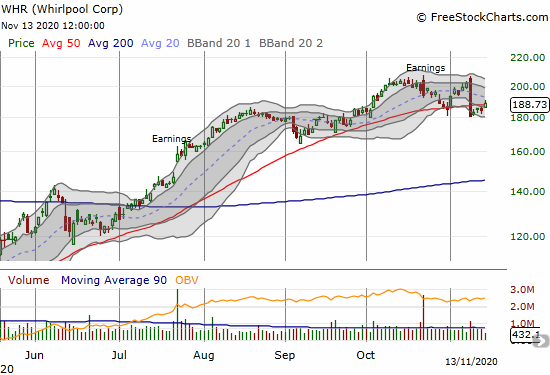
Whirlpool Corp (WHR)
Whirlpool Corp (WHR) could have and should have participated in the reopen trade. Indeed WHR started Monday gapping higher to a new all-time high. Yet, sellers stepped in after the open and sent WHR to a nasty 10.4% loss. The trading action created the dreaded bearish engulfing pattern. Now, WHR trades on the edge of being a short. If the stock breaches the Monday intraday low at $180.52, I will short shares. This topping action looks so convincing that I am not interested in buying WHR even if it manages to close above the intraday high of the week (in the short-term).
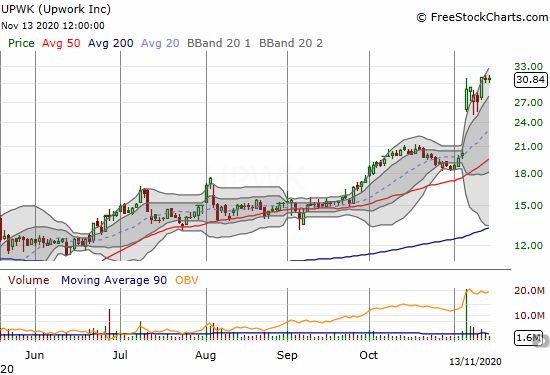
Upwork Inc (UPWK)
When I took profits in Upwork (UPWK), the trade looked timely. I did not even entertain the idea of getting back in ahead of earnings. UPWK surged a game-changing 43.6% post-earnings and the momentum continues. I can only hope a good re-entry point appears in the coming days or weeks.
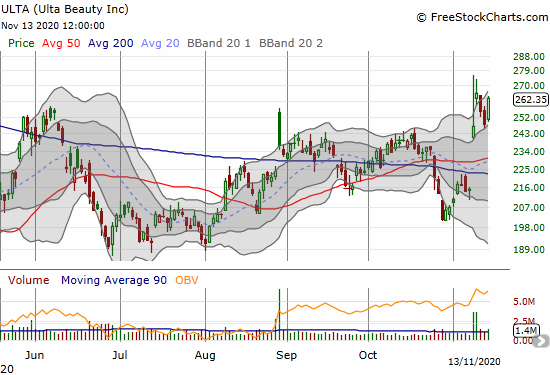
Ulta Beauty Inc (ULTA)
Ulta Beauty (ULTA) surged on Monday’s reopen trade but a strong fade pushed the stock to a 14.5% gain on the day and a close below the June highs. A deal with Target revived interest in ULTA for a 7.4% pop the next day. The next two days, the stock joined the cooling period that so many reopen trades experienced. Momentum resumed on Friday with the rest of the reopen trades.
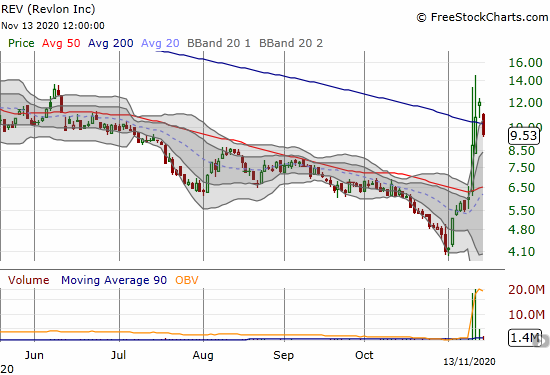
Revlon Inc (REV)
Cosmetics company Revlon (REV) had a wild week. The stock “only” gained 7.8% on the reopen trade on Monday. Buyers fell over themselves the next three days to get into the stock (or cover shorts) ahead of earnings. News on Wednesday that the company secured a deal with creditors to stave off bankruptcy concerns certainly helped the trade.
REV traded as high as $14.50 before settling in at $12.02 ahead of earnings, a 117% gain in just 4 days. Earnings news failed to keep the stock propped up. REV fell 20.7% on a 200DMA breakdown. After the dust settles on this stock, I will consider a buy as a speculative “escaped bankruptcy” trade. Ideally, the dust settles with the stock above its 200DMA.
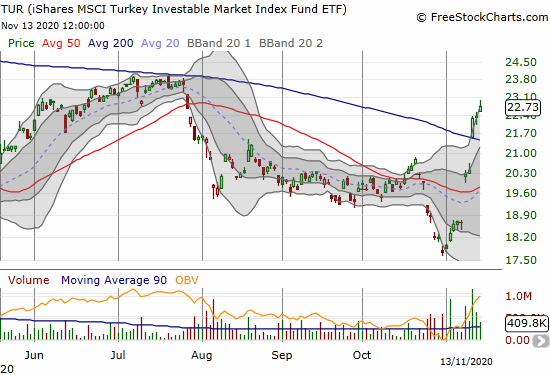
iShares MSCI Turkey Investable Market Index Fund (TUR)
The iShares MSCI Turkey Investable Market Index Fund (TUR) surged 9.3% on a 200DMA breakout in the wake of a hopeful announcement from Turkish President Tayyip Erdogan. Erdogan promised to turn over a new leaf in Turkish politics and the country’s economy. Financial markets clearly warmed up to the news. TUR ended the week strong and looks like a buy with a tight stop below the 200DMA.
Global X Nigeria Index ETF (NGE)
I wrote about a 200DMA breakout in the Global X Nigeria Index (NGE) in January. Within a month, NGE fell into a fresh 50 and 200DMA breakdown. The pandemic sealed the deal on fresh selling pressure. NGE bottomed about a week after the S&P 500 bottomed in late March. Buyers finally got serious after NGE printed a new 200DMA breakout last month. This month, NGE almost went parabolic before a 3.9% loss on Friday ended the momentum. The rally brought my position back to even as I bought more NGE over the summer. The rally is impressive given recent political unrest in the country with protests against police brutality. I hope this rally is a true sign of better days to come soon.

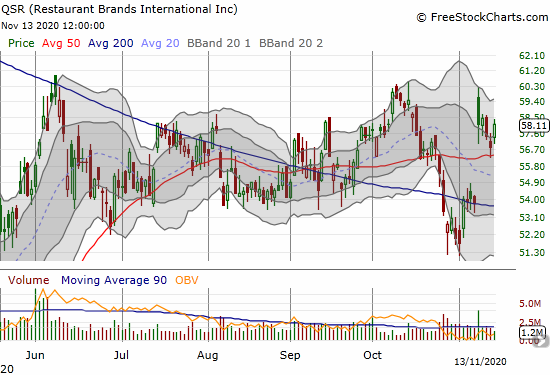
Restaurant Brands International Inc (QSR)
Restaurant Brands International Inc (QSR) benefited from the reopen trade. Still, a 7.9% gain failed to break QSR out of its trading range. If I did not already own enough shares of QSR, I would buy some here as a reopen trade that has not yet gotten ahead of itself.
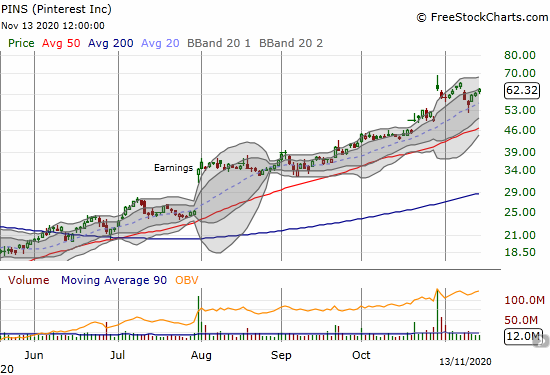
Pinterest Inc (PINS)
Last month, Pinterest Inc (PINS) surged 26.9% post-earnings. PINS took another 5 trading days to hit a new all-time high. PINS lost 10.8% as traders rotated out of stocks like PINS into the reopen trade. The momentum resumed after PINS recovered from a 20DMA breakdown the next day. That dip was a great spot to pick an entry. I am now back to watching for the next opportunity.
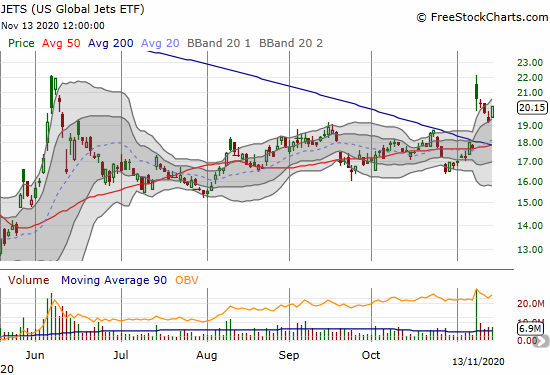
US Global Jets ETF (JETS)
I flew into US Global Jets ETF (JETS) after the open on Friday as a pick for the reopen trade. Like the rest of this bunch, JETS soared on Monday and cooled off the next three days. These kinds of rotations take time to play out as the big money institutions cannot and do not want to switch up their portfolios all at once. In other words, this cooling period provides a window of opportunity especially in stocks or ETFs like JETS which are now comfortably trading above key support at the 50 and 200DMAs.
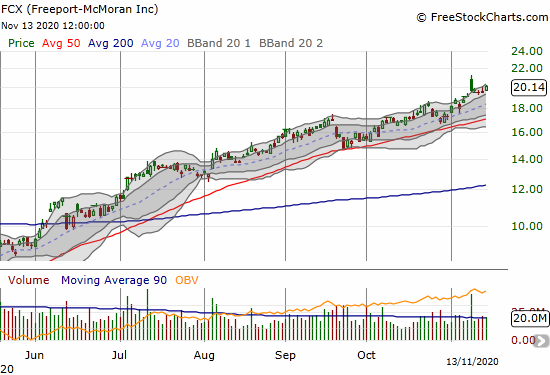
Freeport-McMoran Inc (FCX)
Copper miner Freeport-McMoran (FCX) is on an epic run-up. FCX bottomed out just above $5 in March. The stock just barely cleared its January, 2018 highs to close the week at a 5 1/2 year high. FCX is a buy on the dips like so many other commodities plays that should benefit from the double catalyst of economic recovery and historically loose monetary policy around the globe.
Eventbrite Inc (EB)
Event ticketing company Eventbrite (EB) hit the skids soon after its September, 2018 IPO. EB has collapsed in three main stages. The third collapse happened along with the pandemic-driven sell-off. EB hit a high above $22 just ahead of the pandemic, so a lot of upside potential should remain here on a reopen trade. I did not get my price on Friday, but I am primed to start loading up on EB this coming week.

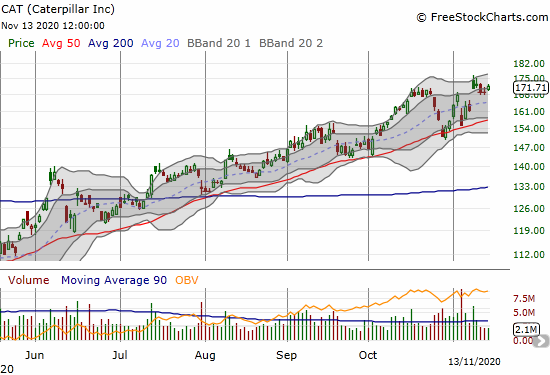
Caterpillar (CAT)
Caterpillar (CAT) gained 5.9% on Monday’s reopen trade and failed to net further gains from there. CAT still looks like a buy at these levels. I took profits on a calendar call spread, and I will look for more call option trades in the coming week.
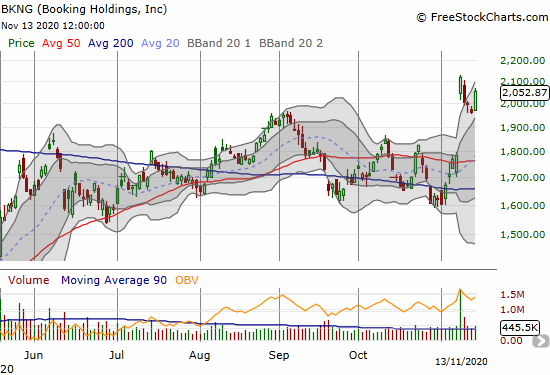
Booking Holdings, Inc (BKNG)
Reservations company Booking Holdings, Inc (BKNG) soared 18.8% on Monday’s reopen trade. Once BKNG gapped a little higher on Friday, I assumed the cooling period came to an end. Unfortunately, I did not get my price on Friday (spreads on BKNG are very wide). I am looking to buy into a fresh cooling period. BKNG first recovered its pandemic-related losses in September. Now, BKNG trades at a 10-month high.
— – —
FOLLOW Dr. Duru’s commentary on financial markets via email, StockTwits, Twitter, and even Instagram!
“Above the 40” uses the percentage of stocks trading above their respective 40-day moving averages (DMAs) to assess the technical health of the stock market and to identify extremes in market sentiment that are likely to reverse. Abbreviated as AT40, Above the 40 is an alternative label for “T2108” which was created by Worden. Learn more about T2108 on my T2108 Resource Page. AT200, or T2107, measures the percentage of stocks trading above their respective 200DMAs.
Active AT40 (T2108) periods: Day #24 over 20%, Day #8 above 30%, Day #7 over 40%, Day #6 over 50%, Day #5 over 60%, Day #1 over 70% (first overbought day following a day that ended a 3-day overbought period)
Daily AT40 (T2108)
")
Black line: AT40 (T2108) (% measured on the right)
Red line: Overbought threshold (70%); Blue line: Oversold threshold (20%)
Weekly AT40 (T2108)

*All charts created using FreeStockCharts unless otherwise stated
The T2108 charts above are my LATEST updates independent of the date of this given AT40 post. For my latest AT40 post click here.
Be careful out there!
Full disclosure: long UVXY, long JETS, long FCX, long NGE, long QSR, long TLT calls, short USD/TRY
*Charting notes: FreeStockCharts stock prices are not adjusted for dividends. TradingView.com charts for currencies use Tokyo time as the start of the forex trading day. FreeStockCharts currency charts are based on Eastern U.S. time to define the trading day.