
AT40 = 30.6% of stocks are trading above their respective 40-day moving averages (DMAs)
AT200 = 11.7% of stocks are trading above their respective 200DMAs
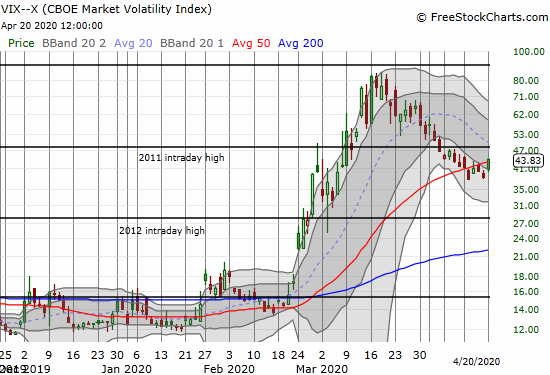
VIX = 43.8
Short-term Trading Call: cautiously bullish
Stock Market Commentary
The culture of collapse that has accompanied the coronavirus pandemic reached new lows. The on-going collapse in oil prices reached new extremes as the expiring May, 2020 contract plunged deeply into negative territory. Apparently, no one wants to take physical delivery of an over-produced commodity with nowhere to go. Oil producers just need to leave oil in the ground where it belongs for now!
As constructive as I am on the stock market given the impressive departure from oversold territory, this historic extreme in oil prices serves as a cautionary reminder that we remain in an era where anything and everything can happen at just about anytime. There is both peril and opportunity in this new reality of persistent extremes.
The Stock Market Indices
The S&P 500 (SPY) marginally broke out above its 50-day moving average (DMA) on a 2.7% gain on Friday. Monday’s pullback of 1.8% took the index back under its declining 50DMA. The upper Bollinger Band (BB) trading channel remains intact for now. A break below this channel will help confirm the warning signal from oil.
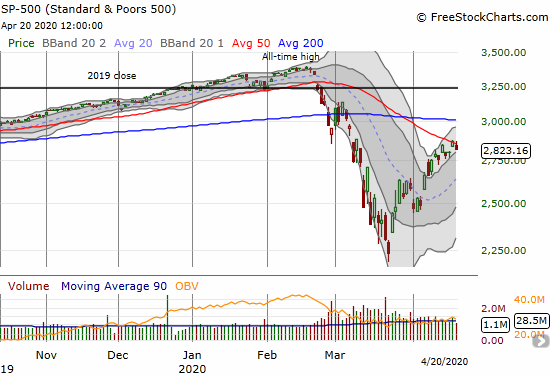
The NASDAQ (COMPQX) is doing its part to cling to positivity. The tech-laden index fell back 1.0% but still closed comfortably above its converged 50 and 200DMA supports. A fresh breakdown below these support levels would essentially confirm a new negative phase in the stock market.

Volatility
The volatility index (VIX) perked up on news of oil’s warning signs. The fear guage gained 14.9% and closed at a 1-week high. The downtrend from the March highs looks like it is over, especially with the VIX closing above its lower-BBs for the first time since the end of March. A freshly elevating VIX will serve as an on-going reminder of the potential for wild swings at any time in the stock market.
The Short-Term Trading Call

Thinking the drop in oil could not get much worse, I doubled down on a currency short in USD/CAD (long the Canadian dollar). Clearly my imagination is still not broad enough. I am treating this experience as an early warning and reminder that I cannot take for granted the recovery in financial markets. The NASDAQ is holding up hope. If it breaks down, then I will trade like a return to oversold conditions is all but assured. Given the proximity of oversold conditions, I am keeping my short-term trading call at cautiously bullish. There is little point in getting bearish when the market is closing in on new buying opportunities with good risk/reward ratios.
AT40 (T2108), the percentage of stocks trading above their respective 40DMAs, closed at 30.6%. This level is “close enough” to oversold in bull markets. In this bear market, I consider the pullback to the 30% threshold as another one of those warning signs of increased risks of lower prices ahead.
Speaking of the potential for lower prices, just two weeks ago, Tony Dwyer of Canaccord Genuity warned CNBC Fast Money viewers about an inevitable retest of the March bottom. The stubborn and on-going rally forced Dwyer to change his tune. Now Dwyer pegs the “inevitable” pullback to about 2500 on the S&P 500 (SPY). That price happens to be the closing price of the S&P 500 right before Dwyer made the call on CNBC about retesting the bottom. That moment was also right before the index made the impressive breakout above its 20DMA that helped launch the market out of oversold conditions. (The CNBC Fast Money crew politely failed to cross-reference Dwyer’s call with the earlier one).
Predictions are made to be wrong, so I fully understand the perils of getting on TV and throwing out price targets. The lesson I observe in this case is that even brilliant strategists like Dwyer have playbooks flawed by historical patterns and relationships which are breaking down before our eyes in unprecedented times. I learned quickly that the standard playbook for trading oversold periods was not working and had to cobble together hints of market behavior to salvage new strategies more suited to the historic moment.
Under these conditions, I greatly prefer options for short-term/swing trading. The risks of downdrafts keep me away from shares except when the market offers a deep discount for a longer-term investment. Otherwise, I prefer the tightly capped risk profile of options when at any moment the market can suddenly swing by 5%, up or down…or crash.
Stock Chart Reviews – Below the 50DMA
Apple (AAPL)
On Friday, Goldman Sachs downgraded Apple (AAPL) from neutral to an outright sell and a $233 price target. It is rare to see analysts downgrade stocks to sell ratings. It is even MORE rare to see such a thing on a venerable stock like AAPL! AAPL is feeling the pressure with 50DMA support marginally giving way. On Friday I proceeded with my weekly AAPL trade on a bet that the 50DMA breakout would hold…

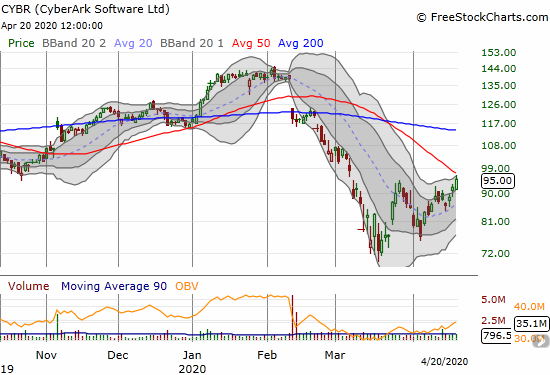
CyberArk (CYBR)
I keep checking in on cybersecurity firm CyberArk (CYBR) as I look to increase my investments and trades on the digital economy that should thrive in a COVID-19 world. I did not buy the 20DMA breakout, but I will finally start buying on a confirmed 50DMA breakout.
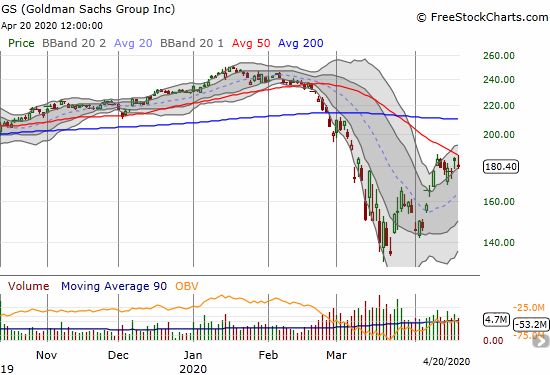
Goldman Sachs (GS)
Goldman Sachs (GS) met stiff resistance at its 50DMA looming overhead. Follow-through selling and a breakdown below the upper-BB trading channel would be yet one more warning sign for the general stock market.
Stock Chart Reviews – Above the 50DMA
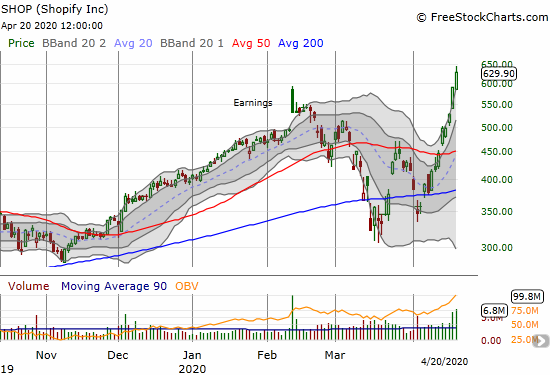
Shopify (SHOP)
The digital economy is symbolized in a growing array of successful companies. E-commerce platform provider Shopify is rivaling Amazon.com (AMZN) for the posterboy title. This incredible stock is up over 50% since its combined 20/200DMA breakout just two weeks ago! The 50DMA breakout was yet another spot for buying that I passed up. Now at all-time highs I am not interested in chasing!
Wix.com (WIX)
I took profits in Wix.com (WIX) when it bounded toward 50DMA resistance. The combined 50 and 200DMA breakouts are forcing me to consider jumping back in. WIX is likely on the verge of becoming the Shopify of web publishing platforms, and I will kick myself if I am not positioned for the ride. A second close higher above the 200DMA confirms the breakout and gets me back in the stock.

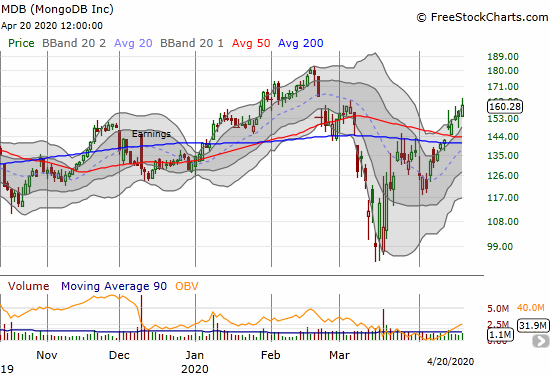
MongoDB (MDB)
MongoDB (MDB) helps power the digital economy with the latest in database technology. I have long been reluctant to hold the stock for long given its volatile behavior and wide spreads. This latest display of strength and resilience with the combined 50/200 DMA breakout has me primed to start accumulating the stock for a longer-term investment.
— – —
FOLLOW Dr. Duru’s commentary on financial markets via email, StockTwits, Twitter, and even Instagram!
“Above the 40” uses the percentage of stocks trading above their respective 40-day moving averages (DMAs) to assess the technical health of the stock market and to identify extremes in market sentiment that are likely to reverse. Abbreviated as AT40, Above the 40 is an alternative label for “T2108” which was created by Worden. Learn more about T2108 on my T2108 Resource Page. AT200, or T2107, measures the percentage of stocks trading above their respective 200DMAs.
Active AT40 (T2108) periods: Day #5 over 20% (overperiod), Day #2 over 30% (overperiod), Day #49 under 40%, Day #40 under 50%, Day #59 under 60%, Day #63 under 70%
Daily AT40 (T2108)
")
Black line: AT40 (T2108) (% measured on the right)
Red line: Overbought threshold (70%); Blue line: Oversold threshold (20%)
Weekly AT40 (T2108)

*All charts created using FreeStockCharts unless otherwise stated
The T2108 charts above are my LATEST updates independent of the date of this given AT40 post. For my latest AT40 post click here.
Be careful out there!
Full disclosure: long SSO shares, long USO call options, short USD/CAD, short UVXY, long AAPL call spread
*Charting notes: FreeStockCharts stock prices are not adjusted for dividends. TradingView.com charts for currencies use Tokyo time as the start of the forex trading day. FreeStockCharts currency charts are based on Eastern U.S. time to define the trading day.