
AT40 = 33.8% of stocks are trading above their respective 40-day moving averages (DMAs)
AT200 = 11.3% of stocks are trading above their respective 200DMAs
VIX = 42.0
Short-term Trading Call: cautiously bullish
Stock Market Commentary
Crash culture started this week with an astonishing collapse in oil prices. The stock market held on admirably, especially tech stocks. Still, the sellers took firm control on Tuesday. Buyers stepped right back in the next day with full force. Just as Tuesday’s plunge was swift and decisive, Wednesday’s gap up left a lot of sellers and bears suddenly stranded. This back and forth could be a prototypical precursor to the battle lines that will play out for some time above the March lows and below last week’s recovery high. These battle lines are just as important as the battle lines buyers won over 20-day moving average (DMA) resistance at the beginning of April. I suspect both bears and bulls are just as confident now as they were then.
The Stock Market Indices
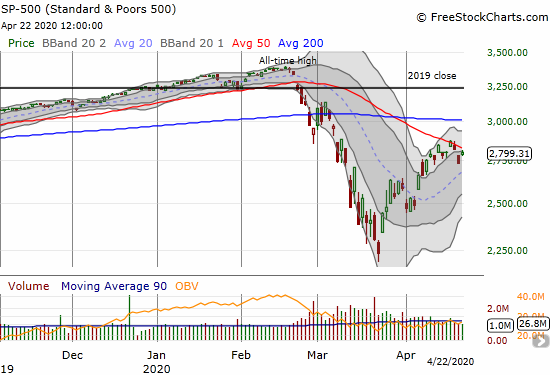
The S&P 500 (SPY) rebounded 2.3% but stopped just short of 50DMA resistance. The index’s declining 50DMA is an important battle line given buyers were soundly rejected from Friday’s test of resistance. Moreover, the S&P 500 is below its upper Bollinger Band which ends the primary uptrend that led to the 50DMA test.
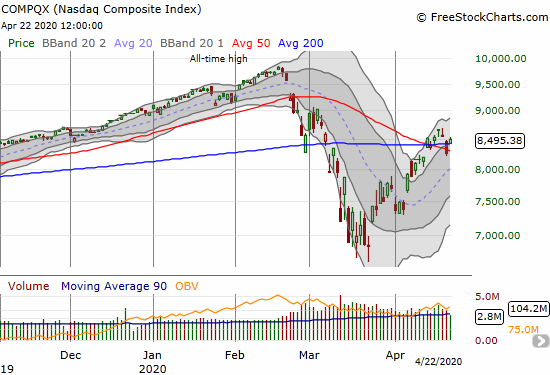
The NASDAQ (COMPQX) gave up the ghost on Tuesday by slicing through both 200 and 50DMA lines of support. This breakdown looked like a clear confirmation of Monday’s warning from the crash in oil prices. Instead, the tech-laden index roared right back with an opening gap that cleared both moving averages. Just like that, tech is all over again providing a leadership of light for the stock market.
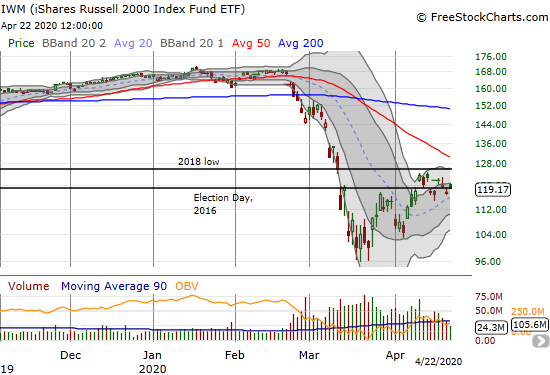
The iShares Russell 2000 Index Fund ETF (IWM) is fighting its own battles. For two weeks the index of small cap stocks has bounced in a trading range formed by its 2018 closing low and its closing price on Election Day 2016. For the last 6 trading days, IWM has barely budged from the lower part of this trading range. A sharply declining 50DMA is getting ready to force the issue between bears and bulls between these battle lines.
Volatility
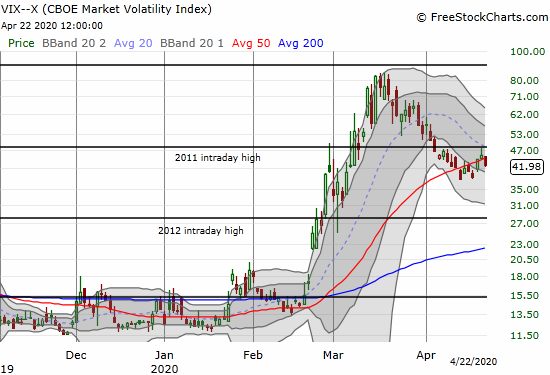
The volatility index (VIX) perked up on Monday. On Tuesday it faded from the 2011 intraday high. Now it looks like the VIX is fighting with its uptrending 50DMA by pivoting around it. The downtrend from March highs is definitely over, and the VIX remains quite elevated.
The Short-Term Trading Call
AT40 (T2108), the percentage of stocks trading above their respective 40DMAs, closed at 33.8%. My favorite technical indicator returned right to its bullish close from last Friday. AT40 is suddenly outpacing the S&P 500 (SPY) and formed a mild bullish signal. This move puts the short-term odds back in favor with the bulls….but just barely. I am remaining patient and trading little as I await the next definitive move from the S&P 500. I will quickly move from cautiously bullish to bullish if we drop to another oversold period. However, I will also exercise more patience than I did in the early days of the historic oversold period from March!
Stock Chart Reviews – Below the 50DMA
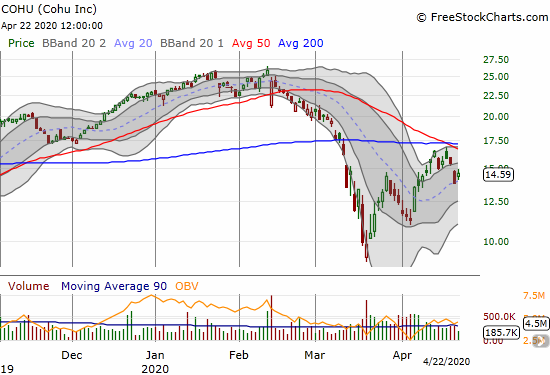
Cohu (COHU)
Cohu (COHU) is one of many stocks that failed at or just under converged 50 and 200DMA resistance. I am looking for a play to bounce off 20DMA support for another try at overhead resistance. I like buying on a move above Wednesday’s intraday high. Bears can have at it below the 20DMA.
Stock Chart Reviews – Above the 50DMA
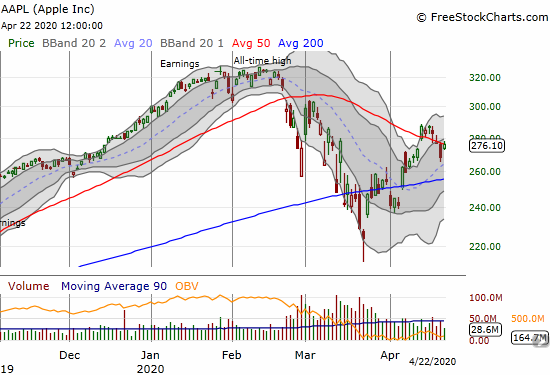
Apple (AAPL)
Apple (AAPL) is toying with my technical heart strings. Last week’s trading above the 50DMA looked like a platform for a fresh move higher. Tuesday’s 3.1% drop below the 50DMA looked like “game over.” Wednesday’s gap up and 2.9% gain closed AAPL a fraction of a point above its 50DMA. The resolution of this pivoting should be part of, or even lead, the next major move in the stock market.
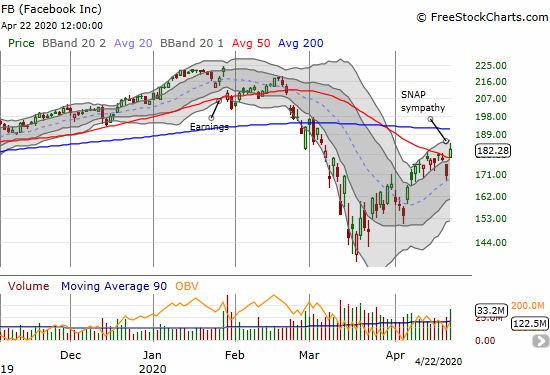
Facebook (FB)
I had to rub my eyes twice. Facebook (FB) gapped over its 50DM and traded as high as 8% on sympathy with earnings results from Snap (SNAP). SNAP is still a sliver of Facebook’s size. Anyway, perhaps thanks to short-covering, SNAP soared 36.7% post-earnings. FB’s move is definitively bullish. I jumped on a calendar call spread at the $190 strike to make a play on a run into next week’s earnings. I bought a weekly put option as a partial hedge.
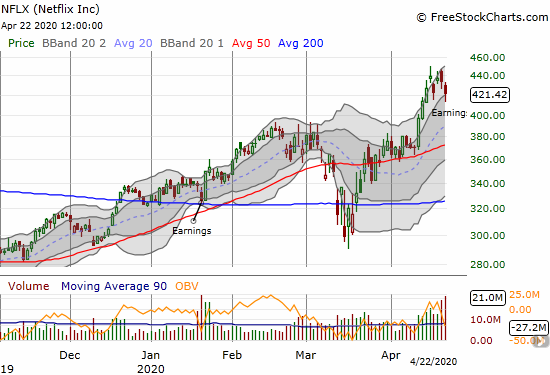
Netflix (NFLX)
Netflix (NFLX) dropped 2.9% post-earnings. The stock is now forming a topping pattern under $450. A breakout above this resistance would be freshly bullish. Otherwise, I think NFLX will eventually retest support at its 20 and/or 50DMAs. A key quote from Co-Founder, Chairman, President & CEO Reed Hastings on the NFLX earnings conference call suggests the company has hit a ceiling for now (from Seeking Alpha transcripts and emphasis mine):
“I think have a planning model, you have to have a model of COVID and when are certain treatments coming online, how broadly are they distributed, when are vaccines coming online, how quickly can they be manufactured. And we don’t know any more than anybody else on those big elements, and that is the most significant aspect. So think about it as we’re in the same uncertainty that everyone else is.
The things we are certain of is the Internet is growing. It’s a bigger part of people’s lives, thankfully. And people want entertainment. They want to be able to escape and connect, whether times are difficult or joyous. That’s pulling up. We’ve had an increase in subscriber growth in March. It’s essentially a pull forward of the rest of the year. So our guess is that subs will be light in Q3 and Q4 relative to prior years because of that. But we don’t use the words guess and guesswork lightly. We use them because it’s a bunch of us feeling the wind, and it’s hard to say. But again, will Internet entertainment be more and more important over the next 5 years? Nothing has changed in that.”
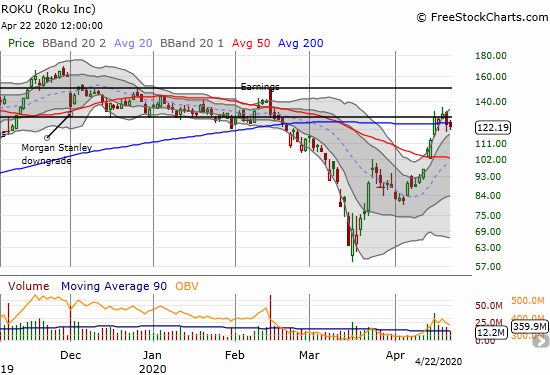
Roku (ROKU)
Speaking of important entertainment platforms for the coronavirus pandemic era, Roku (ROKU) is fighting a battle with a pivot around its 200DMA. The 200DMA neatly converged with the lower part of the previous trading range. A push through this congestion is bullish and sets up a new and higher consolidation period. While ROKU is an extremely expensive stock, I was still surprised that it traded as low as it did last month. Earnings guidance last week reignited excitement starting with a 50DMA breakout. Key quote from the press release:
“Roku estimates 39.8 million Active Accounts as of March 31, 2020, a net increase of nearly 3 million since December 31, 2019. Roku also expects first quarter Streaming Hours will be 13.2 billion, a 49% year-over-year increase.”
— – —
FOLLOW Dr. Duru’s commentary on financial markets via email, StockTwits, Twitter, and even Instagram!
“Above the 40” uses the percentage of stocks trading above their respective 40-day moving averages (DMAs) to assess the technical health of the stock market and to identify extremes in market sentiment that are likely to reverse. Abbreviated as AT40, Above the 40 is an alternative label for “T2108” which was created by Worden. Learn more about T2108 on my T2108 Resource Page. AT200, or T2107, measures the percentage of stocks trading above their respective 200DMAs.
Active AT40 (T2108) periods: Day #7 over 20% (overperiod), Day #1 over 30% (overperiod ending 1 day below 30%), Day #51 under 40%, Day #42 under 50%, Day #61 under 60%, Day #65 was under 70%
Daily AT40 (T2108)
")
Black line: AT40 (T2108) (% measured on the right)
Red line: Overbought threshold (70%); Blue line: Oversold threshold (20%)
Weekly AT40 (T2108)

*All charts created using FreeStockCharts unless otherwise stated
The T2108 charts above are my LATEST updates independent of the date of this given AT40 post. For my latest AT40 post click here.
Be careful out there!
Full disclosure: long SSO shares, short UVXY, long AAPL call spread, long FB calendar call spread and put
*Charting notes: FreeStockCharts stock prices are not adjusted for dividends. TradingView.com charts for currencies use Tokyo time as the start of the forex trading day. FreeStockCharts currency charts are based on Eastern U.S. time to define the trading day.