
AT40 = 2.5% of stocks are trading above their respective 40-day moving averages (DMAs) (20th oversold day)
AT200 = 3.7% of stocks are trading above their respective 200DMAs (new low for the oversold period)
VIX = 61.7
Short-term Trading Call: bullish
Stock Market Commentary
The week did not start as I feared with a 5th circuit breaker shut-down in less than three weeks. Instead, the culture of collapse took a small respite, and the S&P 500 (SPY) “only” lost 2.9%. Now indiscriminate selling in some stocks is finally slowing or even ending as a part of the green shoots I was squinting about over the weekend. The green shoots even showed up in the trend report on Swingtradebot.com with the NASDAQ-100 and Russell 2000 shifting to short-term uptrends for the first time in weeks.
Oversold
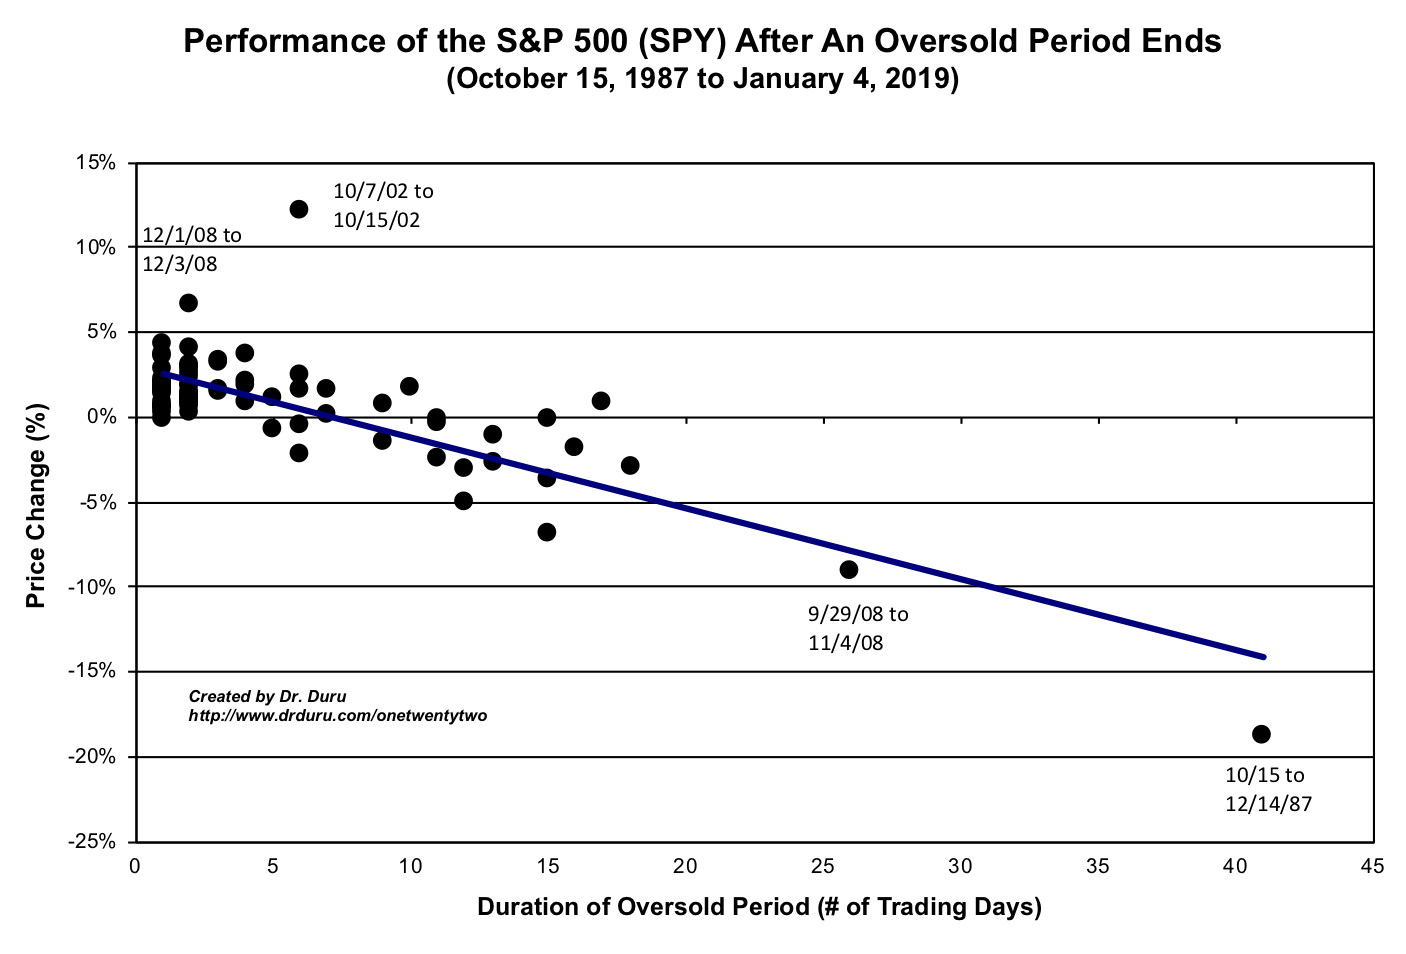
I call the stock market oversold when AT40 (T2108), the percentage of stocks trading above their 40DMAs, closes below 20%. This historic oversold period is now 20 days long. Six more days of this churn and agony will take the stock market to the first half of the financial crisis when an oversold period lasted 26 days (a second oversold period soon followed). Since the first oversold day, the S&P 500 (SPY) has lost 21.5%. Per the chart below, if this oversold period ends in 6 trading days, then there should be about 10 percentage points in gains ahead. I always gulp hard when my eyes wince over the point representing the 1987 stock market crash.
The Stock Market Indices
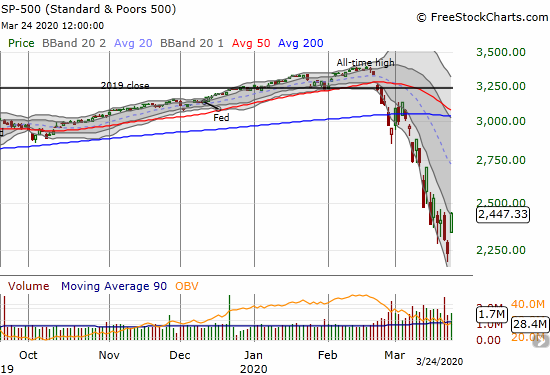
The S&P 500 (SPY) gained 9.4% a day after hitting prices last seen in late November. The index almost wiped away its entire gain since the November, 2016 U.S. Presidential election (another Trump Trade in reverse)! More importantly, the S&P 500 closed at its high of the day and tested the top of its lower Bollinger Band (BB) for the first time since its 200DMA breakdown. If the index actually manages to put together a second up day in a row, the resulting breakout from the primary downtrend will have doubly bullish significance. A green shoot awaits a moment to stretch a little higher to the sun.
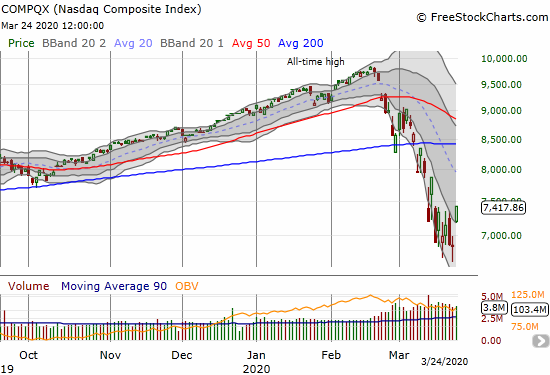
The NASDAQ (COMPQX) continues to lead the way ahead of the S&P 500. The tech-laden index’s 8.1% jump hurdled right out of the downtrend channel formed by the lower Bollinger Band (BB). The NASDAQ is now a buy on the dips candidate with a conservative stop below today’s intraday low or a more aggressive stop below this week’s intraday low (a 14-month low) for the more aggressive. Accordingly, I bought a weekly calendar call spread on QQQ at the $190 strike, and I intend to buy shares on a dip on Wednesday if the market offers one.
Volatility
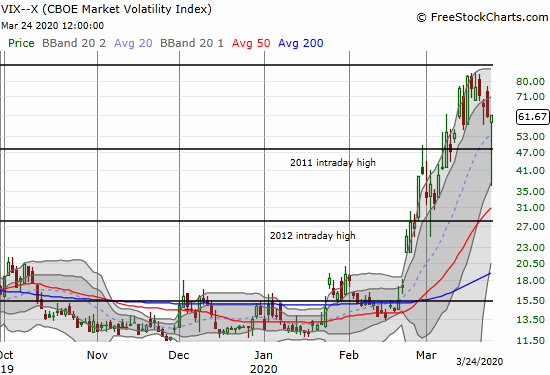
The volatility index (VIX) prevented me from getting fully optimistic. The fear gauge took a steep tumble (the intraday low in the chart below is incorrect), but managed to rally alongside the market. The flat close reaffirms a high level of fear and concern whereas I was looking forward to a break below last week’s intraday low as a confirmation that the VIX may have topped for this cycle.
The Short-Term Trading Call
In my last Above the 40 post, I noted how I was looking for buyers to form a stronger base of support. The green shoots of that support are appearing in the NASDAQ and certain stocks. I am now seeing more stocks string together consecutive up days. I am seeing stocks break out above downtrends. I am seeing stocks break away from days of churn and consolidation patterns that can provide the basis of support. In other words, the green shoots are stretching taller and getting healthier.
Again, this is a market where anything can happen, so I still took some profits in long positions as well as bought a few more backstops
Stock Chart Reviews – Below the 200DMA
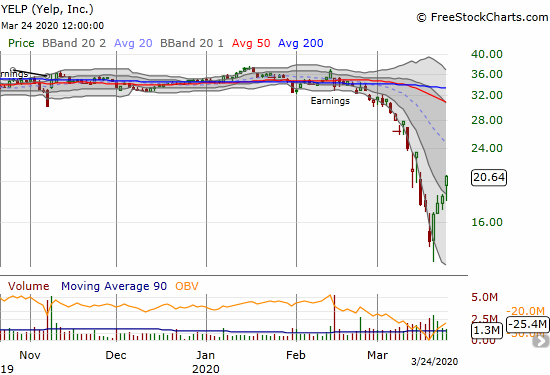
Yelp.com (YELP)
I identified Yelp.com (YELP) for my shopping list early in the oversold period. Since I saw risk down to $20, I decided to wait. If only I had made that decision on other trades! Anyway, when YELP got to $20, the stock was falling so fast I waited more. When buyers staged a big comeback last Thursday, I jumped in. I took profits today despite YELP making a bullish breakout from its lower-BB downtrend and stringing together 4 straight up days. YELP is a buy on the dips.
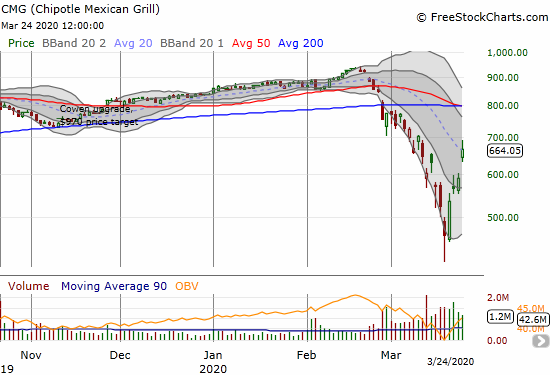
Chipotle Mexican Grill (CMG)
I missed the buy signal in Chipotle Mexican Grill (CMG) when it held support on Monday at the top its lower-BB. I thus missed out on a juicy 12.8% gain on this day. CMG is a buy on the dips with a sell target at converging resistance at the 50 and 200DMAs.
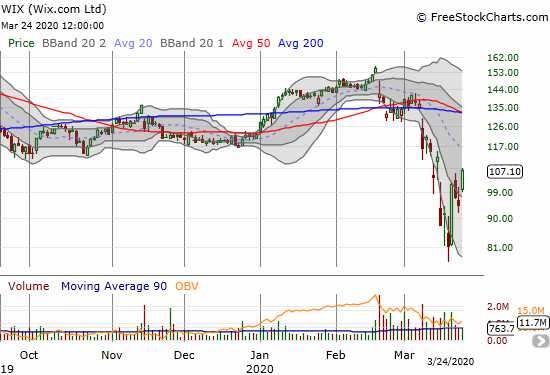
Wix.com (WIX)
Wix.com (WIX) gained 25.3% last Thursday and became an early stock testing the top of its lower-BB. Today’s 13.4% gain is a bullish breakout and follow-through. I want to start buying WIX as soon as I can with a stop below Monday’s intraday low.
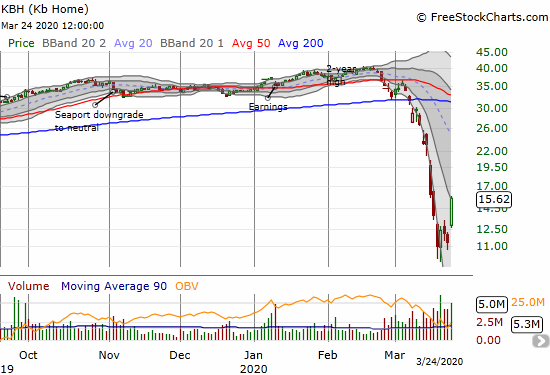
KB Home (KBH)
Housing-related stocks and home builders in particular have suffered mightily during this market crash. I slowed my accumulation going into the most recent lows. KB Home (KBH) has been on my radar because of earnings this week. I was floored to see the stock jump 37.6% and immediately test the top of its lower-BB. If not for the March 26th earnings release, I would feel quite comfortable putting KBH on the “buy the dips” list.
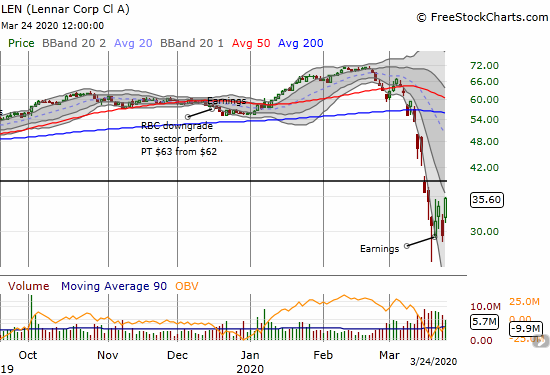
Lennar (LEN)
Lennar (LEN) is on my buy list as the stock is forming a base around last week’s earnings report. I particularly like buying shares and selling calls against them while volatility remains elevated. I read through the transcript of the company’s earnings report and was greatly encouraged. The company seems very prepared for ramping up its digital sales process in this era of social distancing. Lennar also seems prepared to weather the storm. Tragically, a Lennar associate in Washington was one of America’s first deaths from the coronavirus.
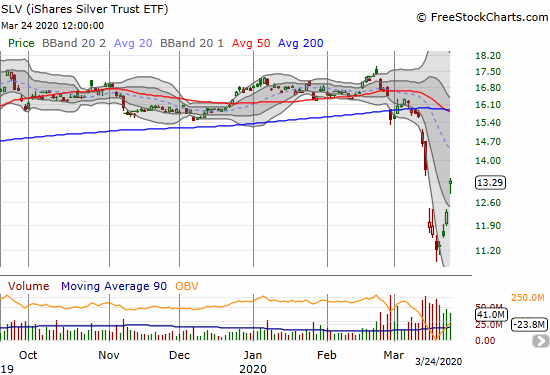
iShares Silver Trust ETF (SLV)
I am glad I stuck by iShares Silver Trust ETF (SLV) given the massive amount of monetary support provided by the Federal Reserve. I have to believe that silver (and gold) only sold off so hard because of forced liquidations. Hopefully, that phase of the sell-off is over as SLV jumped 8.0% and cleared its lower-BB downtrend.
Stock Chart Reviews – Above the 200DMA
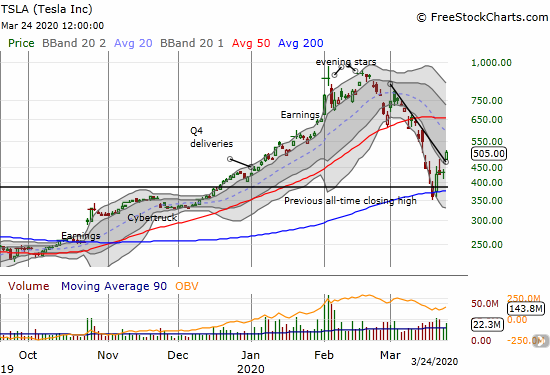
Tesla (TSLA)
I did not expect it so soon, but here is Tesla (TSLA) breaking out above its primary downtrend. The 16.3% gain was impressive even for TSLA. This move also confirms support at the converged 200DMA and former all-time high. TSLA is a buy on the dips until/unless it breaks through today’s intraday low.
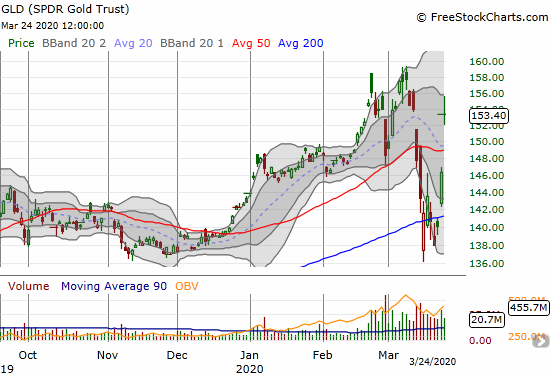
SPDR Gold Trust (GLD)
The SPDR Gold Trust (GLD) went nearly straight down and jumped straight up. Like SLV, I was startled by the buying opportunity offered up by the market given the massive amount of stimulus (and resulting money-printing and debt surges) being added to global economies. I just wish I bought calls outright instead of the call spread (recall that I focused on spreads to reduce the cost of options positions with elevated volatility measures).
I hope to write a piece soon on my expectations for much higher inflation once economies get on the other side of this virus crisis.
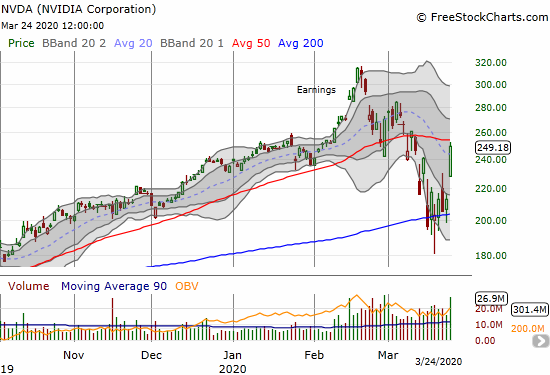
NVIDIA (NVDA)
NVIDIA (NVDA) is my biggest miss of the week (so far). NVDA convincingly held support at its 200DMA and was on my shopping list as a result. I should have nibbled at anytime in the last week. Instead, I stood by and watched NVDA soar 17.2% right into 50DMA resistance…where I would have promptly locked in profits.
I clearly need to do a better job of tracking all the opportunities spread across the stock market.
— – —
FOLLOW Dr. Duru’s commentary on financial markets via email, StockTwits, Twitter, and even Instagram!
“Above the 40” uses the percentage of stocks trading above their respective 40-day moving averages (DMAs) to assess the technical health of the stock market and to identify extremes in market sentiment that are likely to reverse. Abbreviated as AT40, Above the 40 is an alternative label for “T2108” which was created by Worden. Learn more about T2108 on my T2108 Resource Page. AT200, or T2107, measures the percentage of stocks trading above their respective 200DMAs.
Active AT40 (T2108) periods: Day #20 under 20% (oversold day #20), Day #21 under 30%, Day #32 under 40%, Day #23 under 50%, Day #42 under 60%, Day #46 under 70%
Daily AT40 (T2108)
")
Black line: AT40 (T2108) (% measured on the right)
Red line: Overbought threshold (70%); Blue line: Oversold threshold (20%)
Weekly AT40 (T2108)

*All charts created using FreeStockCharts unless otherwise stated
The T2108 charts above are my LATEST updates independent of the date of this given AT40 post. For my latest AT40 post click here.
Be careful out there!
Full disclosure: long QQQ and calendar call spread, long SSO, short UVXY shares and long call spreads, long TSLA put and calls, long LEN calls, long KBH calls and shares, long SLV shares and calls, long GLD shares and call spread
*Charting notes: FreeStockCharts stock prices are not adjusted for dividends. TradingView.com charts for currencies use Tokyo time as the start of the forex trading day. FreeStockCharts currency charts are based on Eastern U.S. time to define the trading day.