
AT40 = 69.6% of stocks are trading above their respective 40-day moving averages (DMAs) (ends 1-day overbought period)
AT200 = 63.1% of stocks are trading above their respective 200DMAs
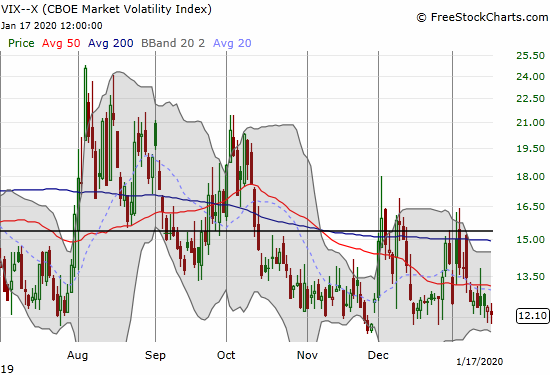
VIX = 12.1
Short-term Trading Call: neutral
Stock Market Commentary
The stock market finally pushed into overbought territory on Thursday. The breakout only lasted for a day. While I doubted for weeks that the market’s buying power and breadth would generate overbought conditions anytime soon, I now doubt the adventures with overbought conditions will end quickly. I thought about buying call options on IWM or XLF as “catch-up” trades on a break into overbought territory, but now I am content to be more patient.
The chart below shows the importance of overbought conditions as measured by AT40 (T2108), the percentage of stocks trading above their respective 40-day moving averages (DMAs). Basically, the longer buyers keep the market overbought, the better the S&P 500 (SPY) tends to perform with the major pivot point occurring above a 20-day duration.
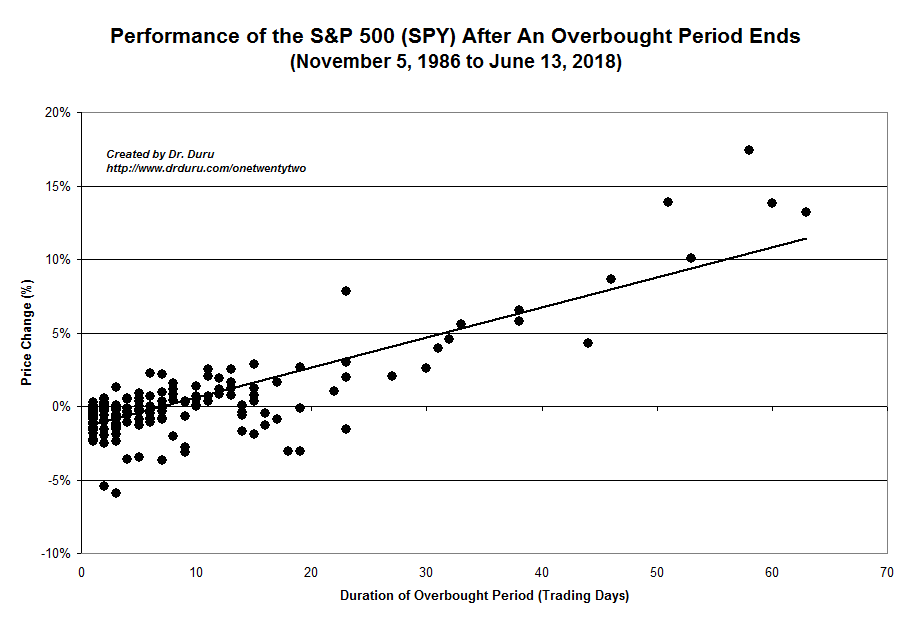
Also note the heavy concentration of overbought periods that last less than 10 days. After 10 days, the clock really starts ticking on the overbought period. I will refer to this chart frequently once/if the market sustains overbought trading.
While I assumed bearish divergences were over, AT40 and the S&P 500 once again defied my expectations. AT40 pulled back and dropped out of overbought conditions ever so slightly. Meanwhile, the S&P 500 actually accelerated upward. The index closed above its upper Bollinger Band (BB) the last two trading days. This divergence brings back whispers of bearishness and puts me right back on alert. This market is strong, but even the strongest momentum cannot sustain closes above the upper-BB for extended periods of time.
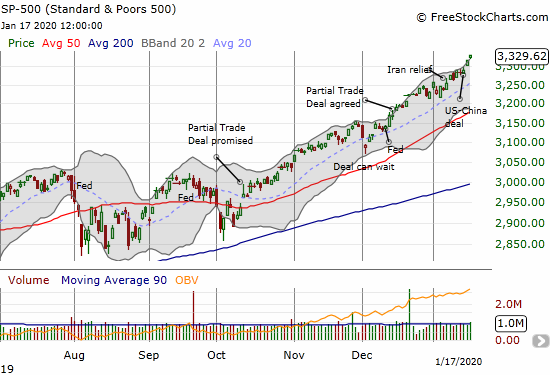
The acceleration upward made me pullback for some context. When the S&P 500 ran up into a climactic top in January, 2018, I was caught a bit off-guard because the index closed above its upper-BB multiple times before topping out. AT40 jumped into overbought territory in the middle of the run-up. I promptly switched my trading call from cautiously bullish to bullish; the market took another two weeks to finally top out. That period was a classic example of the power of (extended) overbought trading conditions.
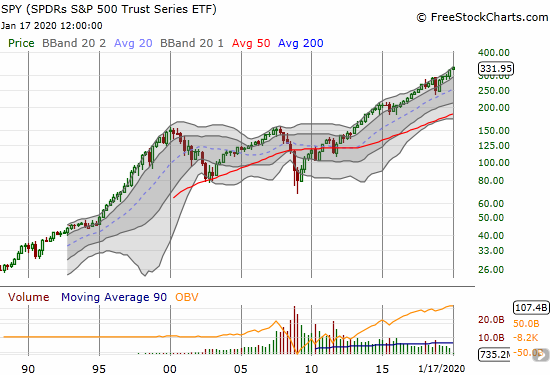
This period of extraordinary strength compelled me to zoom out and look at the S&P 500 longer-term. The quarterly view below is truly a remarkable sight. The 2000s were bracketed by major sell-offs preceded by and followed by extended periods of relatively persistent and relentless strength. Taking this kind of pause makes me appreciate better the impact of “coming of age” as a trader in the 2000s: I am likely more cautious than I should be!
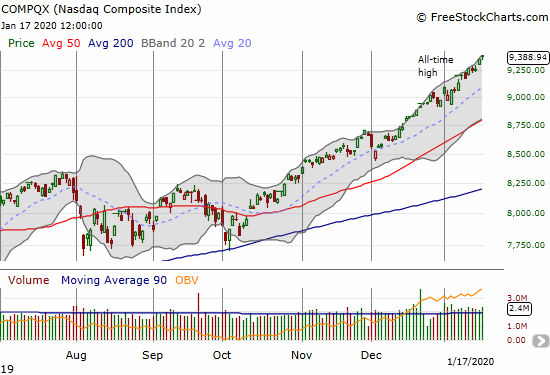
Anyway, back to the view right in front of me…The NASDAQ (COMPQX) is doing its own version of persistent and relentless upward strength.
Volatility
The volatility index (VIX) is stubbornly clinging to the 12 level as support. Again, if the VIX drops to 11 and below, it will enter a period of extra low volatility (ELV), that can be very bullish for the S&P 500. Otherwise, I am expecting another one of those sudden (and fadeable) VIX spikes in the coming month or so.
The Short-Term Trading Call
My trading call remains the same even with AT40 already dropping out of overbought conditions. As a reminder, I lifted my bear/bull line in the sand from $320 to $326.50 for SPY. Per the AT40 Trading rules, I will not get bearish on the market while my favorite index is in overbought territory. AT40 must confirm a drop from overbought territory before I consider downgrading from my short-term neutral stance.
Stock Chart Reviews – Below the 50DMA
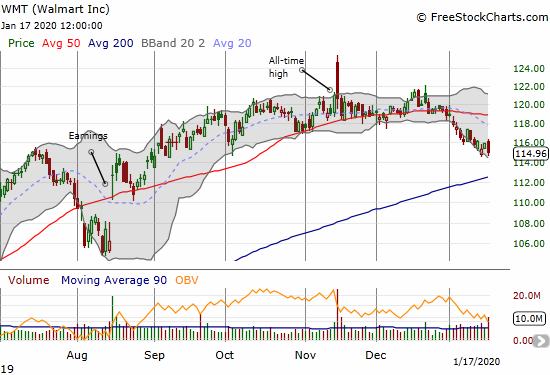
Walmart (WMT)
Walmart (WMT) made a big splash when it initially gapped up post-earnings in November. The excitement quickly fizzled and now WMT stands out for its significant under-performance in 2020 relative to the S&P 500. The topping pattern I pointed out in November is indeed unfolding.
WMT broke out above its 200DMA on December 27, 2018 and never looked back. So the presumed upcoming test of 200DMA support will be extremely important to watch!
Stock Chart Reviews – Above the 50DMA
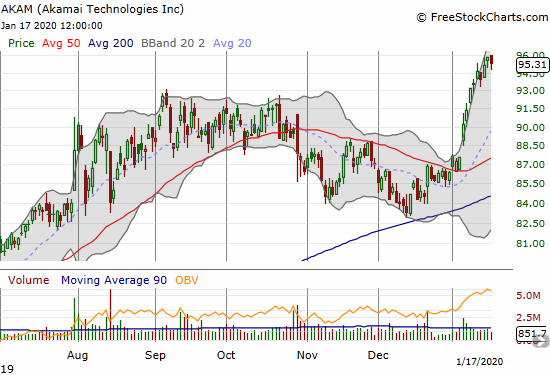
Akami Technologies (AKAM)
Akami (AKAM) is often forgotten in the talk of the latest and hottest internet/networking-related stocks. The stock likely returned to many radars with its breakout this month. AKAM is now approaching a 20-year high.
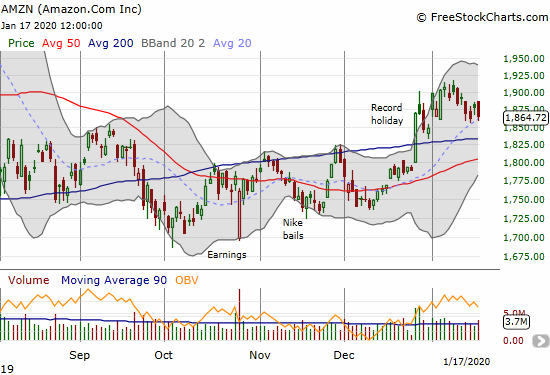
Amazon.com (AMZN)
Amazon.com (AMZN) looks increasingly “suspicious.” After surging on news of a record holiday season, the stock has mainly churned. AMZN is up just 0.9% year-to-date compared the S&P 500’s 3.1% and the NASDAQ’s 4.6%. I will be looking for a bearish options play on AMZN’s January 30th earnings (most likely a put spread married to a calendar put spread at a lower strike.)
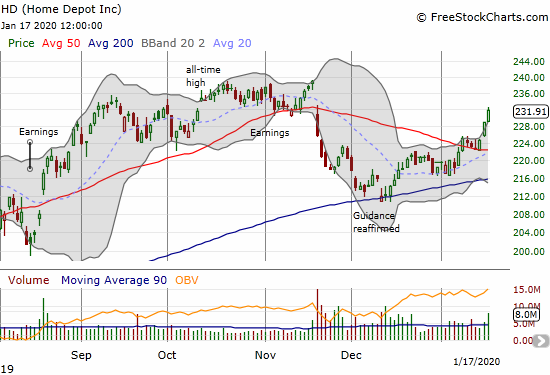
Home Depot (HD)
In December, I pointed to Home Depot (HD) for a rebound going into its Analyst Day on December 11th. I bought January $230 call options thinking that was plenty of runway. HD proceeded to sell-off further going into the Analyst Day and then it gapped down as a final climactic move in response to the Analyst Day. I stubbornly bought more call options and that lowered basis is the only reason I got close to even at expiration as HD was surging above its upper Bollinger Band. In retrospect, I should have reset the trade upon the bullish 50DMA breakout. HD is now working on reversing all its post-earnings losses.
I am once again left astounded by the market’s manic reactions to presumably bad news. Between earnings and the gap down for reaffirmed guidance, a casual observe could conclude that HD was in trouble. Last week’s 50DMA rebound and run-up serve as a reminder of just how “wrong” the market’s initial reactions can be.
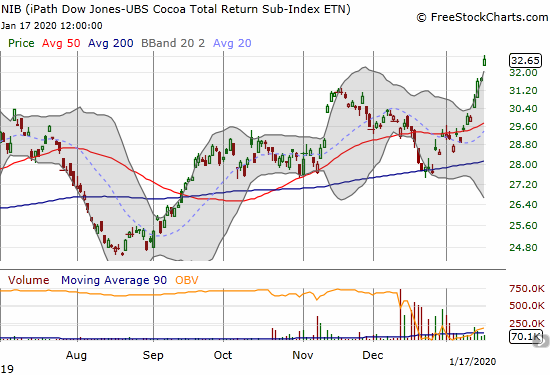
iPath Bloomberg Cocoa SubTR ETN (NIB)
The latest buying opportunity on iPath Bloomberg Cocoa SubTR ETN (NIB) worked out a lot faster than I could have imagined. The steepness of the rally compelled me to take profits. With a breakout to a 20-month high, NIB remains a buy on the dips.
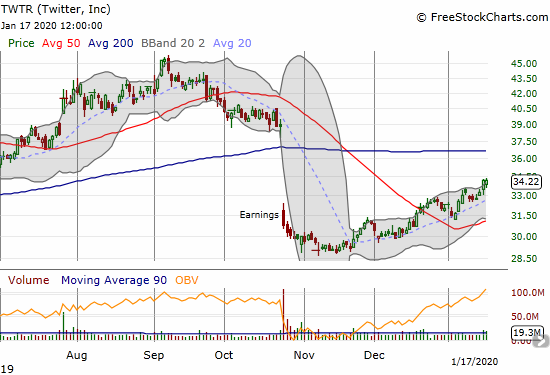
Twitter (TWTR)
Twitter (TWTR) is one my stubborn long-term positions as I have an on-going longer-thesis to match. I used the post-earnings implosion in October to accumulate a larger position. So far, so good (I even successfuly sold a call against part of the position). TWTR broke out above its 50DMA in December and now trades at a post-earnings high.
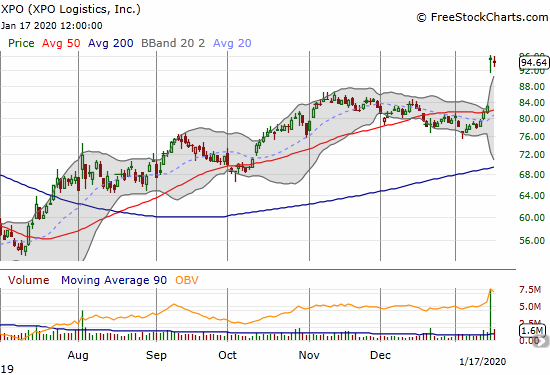
XPO Logistics (XPO)
XPO Logistics (XPO) continues its long march toward recovery. The damage of a short seller in December, 2018 is a distant memory. XPO has even doubled since then. Last week’s gap up and surge came on news of the company conducting a strategic review. Buying into XPO here becomes a near binary proposition: either 1) this move is the beginning of a final ramp to full valuation, or 2) this move is a big headfake that will deliver a rapid reversal of last week’s gains. I did not happen to have a new position ahead of last week’s news.
— – —
FOLLOW Dr. Duru’s commentary on financial markets via email, StockTwits, Twitter, and even Instagram!
“Above the 40” uses the percentage of stocks trading above their respective 40-day moving averages (DMAs) to assess the technical health of the stock market and to identify extremes in market sentiment that are likely to reverse. Abbreviated as AT40, Above the 40 is an alternative label for “T2108” which was created by Worden. Learn more about T2108 on my T2108 Resource Page. AT200, or T2107, measures the percentage of stocks trading above their respective 200DMAs.
Active AT40 (T2108) periods: Day #250 over 20%, Day #89 over 30%, Day #64 over 40%, Day #31 over 50%, Day #5 over 60% (corrected overperiod), Day #1 under 70% (ending 1 day overbought, over 70%)
Daily AT40 (T2108)
")
Black line: AT40 (T2108) (% measured on the right)
Red line: Overbought threshold (70%); Blue line: Oversold threshold (20%)
Weekly AT40 (T2108)

*All charts created using FreeStockCharts unless otherwise stated
The T2108 charts above are my LATEST updates independent of the date of this given AT40 post. For my latest AT40 post click here.
Be careful out there!
Full disclosure: long VIXY calls, long TWTR
*Charting notes: FreeStockCharts stock prices are not adjusted for dividends. TradingView.com charts for currencies use Tokyo time as the start of the forex trading day. FreeStockCharts currency charts are based on Eastern U.S. time to define the trading day.