
Housing Market Intro/Summary
The stocks of home builders are starting to fail their moment of truth.
A Moment of Truth Looming Ever Larger
On October 25th, the iShares Dow Jones Home Construction ETF (ITB) hit a 21-month high that coincided exactly with a major multi-year peak and post-recession high from January, 2018. The sellers showed up right on schedule the following week, buyers responded with a deep recovery on October 25th, and sellers returned in force today (November 4th) on the heels of a downgrade from Seaport Global Securities, an analyst shop I am learning about for the first time. Seaport downgraded KB Home (KBH) and Pulte Homes (PHM) from buys to neutral reciting a growing refrain from the momentum crowd: the stocks of home builders have already rallied a lot this year. Moreover, large builders have stretched valuations.
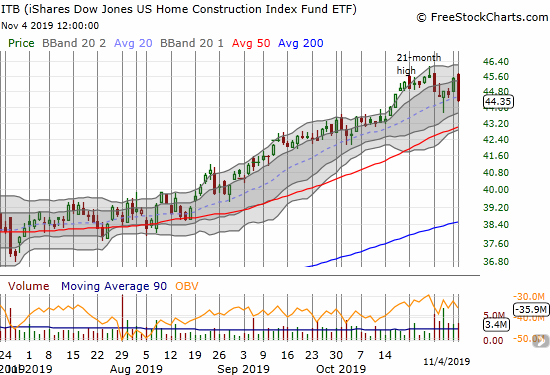
The interest in taking profits on 2019’s gains is understandable, but it fails to take into account the disastrous loss these same stocks suffered in 2018. Sure ITB is up 47.6% year-to-date. However, ITB LOST 31.3% in 2017. This year’s gains only created a net stalemate for ITB with the 2018 high that January.
The valuation point is valid on large home builders – the high price/book value on PHM is one of the reasons I decided to take no action in the wake of Pulte Homes’s mostly solid earnings report. KBH on the other hand does not suffer the same valuation problem. In fact, KBH remains an on-going valuation laggard. According to Yahoo Finance, KBH still has an enticing price/book of 1.4 and a price/sales ratio that is STILL below 1.0! Needless to say, I am eyeing KBH as one of the first stocks I buy in the wake of this selling as a play on the seasonally strong period for the stocks of home builders.
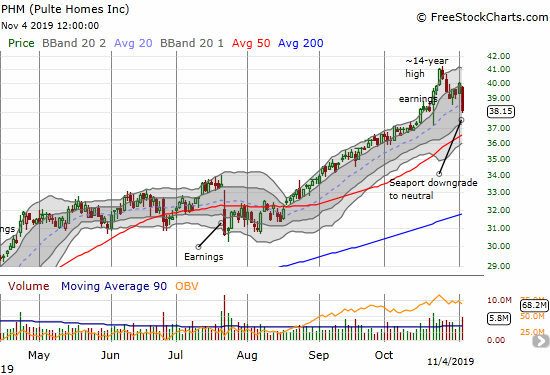
Interestingly, Seaport upgraded Pulte Homes to a buy just over two months ago on August 23rd with a $44 price target. Not only did PHM fail to hit this price target, but also the downgrade came with PHM still trading 10% away from the price target. The timing of the downgrade makes Seaport particularly bearish on PHM.
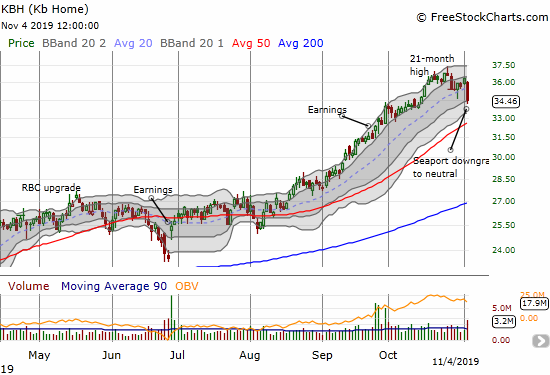
Also on August 23rd, Seaport upgraded KB Home to a buy. Seaport set a $37 price target. Unlike the downgrade of PHM, KBH received its downgrade shortly after hitting the $37 price target. Perhaps the delay was timed to determine whether KBH could continue its momentum and perhaps warrant a reiteration and higher price target.
Seaport also issued a buy rating on Lennar (LEN) with a $71 price target on August 23rd. LEN last peaked at $62 and closed today at $59.31. If Seaport downgrades LEN at these levels, they will solidify their bearish positioning on the housing sector.
The machines that buy and sell off correlations were working furiously in the wake of Seaport’s downgrades. Given ITB lost 2.5%, the damage to the sector was naturally widespread. I am most intrigued by those stocks that best out-performed on a relative basis as potential resilient buys and the stocks which dropped a lot more than ITB as potential buys at steep discounts later in the year.
- Tri Pointe Group (TPH): -0.6% and just off a 15-month high.
- M/i Homes (MHO): -1.8% and just off a 13 1/2 year high. I recently added MHO to my universe of home builders.
- Century Communities (CCS): -2.9% and recently increased earnings guidance. I am trying to hold onto this stock based on what I read in the last earnings report (I will post about the company’s earnings soon).
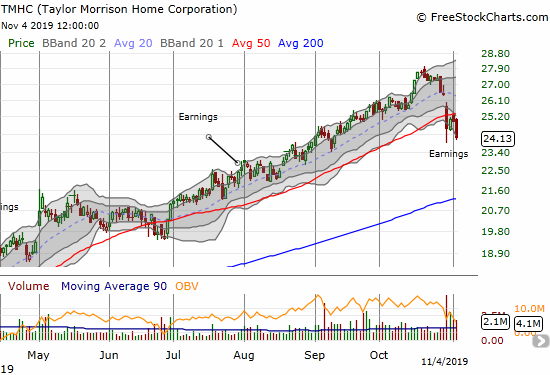
- Taylor Morrison Homes (TMHC): -3.3% and a stock in which I was “forced” to preserve profits (see chart below).
- D.R. Horton (DHI): -4.0% and one of the expensive builders at 2.0 price/book.
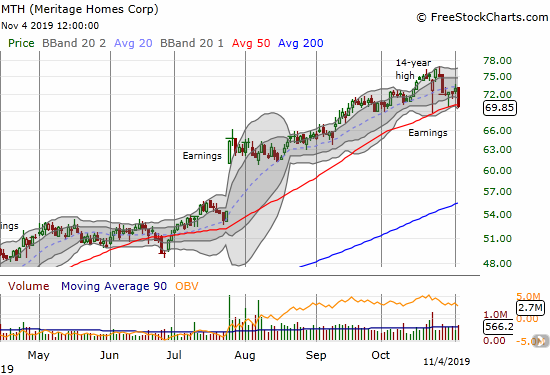
- Meritage Homes (MTH): -4.2%.
- LGI Homes (LGIH): -5.0% and trading at a near 3-month low after selling started 4 days ahead of the peak in ITB.
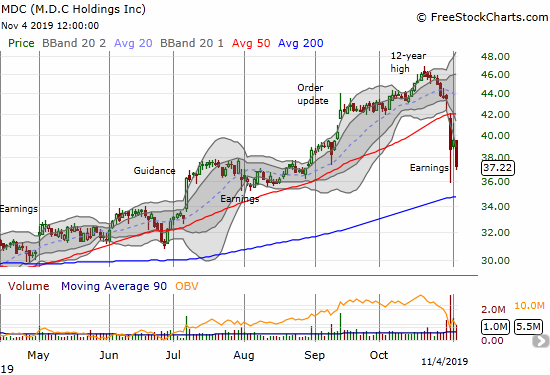
- M.D.C Holdings (MDC): -5.9% and a stock I bought into the selling given what I learned from reading the transcript of the earnings call (more to come later). Also see the chart below.
An Important Transition
In my last Housing Market Review, I recognized that the housing market data appeared to finally catch up with the rally in home builder stocks. I conceded that this year likely features another twist on the seasonally strong period with investors front-running the October/November launch by several months. I fully recognize the deep irony of a potential topping in these stocks at this juncture. Still, I have learned to follow home builders where my analysis leads. Until I see definitive cracks in the data, I will proceed with my annual strategy of buying dips in these stocks in the October to April/May period (conditional on some context).
The ultimate direction of the transition for this sector depends on the true underlying health of the housing market. In the months leading into this transition, I expressed hesitation about cracks I did see in the data. The market just kept chugging along. However, note carefully that even with the Federal Reserve back into an aggressively accommodative stance for monetary policy and mortgage rates significantly lower than a year ago, all the major points of housing data – housing starts, existing home sales, and new home sales – are just now drifting their way back to last year’s levels. Even the sentiment of builders has only recovered the ground it lost from last year’s major peak, and the regional distribution is surprisingly uneven.
In other words, while I am plowing forward on the standard strategy, I am picking my spots very carefully. I cannot be aggressively bullish. I remain wary of the housing data and the parallel earnings reports from builders.
The entire industry is seemingly pivoting to the lower price tiers of the market where demand is most robust given on-going affordability issues. The South is a leading region for these sales. Can these buyers support a strong transition for the entire industry? On a related note, will these buyers continue to ignore risks looming in the economy? Last year taught everyone in the industry that affordability issues have made buyers extremely sensitive to price signals; many builders were caught completely by surprise after assuming that rates were already so low that small increases would seem immaterial. Now the industry is banking on a historically strong labor market continuing into the horizon. Will buyers beat a hasty retreat if/once the employment news finally starts to sour?
New Residential Construction (Single-Family Housing Starts) – September, 2019
After a sudden burst of activity to start the year, housing starts cooled from February to June, 2019. July and August delivered a notable pick-up and the rebound has continued slowly but surely from there.
Single-family housing starts for August were revised slightly downard from 919,000 to 915,000. September starts increased month-over-month by 0.3% to 919,000. On an annual basis, single-family housing starts increased by 4.3%. From October, 2018 to May, 2019, the year-over-year percentage gains were negative except for January’s 9.4% gain. The last four months have delivered low single-digit year-over-year gains; these increases make sense given the big slowdown in housing market activity a year ago.
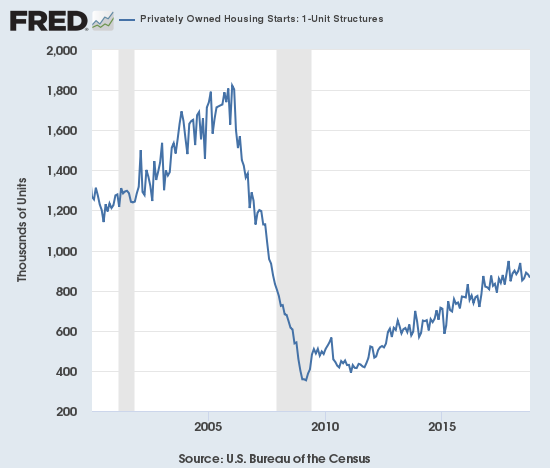
Source: US. Bureau of the Census, Privately Owned Housing Starts: 1-Unit Structures [HOUST1F], retrieved from FRED, Federal Reserve Bank of St. Louis, November 4, 2019.
On a regional basis, the changes were very mixed and broadly distributed. The Northeast finally ended four straight months of year-over-year losses, but the West plunged once again. The Northeast, Midwest, South, and West each changed +3.4%, -5.4%, +17.4%, and -14.3% respectively. The prior stabilization in the West helped dissuade me from my now aged thesis of a sales slowdown at the end of 2019. I would be back on alert, but I understand the apparent and sharp shift of starts from the West to the South to follow the trend pursuing lower-priced, more affordable housing.
Existing Home Sales – September, 2019
The 16-month streak of year-over-year declines for existing home sales came to an end, just barely, in July. I clung to the notion of an on-going downtrend since last year. August’s increase over the February, 2019 surge finally ended that downtrend even with the sequential decline in September. This juncture is still important as a potential turning point where the housing data finally catch up with the rally in housing related stocks. I still reluctantly acknowledge an end to the downtrend: not only was the path here so slow, incremental, and unconvincing, but also now investors are so readily selling the stocks of home builders without any adverse change in the data or trends.
The seasonally adjusted annualized sales in September of 5.38M were down 2.2% month-over-month from the effectively unrevised 5.50M in sales for August. Year-over-year sales increased 3.8%. The non-revision leaves August as the highest point for existing home sales in 2019.

(As of the March, 2018 data, the NAR further reduced historical data to just 13 months. For historical data from 1999 to 2014, click here. For historical data from 2014 to 2018, click here) Source for chart: National Association of Realtors, Existing Home Sales© [EXHOSLUSM495S], retrieved from FRED, Federal Reserve Bank of St. Louis, November 4, 2019.

In June, the National Association of Realtors (NAR) admitted to a bit of astonishment (or bewilderment?) at market dynamics even as sales finally broke their 16-month year-over-year losing streak. Given earlier market concerns, I expected the NAR to celebrate a new high for 2019 in existing home sales. Surprisingly, the NAR failed to reference the milestone. The NAR turned from August’s concern with a Federal Reserve moving too slowly and back to inventory and affordability concerns. The NAR even acknowledged its broken record on this score:
“Lawrence Yun, NAR’s chief economist, said that despite historically low mortgage rates, sales have not commensurately increased, in part due to a low level of new housing options. ‘We must continue to beat the drum for more inventory,’ said Yun, who has called for additional home construction for over a year. ‘Home prices are rising too rapidly because of the housing shortage, and this lack of inventory is preventing home sales growth potential.’
The median price of an existing home hit $272,200, a year-over increase of 5.9% and the 91st straight year-over-year gain. This relentless ascent in price has not changed much whether inventories happen to drop or gain in any given month. However, sequentially prices dropped for the third month in a row. If a changing mix toward lower-priced homes is driving the short-term trend, perhaps by the first half of 2020, the streak of year-over-year gains will finally end.
Absolute inventory levels of 1.83M homes declined 1.6% from the 1.86M homes for sale in July and down 2.6% year-over-year. Based on months of supply, inventory also declined: “Unsold inventory is at a 4.1-month supply at the current sales pace, up from 4.0 months in August and down from the 4.4-month figure recorded in September 2018.”
After impressive year-over-year share gains in March and June, July’s share of first-time home buyers dropped to 32%. August’s share dropped another percentage point. The share rebounded to 33% in September, up 2 percentage points year-over-year. This shift in share is now consistent with the reports from homebuilders and the sequential decline in median home pricing. However, the current levels remain lower than averages from previous years. The average share for first-time homebuyers for 2016 was 35%. The NAR’s 2017 Profile of Home Buyers and Sellers reported an average of 34% for 2017 and 33% for 2018.
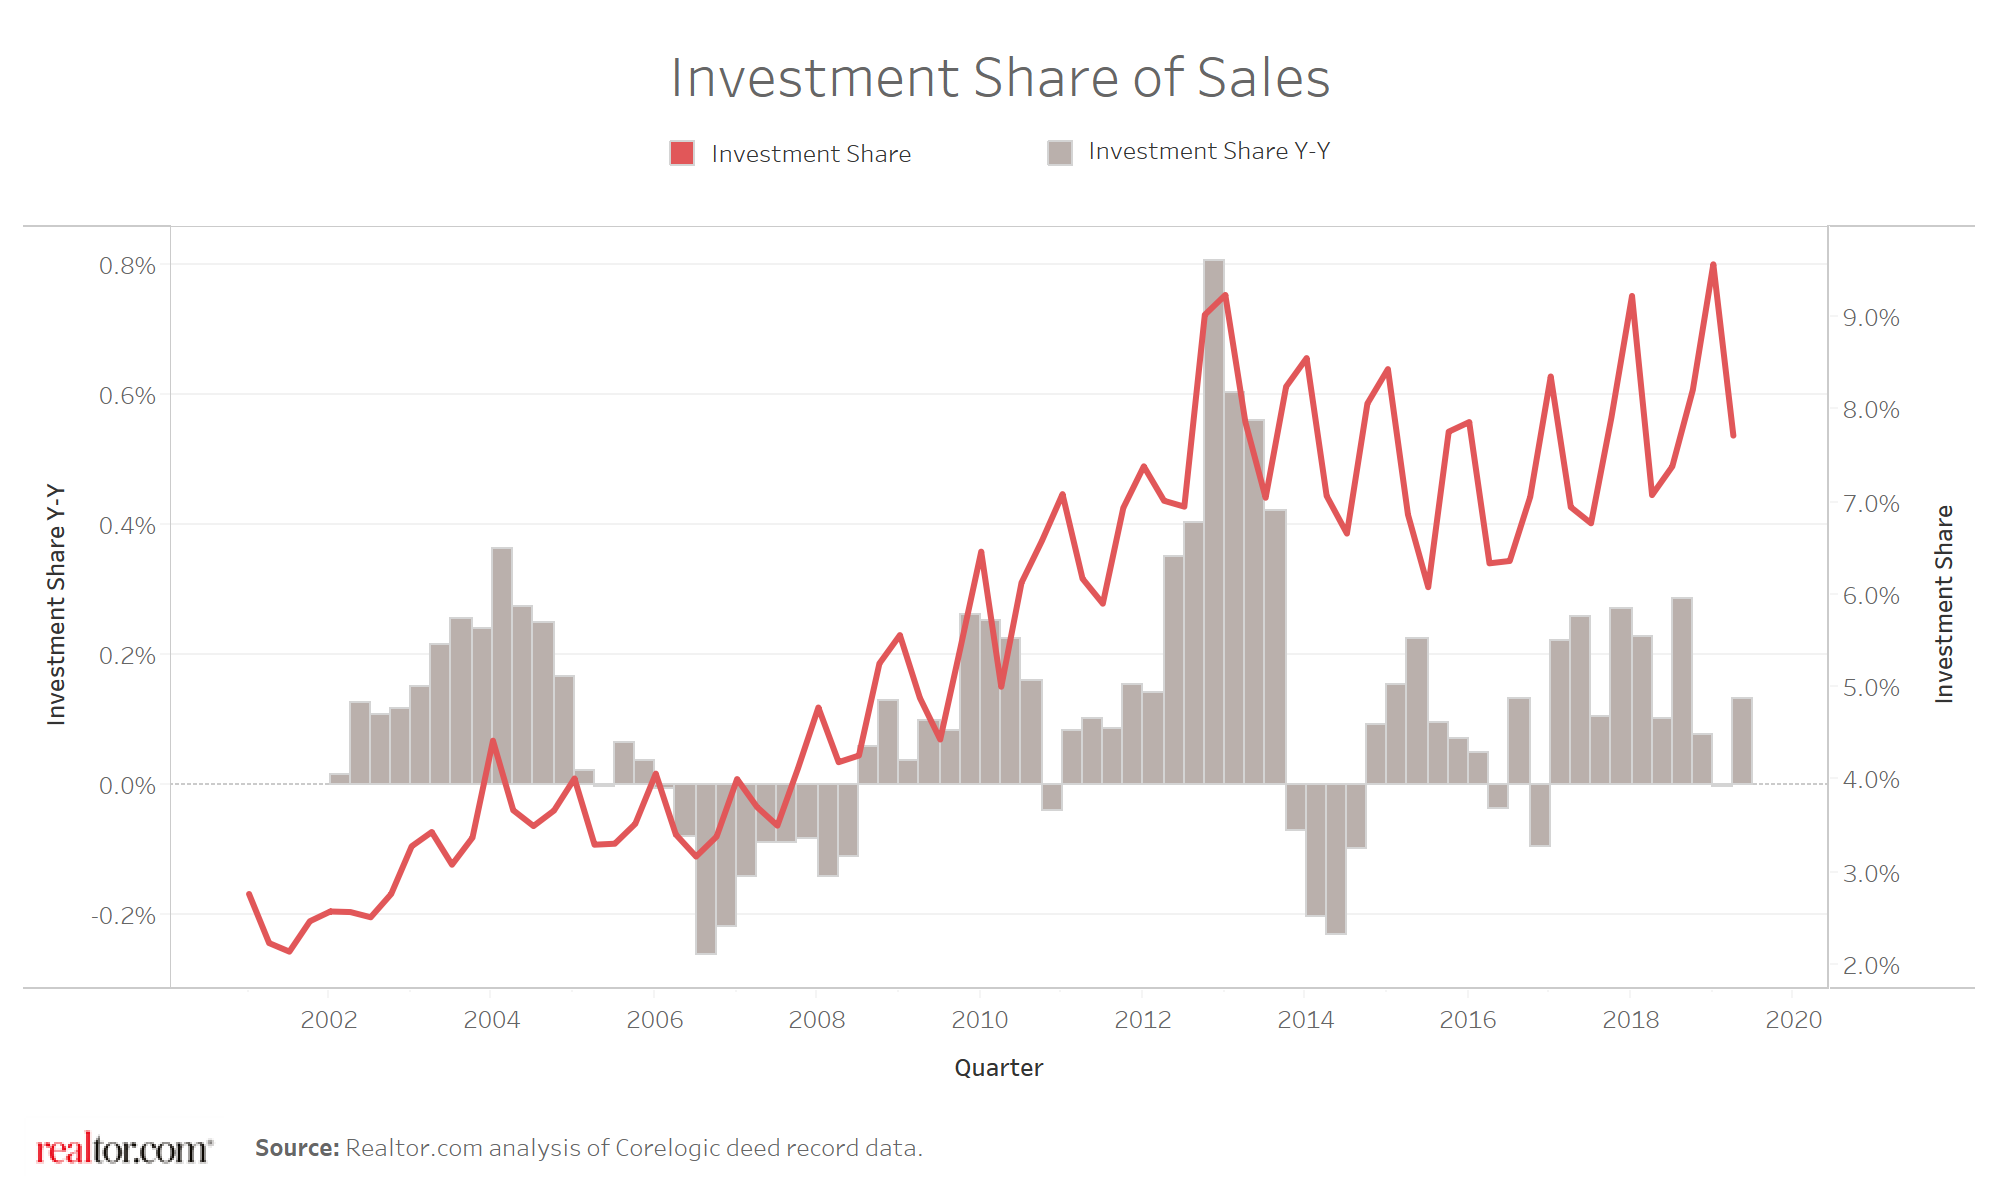
Investors purchased 14% of homes in September, flat with August but up notably from July’s 11%. Investors purchased 16% of homes a year ago. Investor sales averaged a share of 15% in 2017 and 14% in 2016. Given data availability, I will start reporting on the NAR’s overall measure of investor sales. The chart below shows a range of 7% to 9% since 2012. In other words, there are no fundamental changes to report. (I have an outstanding question to the economics team at the NAR to clarify the base of the data in the chart below).
The highlight for regional sales in August was the end of a 13-month streak of declines for year-over-year sales in the West. Only the Midwest failed to gain in September. Here are the regional changes: Northeast +1.5%, Midwest 0.0%, South +6.0%, West +5.6%.
There were no surprises in the regional year-over-year changes this time around; all regions experienced notable price jumps. Here are the regional year-over-year changes in median home prices: Northeast +5.2%, Midwest +7.2%, South +6.3%, West +4.5%.
Single-family sales decreased 2.6% from August and increased on a yearly basis by 3.9%. The median price of $275,100 was up a healthy 6.1% year-over-year, much higher than the tight 4.5% to 4.7% range from May to August.
California Existing Home Sales – September, 2019
The California Association of Realtors (CAR) reported sales of existing Californian homes at a 10-year low in January. July sales were at a 15-month high and the 1.1% year-over-year gain ended a 14-month losing streak. Year-over-year sales are now up three months straight although mostly flat sequentially over that same time. September sales were up 0.5% from August and up 5.8% year-over-year, the largest annual gain in 30-months.
February’s median price was the lowest in 12 months. The median price suddenly swung to record highs from June to August. September’s median price fell 1.9% from August and increased 4.7% year-over-year, the largest year-over-year price increase in 12 months. Two other notable data points for September:
- The San Francisco Bay Area has suffered year-over-year price drops for eight straight months and 9 of the last 10 months.
- The number of active listings dropped 11.8% year-over-year, the largest drop since December, 2017. Listings have also fallen for three months.
The CAR made an important observation that California existing home sales have shown no growth over the last 3 years. Surprisingly, the decline in mortgage rates from a year ago have not made Californian buyers more optimistic. CAR conducted a Google poll and found that the percentage of respondents who think it is a good time to buy a house only went from 21% last year to 22% this year. Selling sentiment went from 56% to 52%. This augurs poorly for Californian home sales in the near future.
New Residential Sales (Single-Family) – September 2019
The Census Bureau revised August sales of new single-family homes downward from 713,000 to 706,000. Revisions have somewhat stabilized since a series of big revisions over the summer. September sales decreased 0.7% from August but soared 15.5% year-over-year. While the air pocket I expected is not going to materialize in the year-over-year numbers given last year’s slowdown, a pause in buying interest may be appearing in the sequential numbers.
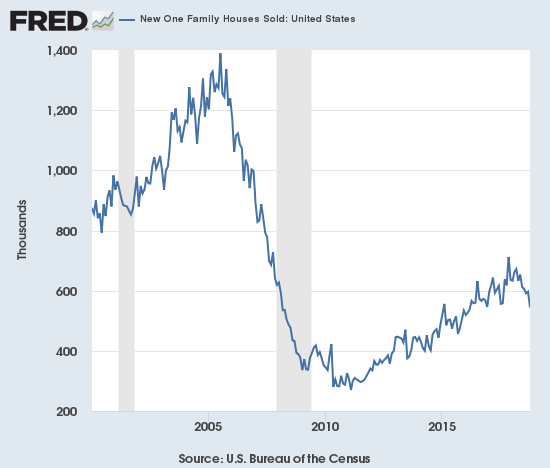
Source: US. Bureau of the Census, New One Family Houses Sold: United States [HSN1F], retrieved from FRED, Federal Reserve Bank of St. Louis, November 4, 2019.
Since hitting a post-recession peak in November and December, 2017, the median price of a new single-family home has trended downward based on a series of new lows. July’s median price matched January’s $305,400 which was a 2-year low. The median price rebounded in August but declined in September to $299,400. This healthy 7.9% pullback dropped the median price to a level unseen since February, 2017. The average price of $362,700 is just a 4-month low. The shift to lower-priced homes can be seen most clearly in the percentage of homes priced dropping from $400,000 to $499,999 from 14% to 8% and all the lower tiers gaining in share. The August price surge now looks quite anomalous instead of a potential sign of exhaustion by lower-end buyers.
Ever since the inventory of new homes for sale jumped to 6.0 months of sales in June, 2018, inventory has pivoted around that 6.0 level. Last June’s inventory sat at 6.3 days of sales. July increased ever so slightly to 6.4. However, sales in August were high enough to send inventory plunging back to 5.5 days of sales where they stayed for September.
The Northeast sales numbers continued their volatility. After a 47% drop in June, sales soared 36.0% year-over-year in July and 12.5% in August (revised significantly). September sales in the Northeast surged 29.6% year-over-year. The Midwest fell a second month in a row, this time by 17.3%. The South soared 24.0%. The West increased 11.5%.
Home Builder Confidence: The Housing Market Index – October, 2019
The Housing Market Index (HMI) is streaking higher. The HMI hit a 20-month high in October at 71. This index was last this high coming off the soaring optimism that closed out 2017 and launched 2018. The 15-point gain since the December, 2018 trough is quite a remarkable run-up. The National Association of Home Builders (NAHB) kept its commentary very brief by attributing the confidence to the standard combination of low mortgage rates and a strong job market.
Strangely, the NAHB combined declining inventory as a positive catalyst with supply-side constraints as a negative. A reference to concerns about a slowing economy do not show up at all in these data. In particular, the two 6-month forward looking indicators both far out-paced the present-anchored indicator. I assume the reference to concerns of a slowing economy is a lingering reference to the concerns about how the U.S. vs Chine Trade War has hurt the economies of the U.S.’s manufacturing centers.
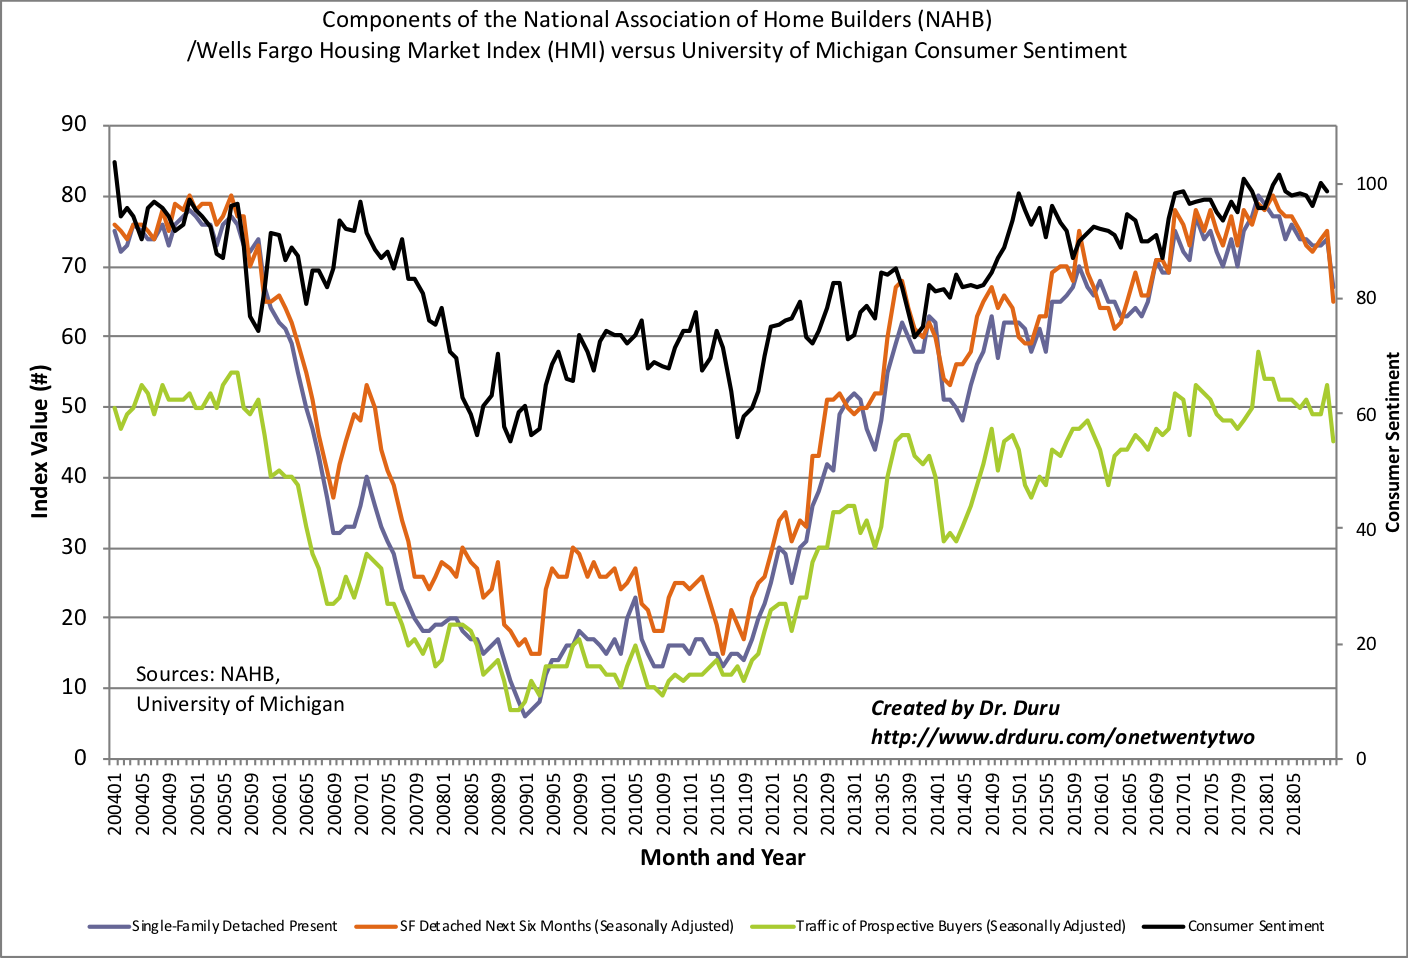
Source: NAHB
The regional results were a bit of a head-scratcher and may contain the seeds of an imminent topping in sentiment. The Northeast and the Midwest actually retreated 4 points and 1 point respectively. The South jumped three points to a level last seen October, 2005. That year held the record of 77; how much higher can sentiment realistically go from here (the NAHB does not provide earlier regional data) in this hub of affordable homes? The West soared from 76 to 83. The west’s HMI was last this high January, 2018. The West has hit into the 80s several times since 2016. The soaring confidence in the West is completely out of sync with September’s large drop in housing starts. Something has to give and/or confirm.
Parting thoughts
Foot Traffic Data
The National Association of Realtors pointed to the open rates of SentriLock key boxes as a determinant of “growing buyer interest.” This claim took me by surprise as I do not think I have seen it referenced in the existing home sales report before. It turns out that the NAR actively uses such data for its monthly report on foot traffic. September’s report explains the value of the data:
“Every month SentriLock, LLC. provides NAR Research with data on the number of properties shown by a REALTOR®. Lockboxes made by SentriLock, LLC. are used in roughly a third of home showings across the nation. Foot traffic has a strong correlation with future contracts and home sales, so it can be viewed as a peek ahead at sales trends two to three months into the future. This infographic shows the latest index data along with trends and changes.”
Affordability issues at the high-end
I heard a news story that referenced an 8-month old study from ApartmentList titled “Rich and Renting: Understanding the Surge of High-Earning Renters.” The research included the surprising statistic that the growth in renters has been largest at the higher-end of income:
“While high-income renters are surging, renting as a whole is also on the rise. Over the past decade, the nation’s renter population has grown by 15 percent, with increases at all levels of income. High-earners have grown 48 percent, renters earning $50-100k have grown 18 percent, and renters earning <$50k have grown 8 percent…
Denver and Austin lead the nation in high-income renter growth. These metros housed nearly 2.5 times more six-figure renter households in 2017 than they did in 2008. Other high-growth metros include mid-size, growing cities that attract transplants with their mix of strong economies and relatively low rents…”
Of course, the higher-end likely has more room to grow. These data are great context for the increase in demand for homes from first-time home buyers who presumably are current renters. Have lower-income earners reached peak rental levels? Will high-earning renters present the next big pool of demand in future years?
Property Hoarding in Silicon Valley
Who owns Silicon Valley? This is the question posed by a variety of media companies who collaborated on a year-long project to expose the impact of concentrated wealth on affordability in Santa Clara County in the San Francisco Bay Area. Stanford University, Apple (AAPL), and Google (GOOG) are scrutinized as top three landowners. Some of the material for the reporting comes from the travails of the residents of Collage Terrace who complain about Stanford buying up properties in their small city and sending prices sky high.
The overall reporting is in-depth. I hope to finish reviewing it by the next Housing Market Review, so I can offer my own opinion. In the meantime, I highly encourage readers to check it out. A sample below:
Be careful out there!
Full disclosure: long ITB call spread, long CCS, long MDC calls and shares, long AAPL call spread, long GOOG calendar call spread