
AT40 = 42.1% of stocks are trading above their respective 40-day moving averages (DMAs)
AT200 = 46.4% of stocks are trading above their respective 200DMAs
VIX = 16.0
Short-term Trading Call: neutral
Stock Market Commentary
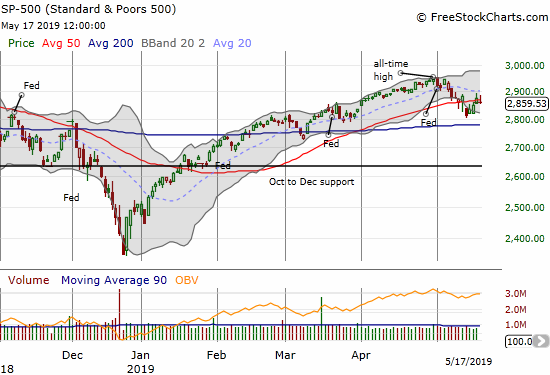
A day after the major indices flipped from bullish support to bearish resistance, buyers rallied these indices through resistance. It was a tenuous victory given the fade from the day’s highs. On Friday, the stock market opened with a gap down below support, and sellers were able to quash a fresh rally attempt. The end result is a stock market that closed the week in bearish position. Yet it is unclear whether sellers actually have the upper hand given the distinct recovery from Monday’s gap lower.
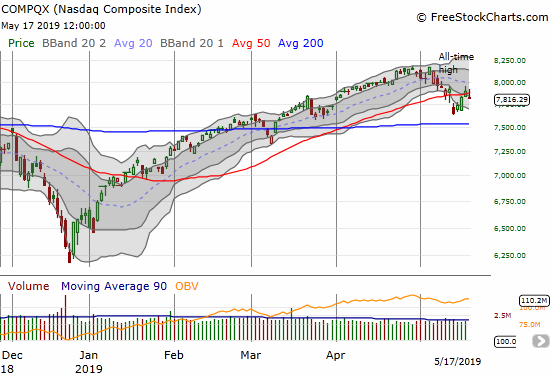
The NASDAQ (NDX) looks more ready to reverse the rally from Monday’s gap down: the tech-laden index completely reversed Thursday’s gains and then some.
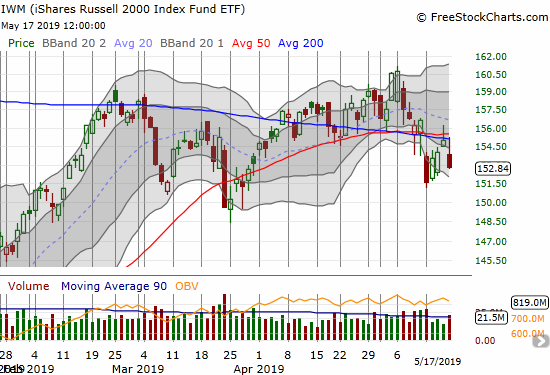
The latest breakdown of the iShares Russell 2000 ETF (IWM) looks much more serious than the 50DMA slips of the S&P 500 and the NASDAQ. IWM never closed over its 50 or 200 DMAs. The small cap index faded notably from intraday highs both Thursday and Friday. IWM essentially confirmed resistance at its moving averages. I took a chance on riding my IWM call options into Friday’s expiration given the 3-day rally from Monday’s low. The gap down and 1.4% loss wiped out that position. I did not renew it, and there is little point in trading IWM from the long side until it can overcome resistance (or of course it hits some oversold level).
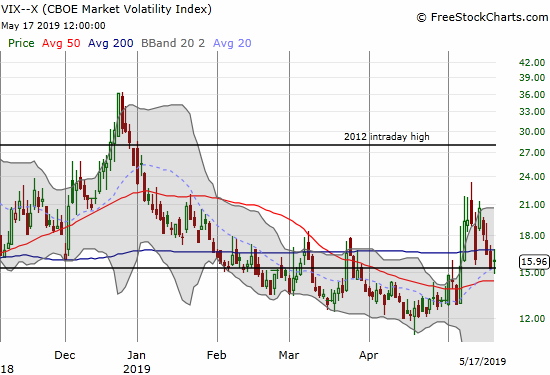
The volatility index (VIX) imploded for three straight days after Monday’s surge. The volatility faders hit a wall on Friday as the VIX bounced back from a breach of its 15.35 pivot. I ended the week with put options on Ultra VIX Short-Term Futures ETF (UVXY). I decided to focus on fading volatility spikes as a hedge against my on-going short positions. I was very tempted to buy calls given the VIX looks ready for a fresh spike higher.
AT40 (T2108), the percentage of stocks trading above their respective 40DMAs, closed on Monday at a 4-month low and traded as low as 32.9%. The rebound from that low is characteristic of bull markets where the 30%s is “low enough” to act as oversold; at that point a lot of stocks look attractive to bargain hunters and dip buyers. AT40 closed the week at 42.1% and is likely headed right back to the 30%s this week given the technical picture on the indices.
The Trade War
Trade war headlines dominated the action in the stock market last week. China ratcheted up its rhetoric and actions in defiance of the U.S., and the U.S. continued to provide reassurances while at the same time increasing the penalties on China for refusing to cooperate. It is a wonder there are still so many who seem to have confidence that the trade war will find a resolution any time soon. Apparently farmers believed the trade war was winding down last week until President Trump’s Sunday tweets announcing tariff hikes.
In the wake of the trade war escalation, Marketplace produced a segment on May 10th called “Farmers hoped for a trade deal. Instead, tariffs went up“. The interview featured Brian Duncan, Vice President of the Illinois Farm Bureau. He expressed earlier hopes that the trade war was coming to an end. Referring to farmers in general, Duncan lamented “we needed a win.” He described dairy farmers who are going under and grain farmers who are buckling under the pressures of the trade war. He further stressed “everyone is very nervous…we are in desperate need.”
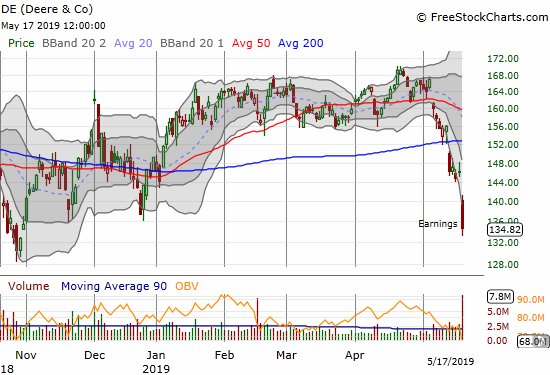
That segment alone should have alerted me to go short Deere & Company (DE) ahead of Friday’s earnings report. The stock broke down further in the wake of the bad news. From the Seeking Alpha transcript of Friday morning’s conference call (emphasis mine):
“…U.S. principle crop cash receipts, an important indicator for equipment demand. 2019 principle crop cash receipts are estimated to be roughly $117 billion, a decline of 4% since last quarter, reflecting recent pressure on commodity prices resulting from rising stocks, diminished market access and near term demand uncertainty. The confluence of these factors compounded further by U.S. late planting seasons have adversely affected farmer sentiment in recent weeks.
As a result, further trade progress between the U.S. and China is becoming increasingly important to the near term sentiment.”
Stock Chart Reviews – Bearish
Baidu (BIDU)
Over the past several months, I have described various long call positions in Baidu (BIDU). Friday’s nasty post-earnings reaction finally cured me of my interest even with the stock likely to rebound back to its lower Bollinger Band (BB) in the short-term. The 16.5% drop made me step back and review the longer-term chart. If I had noticed the double-top, I would have taken the persistent decline in BIDU more seriously!
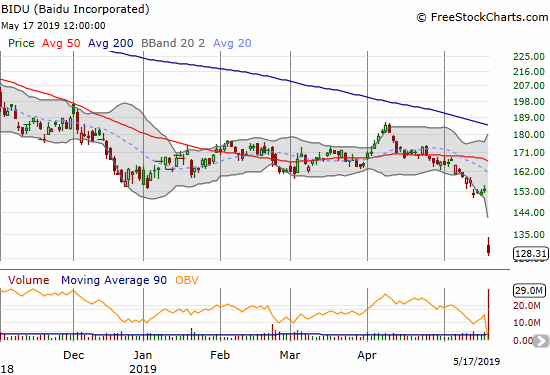
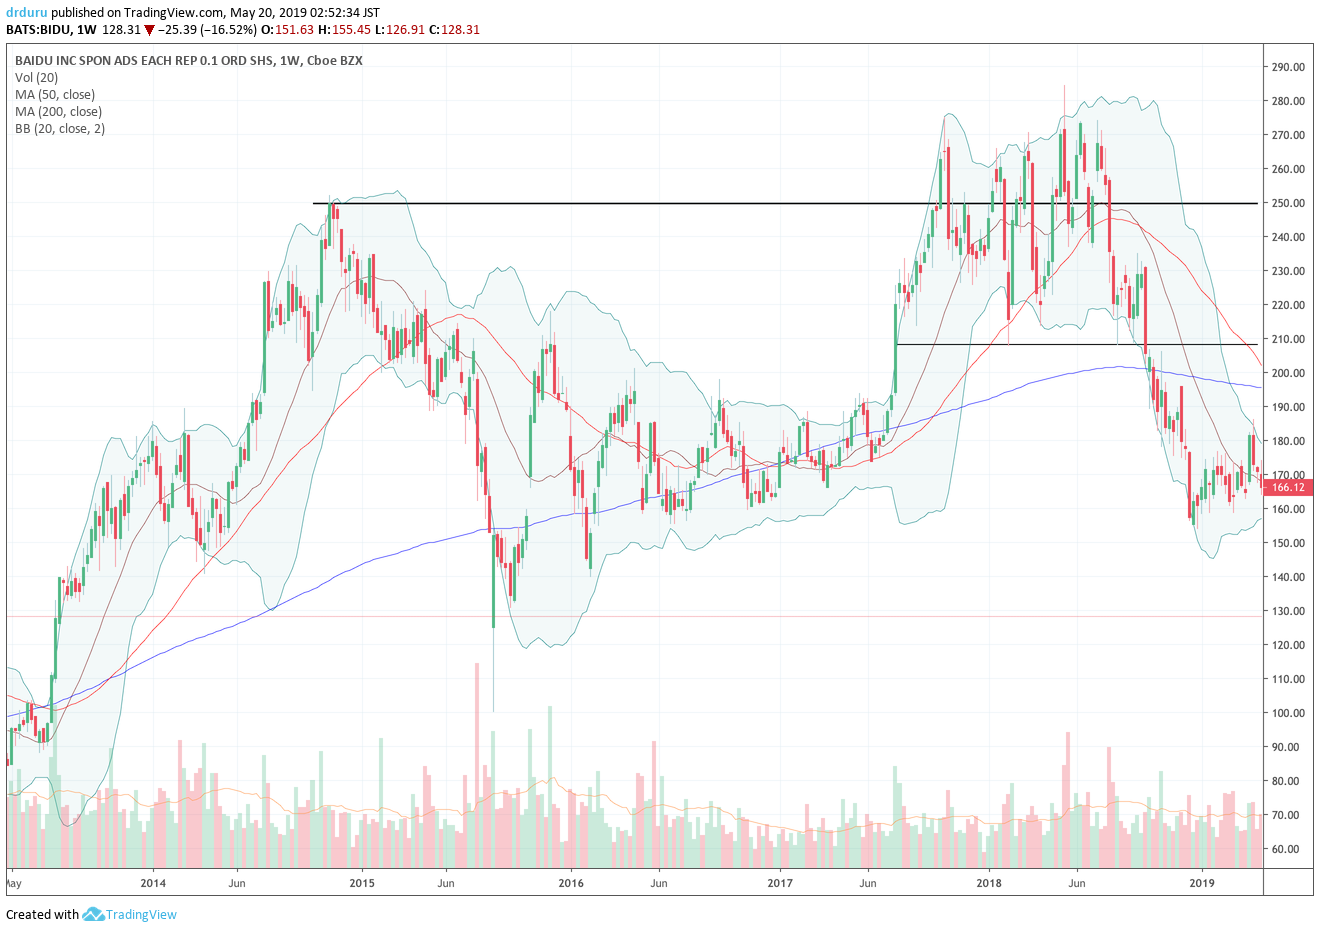
Source: TradingView
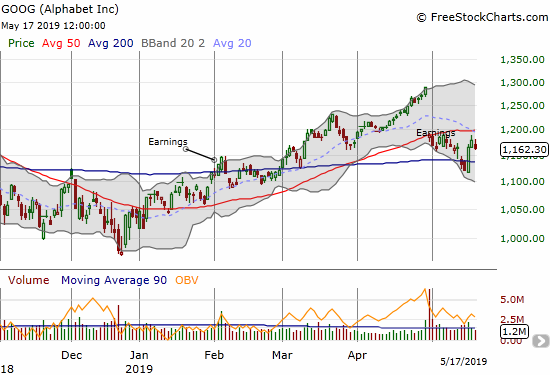
Alphabet (GOOG)
Alphabet (GOOG) pulled off a rapid and sharp comeback from a bearish 200DMA breakdown. I still think the stock is bearish given it faded from 50DMA resistance and its post-earnings high before losing 1.4% on Friday.
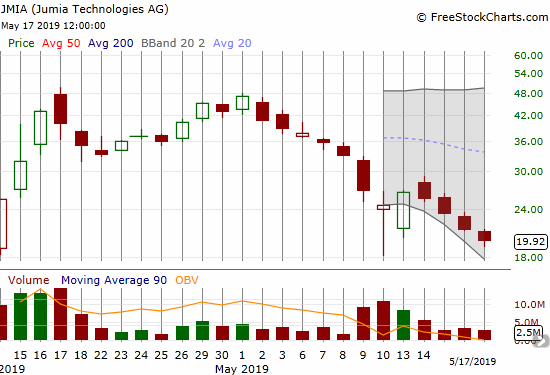
Jumia (JMIA)
While I am (long-term) bullish on Jumia (JMIA), the technicals are bearish. The stock is struggling to shake off the pressure from (in)famous short-seller Citron. Citron’s apocalyptic commentary on JMIA likely resonates with an American investor and trading base that knows little about a German-based company that provides services in Africa. I have used JMIA for food-delivery in Ghana, and I have friends and family who stand by the company’s viability. Either the selling has created an historic buying opportunity for me, or it has created epic fool’s gold!
JMIA has closed with a loss almost every single day in May.
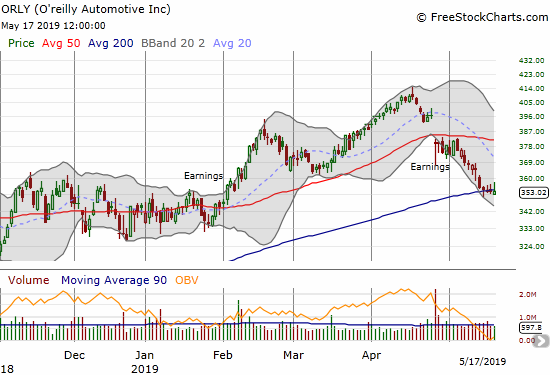
O’reilly Automotive (ORLY)
O’reilly Automotive (ORLY) is struggling to hold onto 200DMA support. I sold my position in ORLY based on the post-earnings 50DMA gap down. At the time, I described the risk of a test of 200DMA support. Now I see just as great a risk of a complete 200DMA breakdown. I am not sure yet at what level I might get interested in buying ORLY back.
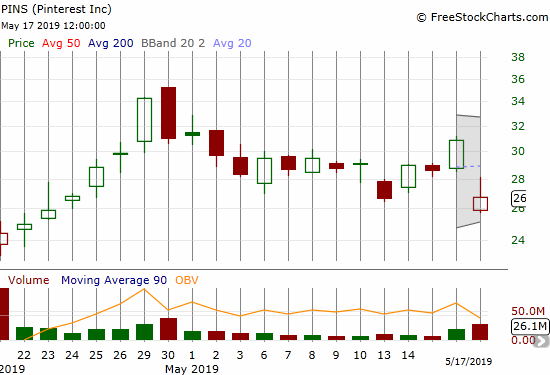
Pinterest (PINS)
Pinterest (PINS) was an IPO darling by virtue of its persistent rally from its opening day. While the stock dramatically peaked in late April, I still saw a bullish setup earlier in the month. A 13.5% post-earnings gap down is all it took to flip the stock into the bearish camp. The stock is a short on a fresh post-earnings low. The stock is a buy on a close above Friday’s post-earnings intraday high.
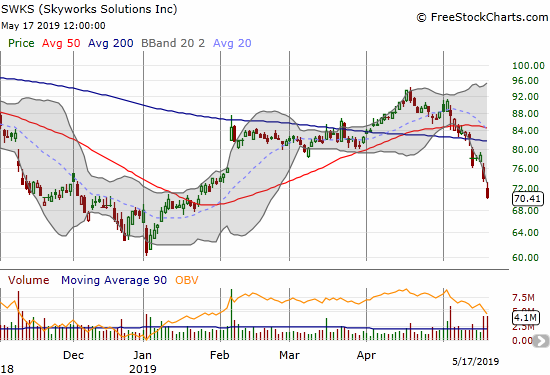
Skyworks Solutions (SWKS)
While Skyworks Solutions (SWKS) was ostensibly hit by Thursday’s news of the U.S.’s move to block high-tech sales to Huawei, the stock was already in a bearish position thanks to a 50DMA breakdown that began the week. The stock has struggled since trading down post-earnings on May 3rd.
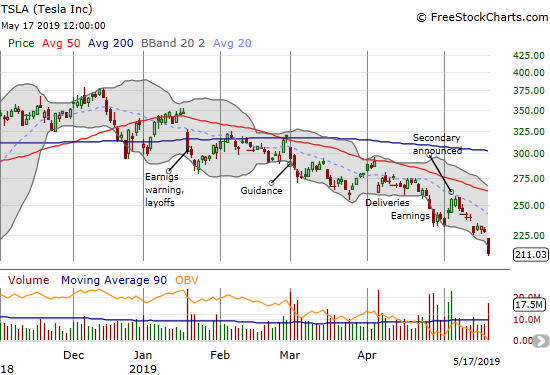
Tesla (TSLA)
My put options carried over from a calendar put spread had a May 17, 2019 expiration. On-going weakness since the announcement of a stock secondary convinced me to hold the put as long as possible. On the heels of news of fresh and significant (desperate?) cost-cutting efforts, the stock closed at a 2 1/2 year low on Friday’s gap down and 7.6% loss; my put option closed at my target profit…which turned out to be 9 points too conservative.
The latest shellacking made me take a second look at my trading strategies for TSLA. The scenarios for the stock are now very simple: the break of $250 support from a 2-year trading range means the most salient feature of TSLA’s stock is the 2019 downtrend well defined by the descents of the 20 and 50 DMAs. There is no sustainable bullish scenario for TSLA until the stock can crack this downtrend. Of course in the coming week TSLA will likely bounce/float higher as buyers have habitually bought quickly into TSLA bad news. The worst news for TSLA right now: long-time shareholder T. Rowe Price has largely abandoned its position. The fund manager dumped 81% of its 8.1M shares over the first three months of this year – no wonder the stock has suffered persistent pressure! (And anyone want to guess whether major TSLA short-sellers learned about T. Rowe Price’s selling program? Another reminder of how technicals can tell the story that otherwise remains hidden.)
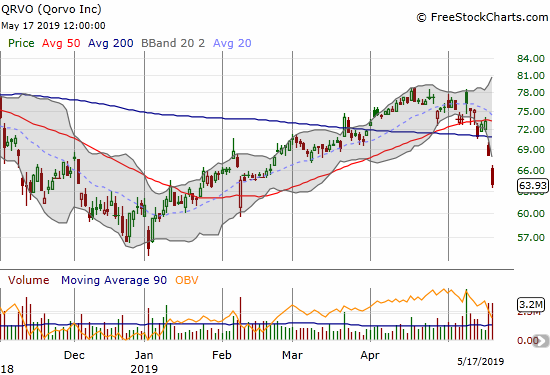
Qorvo (QRVO)
Like SWKS, Qorvo (QRVO) got into trouble ahead of the U.S. ban on tech sales to Huawei. QRVO started the week with a 50DMA breakdown and never recovered. The post-Huawei selling continued on Friday with another gap down and a 6.1% loss on Friday.
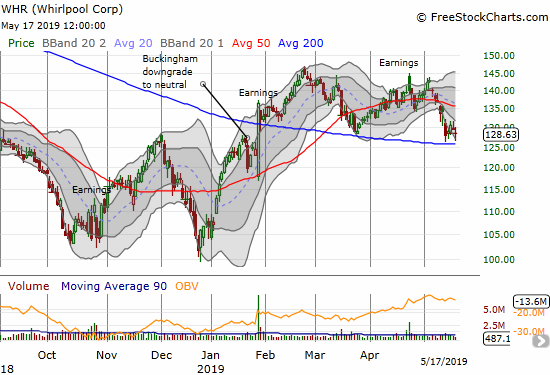
Whirlpool (WHR)
Whirlpool (WHR) is holding support at its 200DMA, but I consider the chart bearish because of the post-earnings loss of 50DMA support. I do not expect the 200DMA support to hold much longer given the refreshed trade tensions between the U.S. and China.
Stock Chart Reviews – Bullish
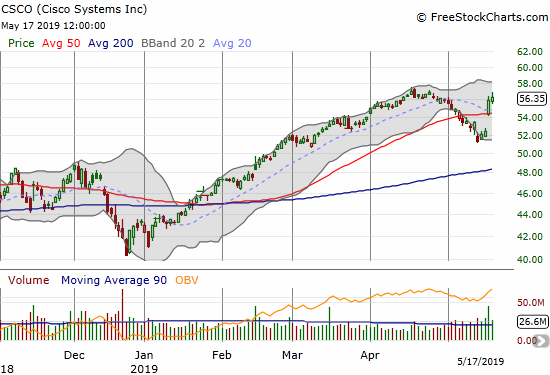
Cisco (CSCO)
Cisco (CSCO) bolted higher after reporting earnings. The momentum even helped CSCO buck the trend on Friday with fractional progress toward challenging its near 19-year high. Likely helping CSCO is news from the conference call that the company has greatly reduced its China footprint for its supply chain.
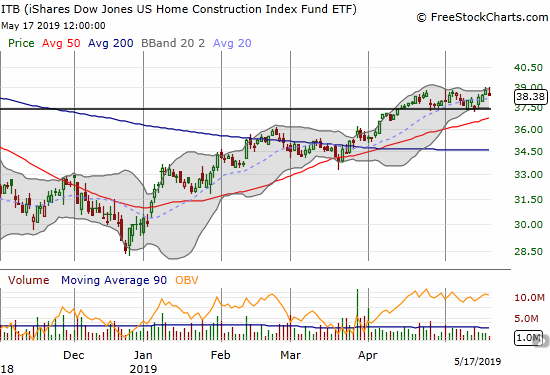
iShares Dow Jones US Home Construction Index (ITB)
The iShares Dow Jones US Home Construction Index (ITB) is resisting the seasonal pattern of topping out in April. While ITB has not quite topped out, the index has also failed to break out to new highs. Even a test of uptrending 50DMA support might signal/confirm a triple top.
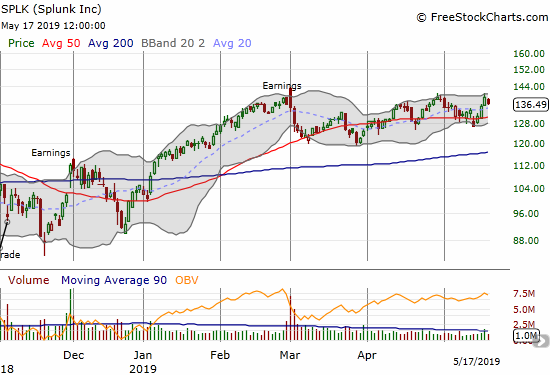
Splunk (SPLK)
Ever since a post-earnings gap and crap and bearish engulfing close on March 1, Splunk (SPLK) has churned its way to a slow but steady recovery. SPLK is pivoting around its 50DMA making higher highs and higher lows. The move includes two new all-time highs. The recovery gets confirmation on a close above the post-earnings intraday high.
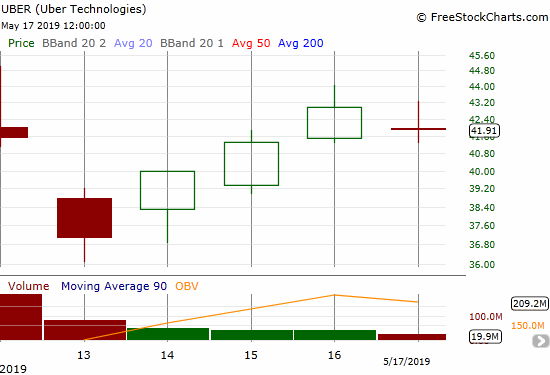
Uber (UBER)
I lowered my profit target on Uber (UBER) to just under the IPO price at $44. I figured $45 was just too obvious. Somehow, I was taken out right at the intraday high on Thursday. I now wait for the next significant dip to begin building a longer-term position starting with selling a put option.
U.S. Concrete (USCR)
I last covered an earnings report from U.S. Concrete (USCR) back in November. USCR is up about 33% since then. Even more impressive, or at least interesting, is the stock’s persistent uptrend all year. With April’s 200DMA breakout confirmed, the stock is positioned for buy-the-dip accumulation. The brief post-earnings volatility in the previous week was just such an opportunity.

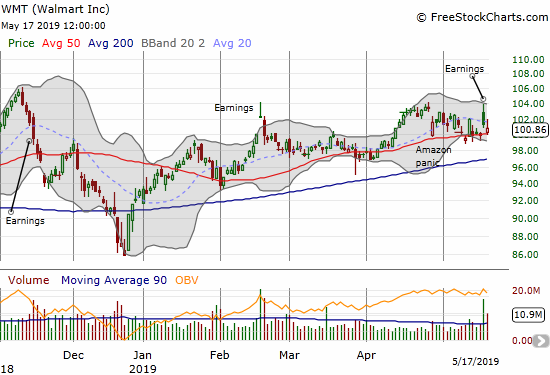
Walmart (WMT)
Walmart (WMT) is only bullish because it clung to its 50DMA support after a post-earnings headfake. The stock gapped higher only to fade to a small post-earnings gain. The reversal finished on Friday.
— – —
FOLLOW Dr. Duru’s commentary on financial markets via email, StockTwits, Twitter, and even Instagram!
“Above the 40” uses the percentage of stocks trading above their respective 40-day moving averages (DMAs) to assess the technical health of the stock market and to identify extremes in market sentiment that are likely to reverse. Abbreviated as AT40, Above the 40 is an alternative label for “T2108” which was created by Worden. Learn more about T2108 on my T2108 Resource Page. AT200, or T2107, measures the percentage of stocks trading above their respective 200DMAs.
Active AT40 (T2108) periods: Day #90 over 20%, Day #91 over 30%, Day #4 over 40% (overperiod), Day #9 under 50% (underperiod), Day #9 under 60%, Day #52 under 70%
Daily AT40 (T2108)
")
Black line: AT40 (T2108) (% measured on the right)
Red line: Overbought threshold (70%); Blue line: Oversold threshold (20%)
Weekly AT40 (T2108)

*All charts created using FreeStockCharts unless otherwise stated
The T2108 charts above are my LATEST updates independent of the date of this given AT40 post. For my latest AT40 post click here.
Related links:
The AT40 (T2108) Resource Page
You can follow real-time T2108 commentary on twitter using the #T2108 or #AT40 hashtags. T2108-related trades and other trades are occasionally posted on twitter using the #120trade hashtag.
Be careful out there!
Full disclosure: long UVXY puts, long JMIA, long USCR
*Charting notes: FreeStockCharts stock prices are not adjusted for dividends. TradingView.com charts for currencies use Tokyo time as the start of the forex trading day. FreeStockCharts currency charts are based on Eastern U.S. time to define the trading day.
Last time I was in a Walmart, my strong impression was that 80% of its products were made in China. So why is WMT seemingly unaffected by the trade war?
I would have to read the earnings transcript, but I seem to recall that they have been doing a good job in shifting their supply chain. This is an important question, so I have this on my investigation list!