
AT40 = 80.0% of stocks are trading above their respective 40-day moving averages (DMAs) (23rd overbought day)
AT200 = 45.5% of stocks are trading above their respective 200DMAs
VIX = 14.7
Short-term Trading Call: neutral
Stock Market Commentary
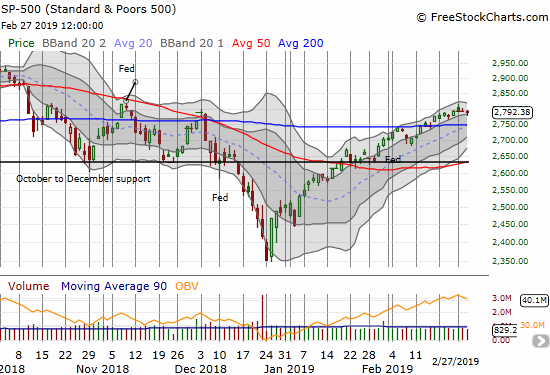
And still the waiting game rolls along. News on the US-China trade front generated some excitement to start the week, but, unsurprisingly, the buying quickly fizzled out (at the time I concluded that the stock market had a 50/50 chance of holding a gap up versus fading it). The S&P 500 (SPY) almost closed flat on that day. On Wednesday, the market delivered the reverse. Heavy headlines about damaging testimony from President Trump’s former personal lawyer started the stock market in a bad mood, but, as is common with these political headlines, buyers stepped right in. The S&P 500 (SPY) closed flat on the day and is essentially flat for the week. The daily moves are so small that the overall chart almost looks unremarkable…except the S&P 500 has a definite upward bias and trades above its 200DMA.
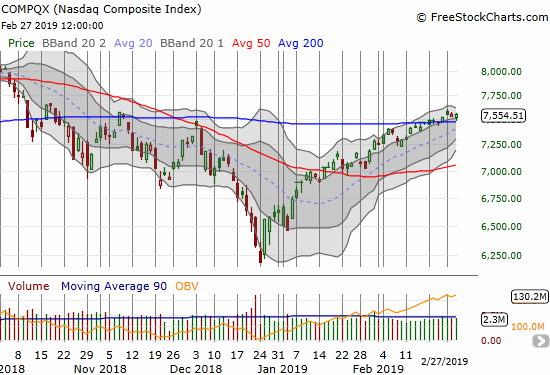
Like the S&P 500, the NASDAQ is essentially drifting above its 200DMA.
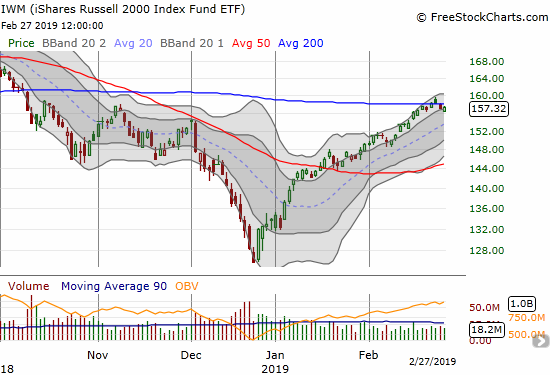
The iShares Russell 2000 ETF (IWM) took on enough of a drift to erase a brief 200DMA breakout. The index looks a bit vulnerable but the benign context of the market means there is little cause for alarm just yet.
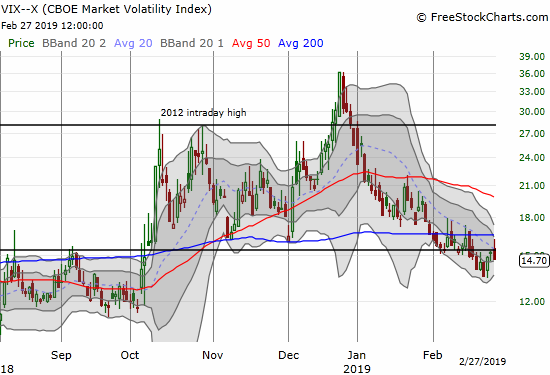
The volatility index, the VIX, highlights the generally benign context of the stock market. After popping above its 15.35 pivot, the VIX succumbed yet again to the volatility faders.
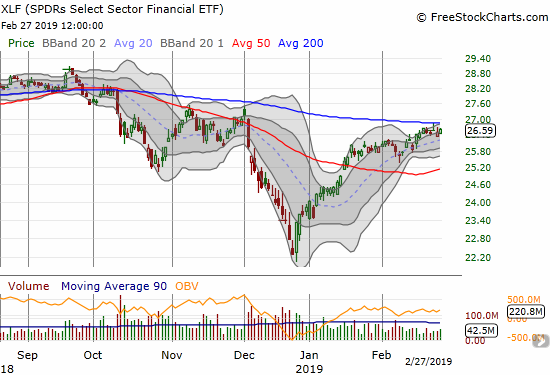
Even the on-going inability of the Financial Select Sector SPDR ETF (XLF) to break through 200DMA resistance does not look as ominous as it might otherwise without the benign trading environment.
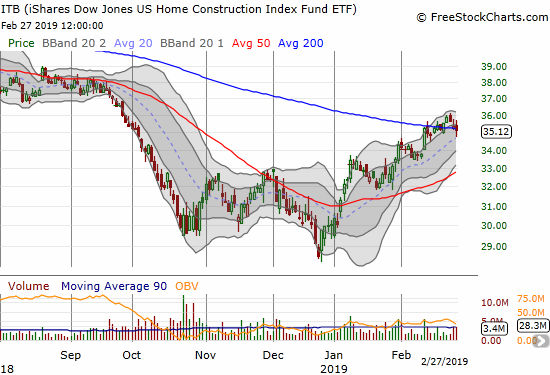
The iShares US Home Construction ETF (ITB) is also wrestling with its own 200DMA as enthusiasm waned a bit in the face of new earnings reports and housing data.
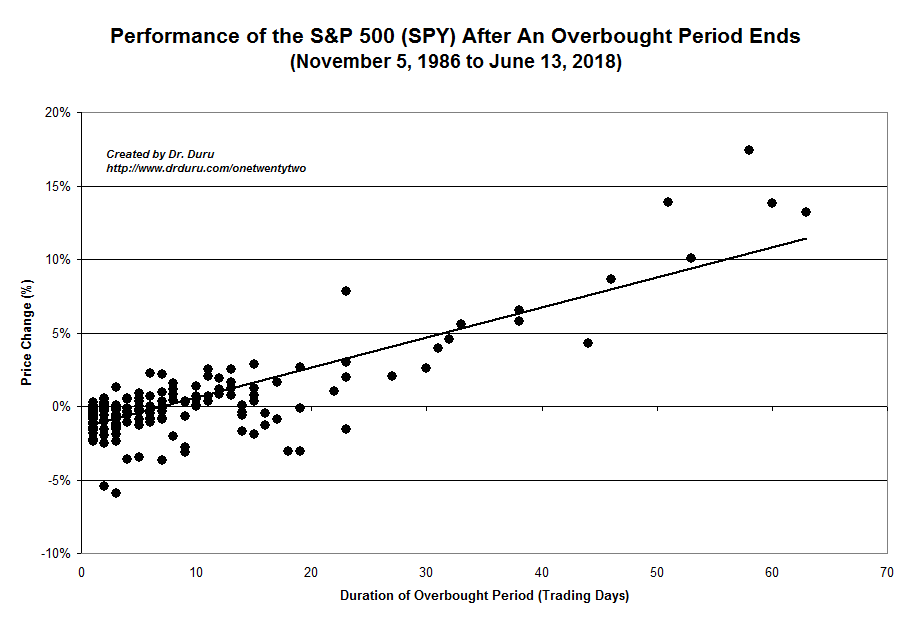
AT40 (T2108), the percentage of stocks trading above their respective 40-day moving averages (DMAs), also underlines the benign trading environment. AT40 is on day #23 of an overbought period and has managed to trade 12 days above 80%. There are only 14 other overbought periods which have lasted longer than this one (since 1986). Per the chart below, the S&P 500 should have an upward bias the longer the overbought period lasts. Note that the S&P 500’s 4.8% gain for this overbought period is slightly above the historical trendline for index performance versus the length of the overbought period. If the overbought period does not end in the next few days, I fully expect the S&P 500 rally to get a fresh wind upward.
My short-term trading call remains stuck in neutral. Now my trading call matches the languid nature of the indices.
Stock Chart Reviews
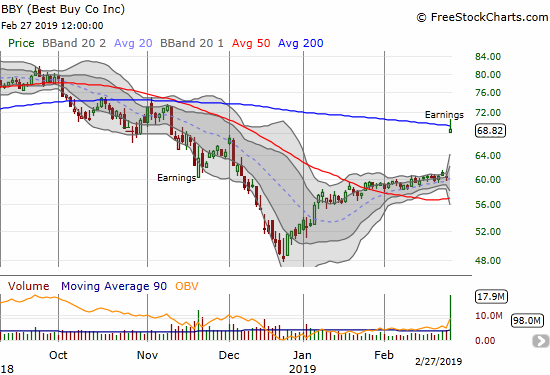
Best Buy (BBY)
In my last Above the 40 post, I laid out the case for making a bullish pre-earnings trade on Best Buy (BBY). The trade worked out with what had to be a best case scenario: a gap up right into 200DMA resistance. I took profits on the shares and of course expect the put spread to expire worthless.
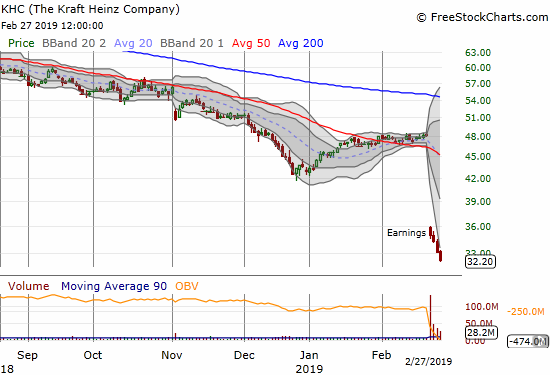
The Kraft Heinz Company (KHC)
Last week, Kraft Heinz Company (KHC) hit a major reset button that crashed the stock with a 1-day 27.5% post-earnings loss. The stock closed well below its lower Bollinger Band (BB) and tempted me to trade it for a bounce at least back to that technical marker. However, I stopped short because “…the downtrend in KHC has been persistent and panicked sellers may not quite be finished dumping the positions they have stubbornly held through that downtrend.” The selling pressure has yet to slow as I can only assume big institutional money is now systematically exiting the scene. The stock even keeps outracing the lower-BB downward.
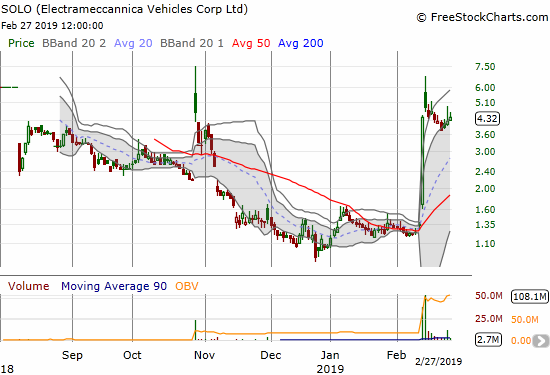
ElectraMeccanica Vehicles (SOLO)
Two weeks ago, I discussed ElectraMeccanica Vehicles (SOLO) and other competing manufacturers of electric vehicles. After listening to SOLO’s webcast that caused such a stir, I was convinced the company has a sufficiently solid narrative that could keep the stock aloft and gaining. However, I did not want to get in until the stock pulled back. A pullback ensued right after I posted my piece, and I finally jumped aboard on Tuesday with a small amount of shares. I am taking a very small risk so that I am able to sit through what will likely be more wild swings. Assuming the story does not deteriorate, I want to be a bigger buyer on a test of 50DMA support.
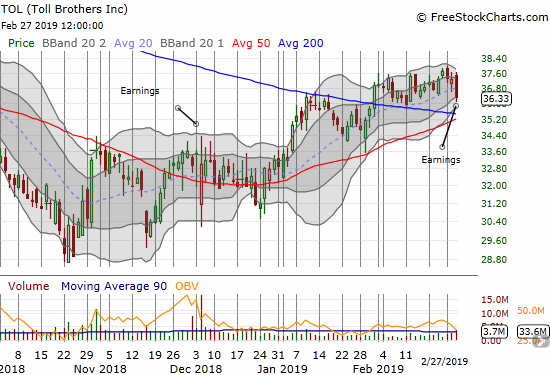
Toll Brothers (TOL)
Toll Brothers (TOL) failed to inspire investors after reporting earnings. I am watching the trading action for a very important test of converged 50 and 200DMA support.
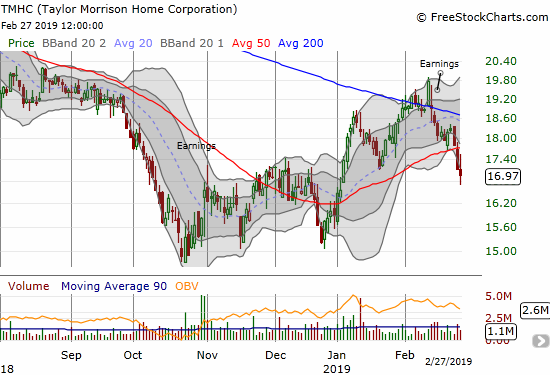
Taylor Morrison Homes Corporation (TMHC)
Taylor Morrison Homes Corporation (TMHC) is the biggest disappointment among the home builders I follow. I just started tracking TMHC closely last year. This month’s 200DMA breakout looked promising until earnings brought the excitement to a quick end. For more understanding, I read through the transcript from the earnings conference call. I think the lack of a new share buyback authorization disappointed investors. Starting in October and ending the week leading into earnings, TMHC spent $196M buying 11.7M shares for an average purchase price of $16.72/share. That buying surely helped keep the stock pushing higher over that time period. The post-earnings selling pressure may demonstrate the importance of buybacks for this stock.
While TMHC saw buyer activity re-awaken this year, I am not excited about the company’s recent purchase of a lower-end home builder. That purchase is likely to act like a weight on financials in addition to the stock price (without buybacks). TMHC is actually now back in bearish territory and off my buy list for now.
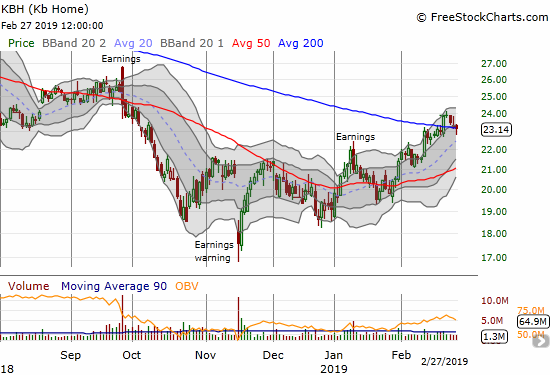
KB Home (KBH)
The renewed pressure on home builders pushed KB Home (KBH) back to 200DMA support before it could confirm its 200DMA breakout. I decided to go ahead and speculate on some April call options anyway.
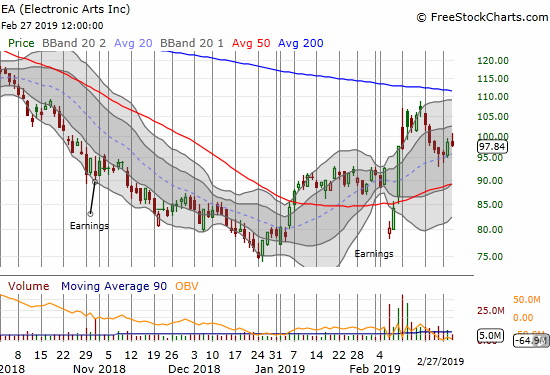
Electronic Arts (EA)
Electronic Arts (EA) is cooling off, and I am buying the dip. I am looking for 20DMA support to hold and re-energize the stock for a fresh challenge of 200DMA resistance. On further selling, I am looking to add to positions on a test of 50DMA support.
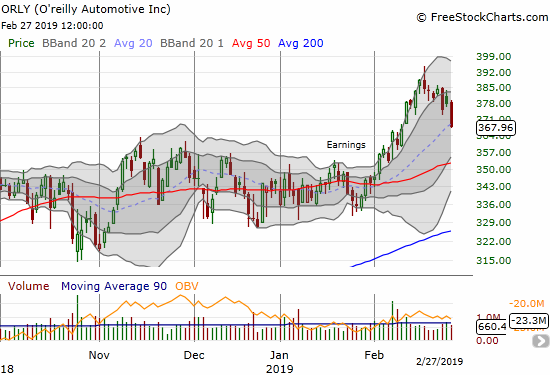
O’reilly Automotive (ORLY)
Times like these always make me appreciate the virtues of swing trades. I wanted to hold ORLY over a longer timeframe and all looked good until this week. ORLY is pulling back sharply from its latest all-time high with two relatively large 1-day pullbacks this week. I have lost a little over half of my profits. Still, I am determined to hold even through a complete reversal of the post-earnings breakout. I will have to stop out below 200DMA support.
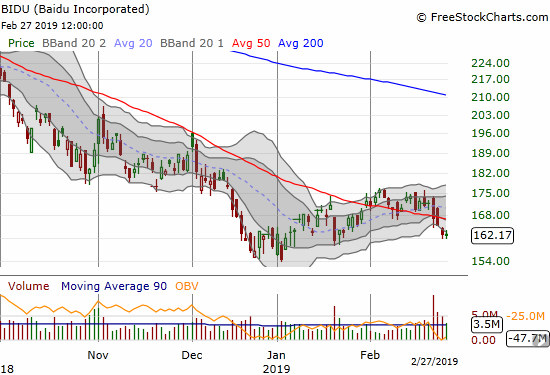
Baidu (BIDU)
While Chinese and China-related stocks are recovering nicely from the December lows, Baidu (BIDU) seriously lags. I am watching for a test of the December/January low or a new 50DMA breakout (buying signal).
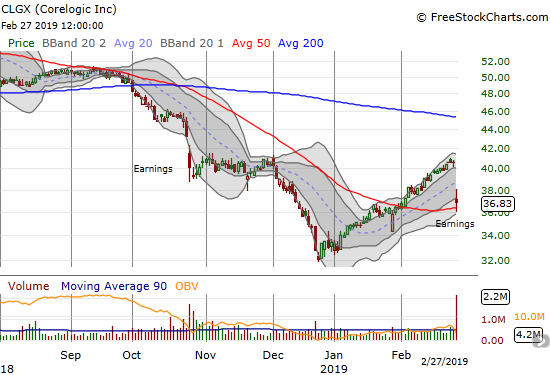
Corelogic (CLGX)
After good post-earnings responses from Redfin (RDFN) and Zillow Group (Z) (ZG), I was surprised to see industry “cousin” CLGX get clobbered. With 50DMA support holding, I am actively monitoring the stock for a trading opportunity to close the gap…or short on a 50DMA breakdown. A short-position could act as a kind of hedge against my long RDFN and Z positions.
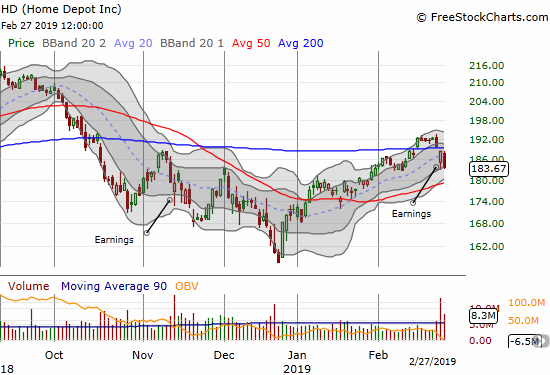
Home Depot (HD)
Home Depot (HD) gave up its 200DMA breakout. I idenitfied HD as a buy opportunity on the breakout, but I wanted to wait for the post-earnings response. I am glad I waited.
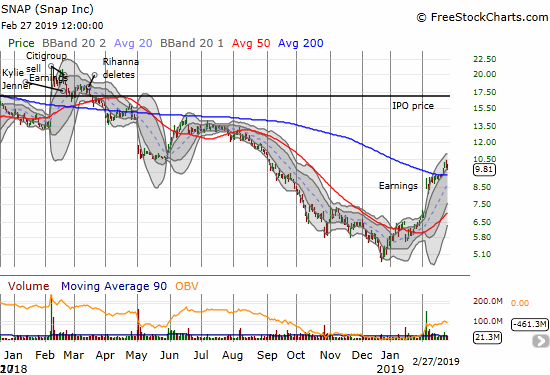
Snap (SNAP)
I did a mea culpa on Snap (SNAP) last September. After the stock started freshly downward soon after that post, I finally had enough and dumped my long position. With the stock now finally above my selling price again, I am intrigued. However, I want to return to my original bearish thesis on SNAP that motivated me to short the stock soon after the IPO. Accordingly, I am not interested in playing the 200DMA breakout, but instead will be looking for a 200DMA breakdown…mindful of the rapidly rising 50DMA looking to add support to the stock.
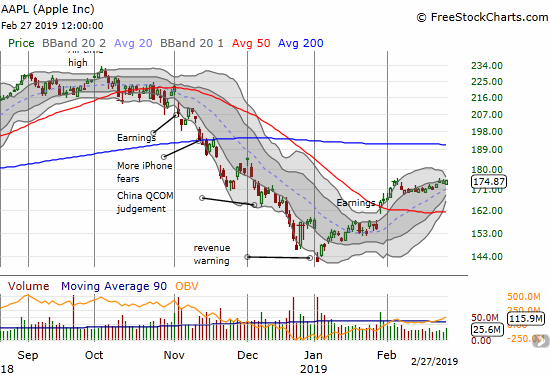
Apple (AAPL)
I skipped my weekly play on AAPL calls this week with the stock grinding to a halt in the the ultimate waiting game. The momentum has slowed down enough to build up pressure through a Bollinger Band (BB) squeeze. This could be one of the most exciting chart patterns of the next week or so. I plan to trade aggressively in the direction of the resolution of this BB squeeze.
— – —
FOLLOW Dr. Duru’s commentary on financial markets via email, StockTwits, Twitter, and even Instagram!
“Above the 40” uses the percentage of stocks trading above their respective 40-day moving averages (DMAs) to assess the technical health of the stock market and to identify extremes in market sentiment that are likely to reverse. Abbreviated as AT40, Above the 40 is an alternative label for “T2108” which was created by Worden. Learn more about T2108 on my T2108 Resource Page. AT200, or T2107, measures the percentage of stocks trading above their respective 200DMAs.
Active AT40 (T2108) periods: Day #37 over 20%, Day #35 over 30%, Day #34 over 40%, Day #33 over 50%, Day #29 over 60%, Day #23 over 70%, Day #12 over 80%
Daily AT40 (T2108)
")
Black line: AT40 (T2108) (% measured on the right)
Red line: Overbought threshold (70%); Blue line: Oversold threshold (20%)
Weekly AT40 (T2108)

*All charts created using freestockcharts.com unless otherwise stated
The T2108 charts above are my LATEST updates independent of the date of this given AT40 post. For my latest AT40 post click here.
Related links:
The AT40 (T2108) Resource Page
You can follow real-time T2108 commentary on twitter using the #T2108 or #AT40 hashtags. T2108-related trades and other trades are occasionally posted on twitter using the #120trade hashtag.
Be careful out there!
Full disclosure: long UVXY calls, long BBY put spread, long EA shares and calls, long ITB calls, long KBH calls, long ORLY, long Z, long RDFN
*Charting notes: FreeStockCharts.com stock prices are not adjusted for dividends. TradingView.com charts for currencies use Tokyo time as the start of the forex trading day. FreeStockCharts.com currency charts are based on Eastern U.S. time to define the trading day.