
AT40 = 16.3% of stocks are trading above their respective 40-day moving averages (DMAs) – 3rd day of oversold period following 4-day oversold period
AT200 = 33.6% of stocks are trading above their respective 200DMAs
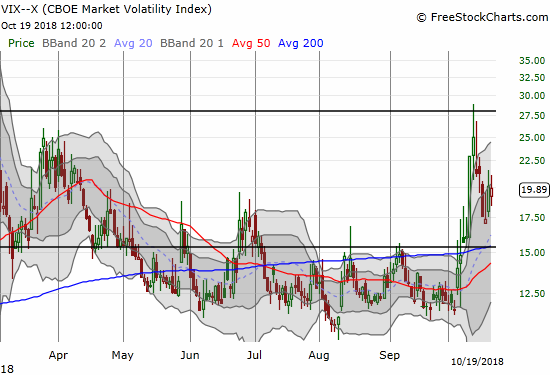
VIX = 19.9
Short-term Trading Call: bullish
Commentary
Friday was a day with a head-spinning mix of reassuring and ominous signals. Some important stocks lost big and/or suffered ominous fades. Some indices continued nasty slides or suffered new breakdowns. Two very important stocks delivered somewhat reassuring gains.
In the end, the S&P 500 (SPY) ended the day flat. AT40 (T2108), the percentage of stocks trading above their 40-day moving averages (DMAs), closed with a small gain after fading intraday from the oversold threshold (20%). AT200 (T2107), the percentage of stocks trading above their 200DMAs, closed with a small loss after fading from a downtrend line.
The computers and their technically-oriented programmers seem to be in control of the trading action. For the second straight trading day, the S&P 500 (SPY) managed to close exactly on top of its 200-day moving average (DMA).
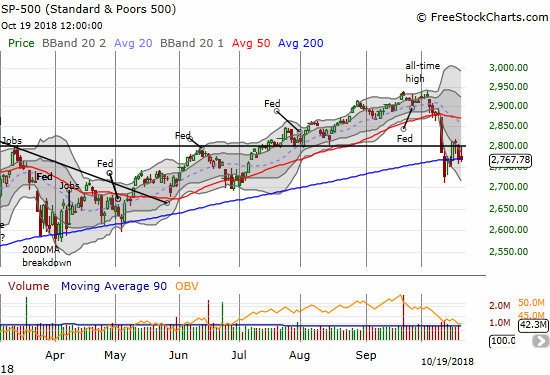
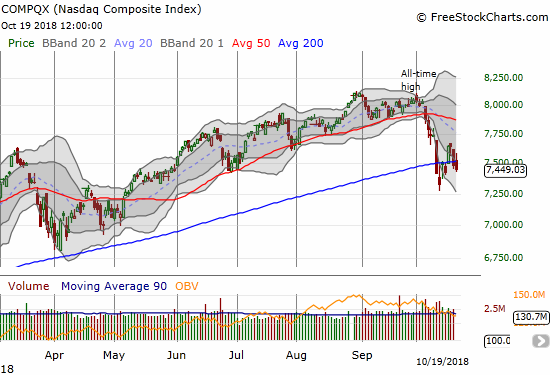
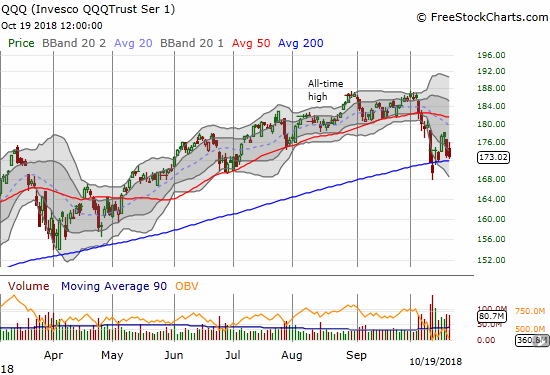
It is always good to see the S&P 500 holding critical long-term support. The NASDAQ was not so fortunate. After early gains, the tech-laden index faded to close under its 200DMA for the second straight day. At least the NASDAQ is still well off its recent lows. The Invesco QQQ Trust (QQQ) faded but closed flat and above 200DMA support.
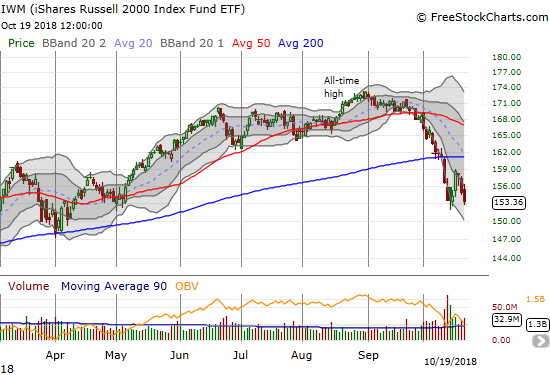
Small-caps were a locus of selling again as the iShares Russell 2000 ETF (IWM) faded from a gain to a 1.1% loss. The close finished a reversal of Tuesday’s promising gain. The close all kept intact tight resistance from the upper bound of the lower Bollinger Band (BB) channel.
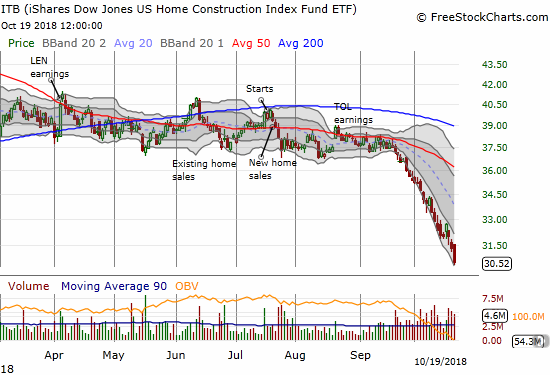
Home builders suffered mightily again with a 2.6% loss for iShares US Home Construction ETF (ITB). Since housing matters a lot more to more Americans than the stock market, I think the bear market in these stocks should be a much hotter topic of discussion and debate.
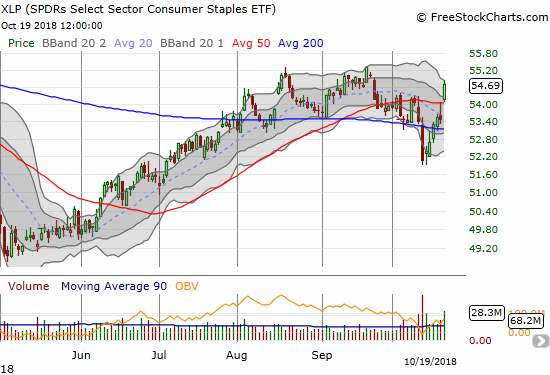
The market delivered a resounding applause for earnings from Proctor and Gamble (PG). PG gained a healthy 8.8% and closed at a 9-month high. This rally and breakout was enough to push the Consumer Staples Select Sector SPDR ETF (XLP) to a 2.3% gain. I took this opportunity to take small profits on my XLP call options. I am a bit skeptical of the prospects for XLP to break out above the recent highs in the short-term. More importantly, the risk/reward for holding out for more gains through a potential cycle of churn did not look attractive.
The volatility index, the VIX, signaled a market stalemate by ranging from high to low within the previous trading day’s high and low and closing the day down less than 1%.
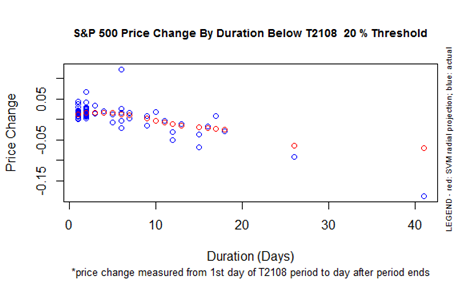
The market is now in its third oversold day. Given this oversold period is separated from the previous 4-day oversold period by just one day, I am think about this period as an extended oversold period. In other words, the one-day push marginally above the oversold threshold was more noise than signal. As a reminder, the longer the market stays oversold and/or the more frequently it returns to oversold conditions, the more bearish the market gets. Such behavior demonstrates the power of sellers over buyers. The chart below suggests that a 7-day oversold period is right on the edge of deteriorating projections and expectations. If an oversold period extends to 10 days and beyond, I expect the S&P 500 to emerge from the oversold period with a loss. The S&P 500 has so far lost 1.5% this oversold period.
Earnings season revs up this coming week. I expect a lot more churn and big swings from bullish to bearish sentiment.
CHART REVIEWS
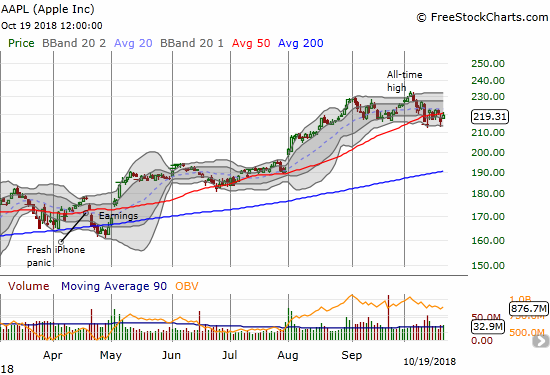
Apple (AAPL)
AAPL faded from its high of the day and its 50DMA, but the stock still managed to gain 1.5%. For Friday at least, AAPL looked like a refuge from widespread selling in the tech sector.
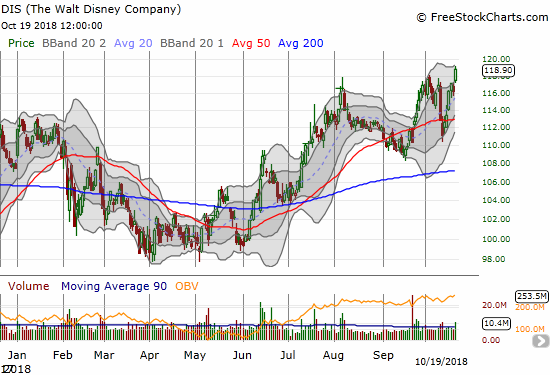
Disney (DIS)
Disney (DIS) is another stock trying its best to cheer up the market. DIS gained a healthy 2.3% on Friday to close at a near 3-year high. I guess I will not get another buy-the-dip opportunity in DIS anytime soon! This bullish, counter-market behavior is quite ironic given the heavy dose of skepticism that weighed on DIS earnings after earnings primarily based on the trials and tribulations at ESPN and the persistent yawning at a series of blockbuster hit movie releases. I am even wondering whether money is moving from highly over-valued NFLX shares to under-valued DIS shares (pairs trade anyone?).
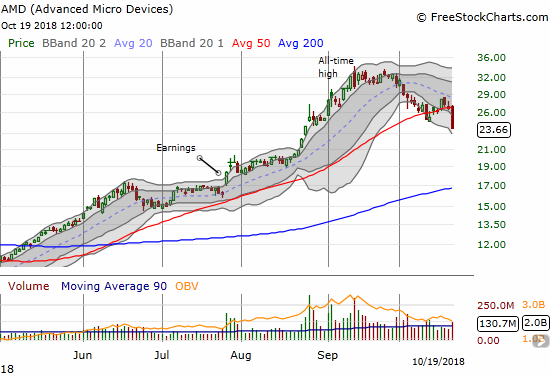
Advanced Micro Devices (AMD)
After AMD went parabolic in late August, I thought the stock would form a classic topping pattern. Consistent with the stubborn bullishness of the times, AMD instead went on to gain another 28% before finally topping out. Friday’s 11.2% plunge finally filled the gap up from that August 27th parabolic move. AMD may have finally confirmed its top given the outsized loss also formed a 50DMA breakdown. The plunge also happened a day after Cowen reiterated an outperform rating along with boosting its price target from $30/share to $33/share. Earnings after the market closes on October 24th should have the final say.
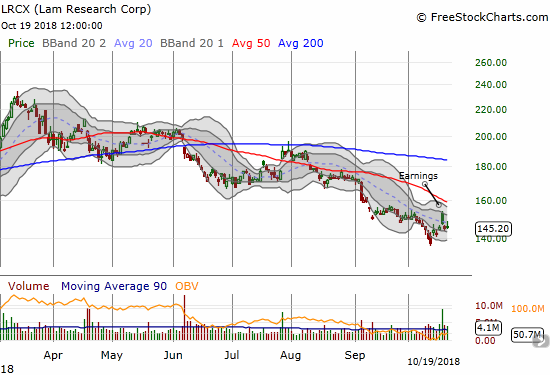
Lam Research Corporation (LRCX)
LRCX reported earnings that seemed to finally turn the tide for the semiconductor sector. LRCX gapped up 5.0% but sellers took over from there. The celebration turned into a “gap and crap” which closed LRCX back under its downtrending 20DMA. Sellers finished closing the gap the next day.
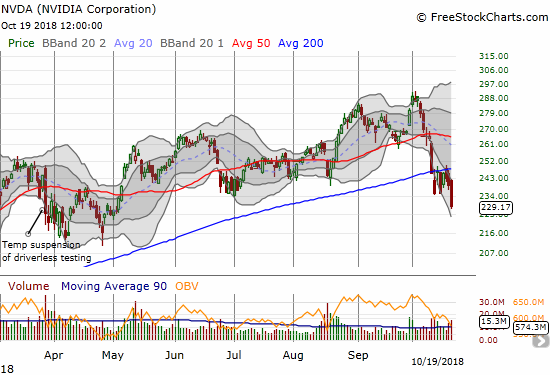
Nvidia (NVDA)
NVDA has finally succumbed to the spreading weakness in the sector. The stock lost 4.3% on Friday and closed at a 5+ month low. The stock also confirmed resistance at its 200DMA…a very bearish turn of events.
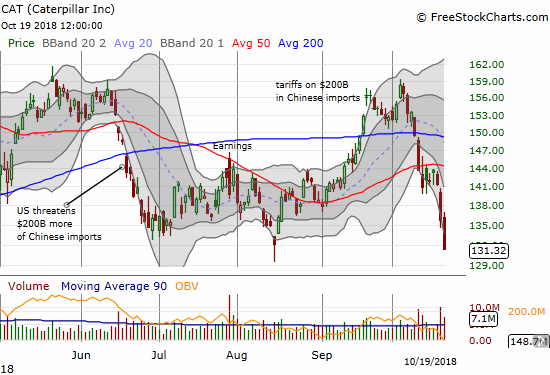
Caterpillar (CAT)
In my previous Above the 40 post, I wrote about CAT sitting at a critical juncture. On Friday, CAT took the bearish road to resolve that juncture. On the heels of a 3.3% loss, CAT made a new 2018 closing low and closed below the gap up from October earnings. CAT is now set up for further losses. I interpreted this bearish action as an ominous sign for industrial stocks especially in light of the post-earnings 200DMA breakdown for Grainger (GWW) earlier in the week and the implosion of United Rentals (URI) on Thursday. Accordingly, I took a pre-earnings position in put options on Illinois Tool Works (ITW).
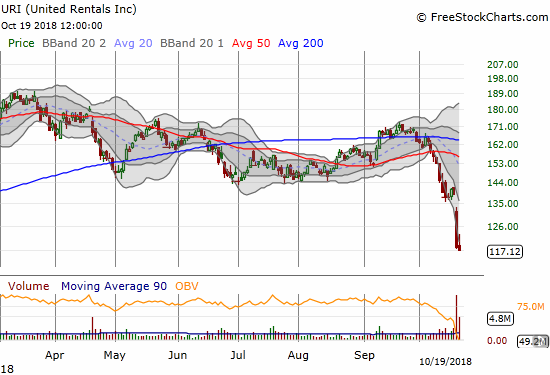
United Rentals (URI)
URI ended the week near a 14-month low on the heels of a massive post-earnings sell-off. The stock gapped down and lost 15.0% on Thursday. Next support lies between $101/share and $107/share where URI churned out a bottom for 2017.
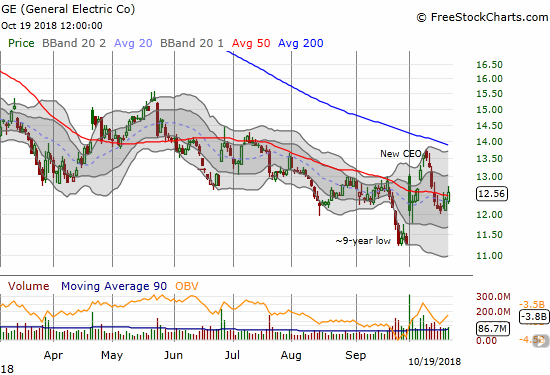
General Electric (GE)
Not even the renewed interest in GE from a CEO change could keep the stock immune from the fresh pressures on industrial stocks. The stock recovered from a gap and crap that day and soon made a fresh 50DMA breakout. The stock faded from 200DMA resistance and now finds itself struggling to hold onto another 50DMA breakout.
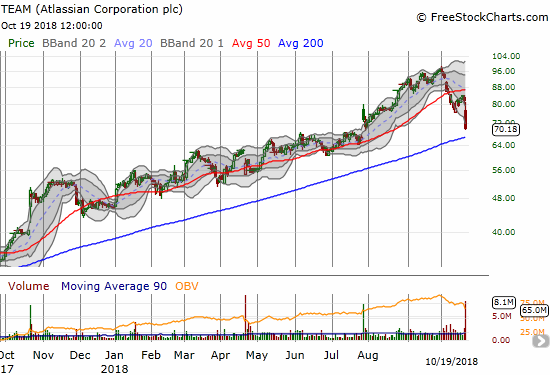
Atlassian Corporation PLC (TEAM)
The shine on cloud/SaaS stocks is officially tarnished. TEAM ran into a post-earnings buzzsaw that took the stock down 14.3% on extremely high trading volume in a move that effectively confirmed 50DMA resistance. With 200DMA support in play the stock is set to finish reversing its gains from July earnings.
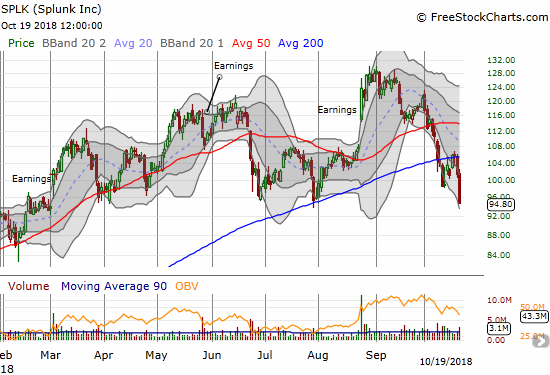
Splunk (SPLK)
SPLK was one of many locations of collateral damage from TEAM’s post-earnings troubles. SPLK lost 6.4% and cracked support that has held since late March. The break of that support also made a bearish confirmation of 200DMA resistance.
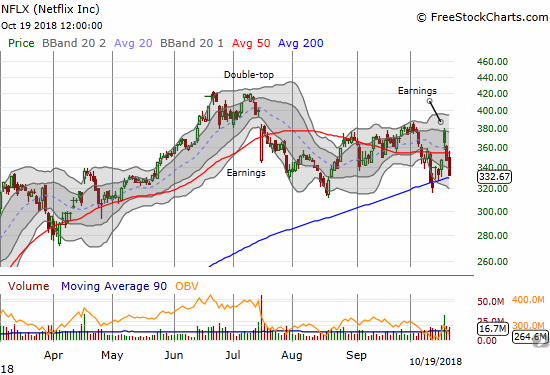
Netflix (NFLX)
For a brief moment, NFLX looked like it would help lead the stock market to better sentiment. Instead, the stock added more gloom. Sellers have yet to stop weighing on the stock after its post-earnings gap up. On Friday, NFLX lost another 4.1% and finished reversing all its post-earnings gains and then some. Its 200DMA support line is right back in play. Per my plan, I played NFLX from the winning side of the post-earnings move. I put on a calendar call spread to defray the volatility premium in the options. The long side now has 5 trading days to salvage some value.
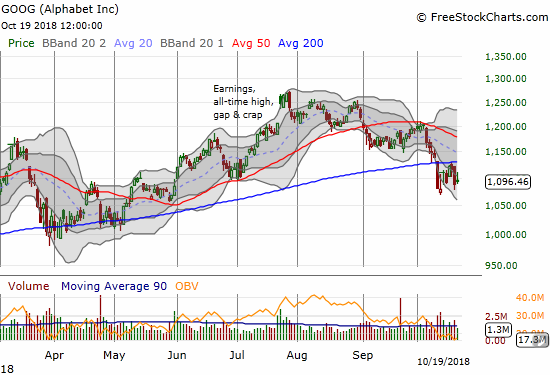
Alphabet (GOOG)
GOOG has cascaded downward since its last all-time high in July. Last week’s selling confirmed 200DMA resistance. A break of the October low would immediately put the 2018 lows into play.
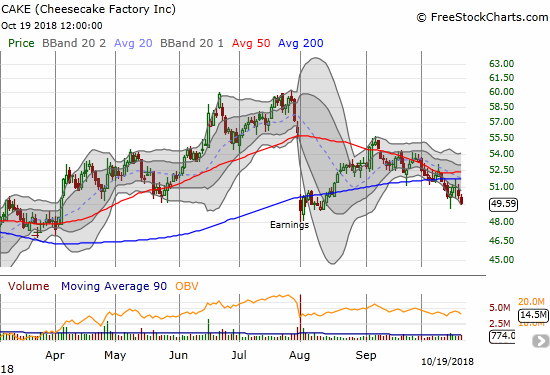
The Cheesecake Factory (CAKE)
My post-earnings trade in CAKE failed to bear fruit. Now the stock is working on a new bearish breakdown.
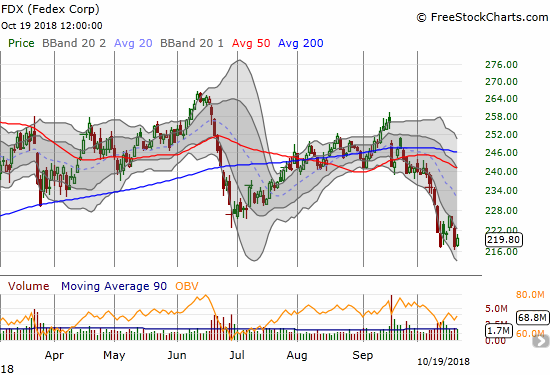
Federal Express (FDX)
If the economy is still fine, then FDX is a steal here. Despite the bearish breakdown below the 2018 low from June, I could not resist making a long-term play. I bought a long-term calendar call spread to account for a few more months of likely churn.
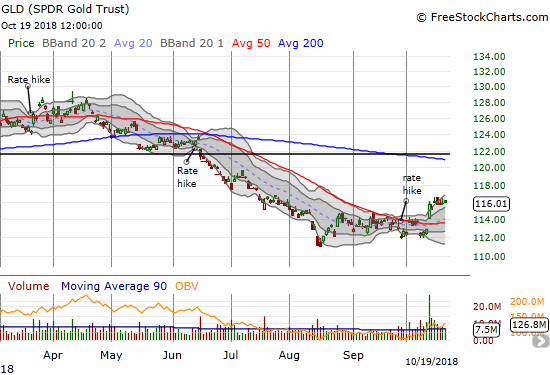
SPDR Gold Shares (GLD)
My short-term call spread on GLD did not pay off like I thought it would. GLD came to life on October 11, and I assumed that was the start of a significant rally. Perhaps I was just not patient enough by choosing an October expiration. A continuation is of course still very possible, but I am reluctant to try chasing again.
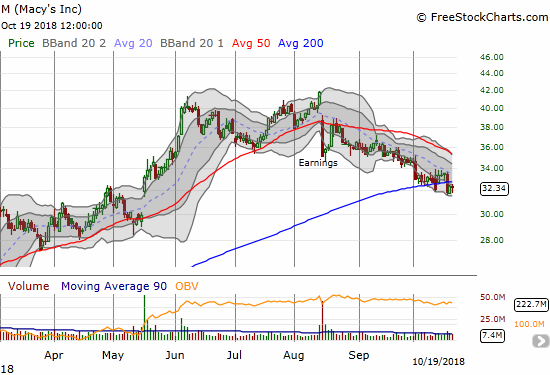
Macys (M)
Early this month I declared an end to the retail rally. The on-going weakness in Macys is one confirmation of that top. A declining 20DMA has effectively capped Macys and two 200DMA breakdowns have added weight to the anchor.
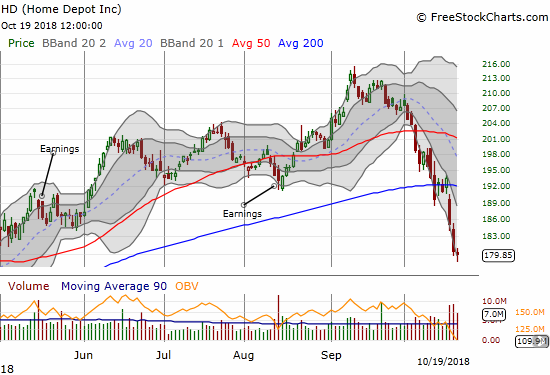
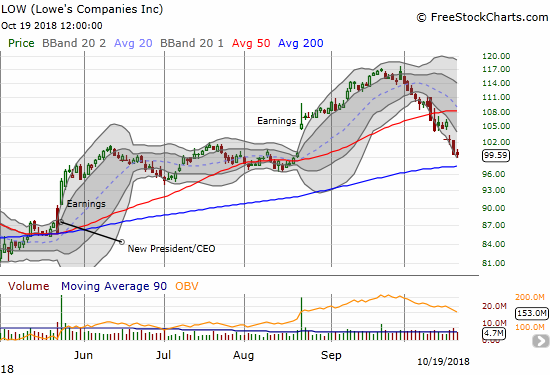
Home Depot (HD) and Lowes Companies (LOW)
The home improvement stores have spent most of 2018 oblivious to the trials and travails of home builder stocks. Those troubles are catching up to HD and LOW now that the stock market is selling off. The selling has created false breakouts out of the September all-time highs. Moreover, HD is suddenly under-performing LOW with a bearish breakdown.
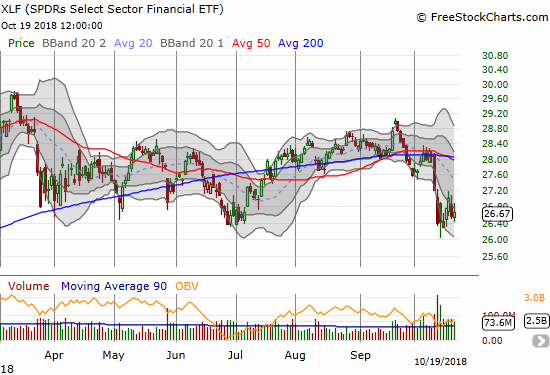
The Financial Select Sector SPDR ETF (XLF)
The financial sector had a chance to lead the market to a better mood, but a 2-day pop stopped cold. Now it just looks like a struggle to stave off a bearish breakdown to a new 2018 low.
The stock market could use a little bit of this…
Lucky charm. pic.twitter.com/zhSbqWrjtu
— Los Angeles Dodgers (@Dodgers) October 21, 2018
….and a flip of the bat.
— – —
FOLLOW Dr. Duru’s commentary on financial markets via email, StockTwits, Twitter, and even Instagram!
“Above the 40” uses the percentage of stocks trading above their respective 40-day moving averages (DMAs) to assess the technical health of the stock market and to identify extremes in market sentiment that are likely to reverse. Abbreviated as AT40, Above the 40 is an alternative label for “T2108” which was created by Worden. Learn more about T2108 on my T2108 Resource Page. AT200, or T2107, measures the percentage of stocks trading above their respective 200DMAs.
Active AT40 (T2108) periods: Day #3 under 20% (oversold), Day #8 under 30%, Day #15 under 40%, Day #20 under 50%, Day #36 under 60%, Day #89 under 70%
Daily AT40 (T2108)
")
Black line: AT40 (T2108) (% measured on the right)
Red line: Overbought threshold (70%); Blue line: Oversold threshold (20%)
Weekly AT40 (T2108)

*All charts created using freestockcharts.com unless otherwise stated
The charts above are my LATEST updates independent of the date of this given AT40 post. For my latest AT40 post click here.
Related links:
The AT40 (T2108) Resource Page
You can follow real-time T2108 commentary on twitter using the #T2108 or #AT40 hashtags. T2108-related trades and other trades are occasionally posted on twitter using the #120trade hashtag.
Be careful out there!
Full disclosure: long UVXY puts, long SPY calls, long GLD, long ITB calls and calendar call spread, long AAPL calls, long GE calls, long NFLX call, long FDX calendar call spread,
*Charting notes: FreeStockCharts.com stock prices are not adjusted for dividends. TradingView.com charts for currencies use Tokyo time as the start of the forex trading day. FreeStockCharts.com currency charts are based on Eastern U.S. time to define the trading day.
Short term interest rates are creeping up a little every day. Yields on MMkt accounts are quite competitive with dividend yields on the better blue chips, and unlike the latter, have virtually no risk.
While there’s no reason to buy bonds (you can sure see that from the chart), other than a bounce from oversold, there’s also not much reason to buy stocks. I think rising rates have pretty well capped off the up trend, long term.
I did a lot of selling on the way up, and am doing a little nibbling here. But most of the proceeds are sitting in MMkt funds. With the FED slowly ‘removing the punch bowl’, besides an oversold bounce, I don’t see much reason to get too aggressive here, unless T2108 gets down to mid-single digits. Even then, I would probably buy and dump (a la Duru) on any rally.
You’re reading my mind as I scramble to write my latest post before it gets too late in the night! 🙂
I have a creeping feeling that the market has topped out and we are transitioning from buy the dips to sell the rallies.
SPY down over 3%, VIX up to almost 26. I’ll be most interested in the latest T2108 value…..this can’t go on too much longer…
We are already at the point T2108 provides no additional info. T2107 is almost at that point. Now we are just in freefall. The duration of the oversold period still matters given the loose correlation between duration and a bear market!