AT40 = 62.2% of stocks are trading above their respective 40-day moving averages (DMAs)
AT200 = 59.0% of stocks are trading above their respective 200DMAs
VIX = 12.2
Short-term Trading Call: neutral
Commentary
Money managers may desperately want to wait until after Labor Day to put idle cash to work, but the stock market may force more and more hands to rush in earlier and faster. FOMO – Fear Of Missing Out – may be warming up.

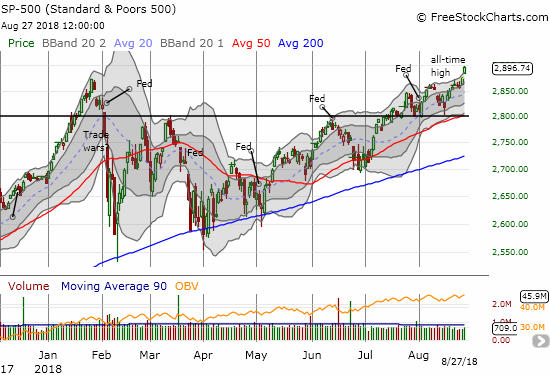
With the Fed out of the way, the S&P 500 ran freely above its upper-Bollinger Band (BB) to another all-time high. The index has not gapped up like this all year. The stretch makes the index look primed to attempt a run-up similar to January’s…and the more other money managers come to that conclusion, the more likely FOMO will create a self-fulfilling prophecy.
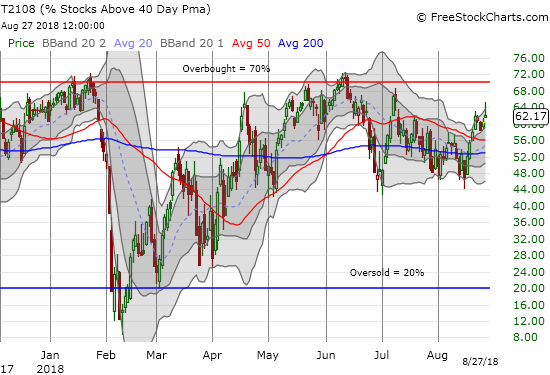
Already similar to January’s run-up is the behavior of AT40 (T2108), the percentage of stocks trading above their 40-day moving averages (DMAs). AT40 is still failing to confirm the index’s new-found strength. AT40 traded as high as 65.4% but faded all the way back to a close at 62.2%. The move created a gain for the day under two percentage points. During January’s run-up, AT40 essentially churned in place. My favorite technical indicator only managed to close in over-bought territory (above 70%) twice and just marginally at that. When AT40 fell from the overbought threshold, it created a sell warning which I am being more disciplined to respect early (I was embarrassingly late in recognizing the strengthening and dangerous sell-off from January’s top). I will be on alert as the S&P 500 presumably melts itself higher in the coming days and maybe even weeks.

For good measure, I doubled down on my S&P 500 put options which are now incredibly cheap as portfolio protection. The volatility index remained steady on the day, so there was no opportunity to double down on my ProShares Ultra VIX Short-Term Futures (UVXY) call options at a cheaper price.
CHART REVIEWS
Advanced Micro Devices (AMD)
AMD is a great stock for today’s them of melt-ups and parabolic moves.
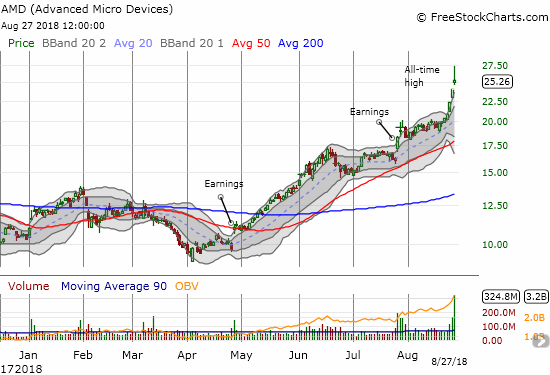
AMD is up 146% year-to-date. The stock’s latest breakout has transformed into a classic parabolic pattern. Trading volume soared to 324.8M shares, an all-time record for AMD. The 268M shares traded on May 2, 2017 post-earnings now takes second place. AMD fell 24.2% that day. Ironically, the stock closed at $10.32 which is almost exactly the same as the $10.28 share price it ended 2017 with.
AMD gained 5.3% but faded sharply from its all-time intraday high of $27.30. After closing three straight days well above its upper-BB, AMD is due for a rest. If the stock closes today’s gap, it will likely confirm the classic topping pattern of the evening star. The record trading volume will then provide the marker of a blow-off top. With 20% of the float sold short, I strongly suspect a many AMD bears rushed to get out today.

Tilray (TLRY)
TLRY is another great stock for today’s theme given cannibis-related stocks have become quite the rage.
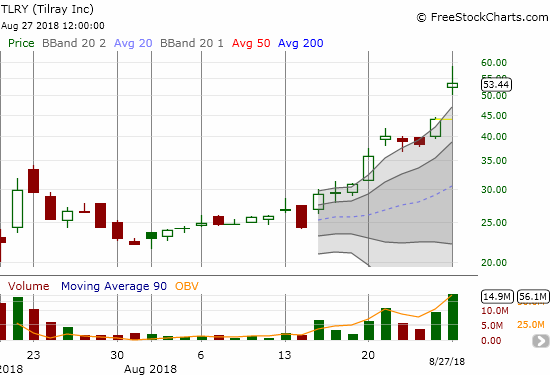
TLRY gapped up today and closed with a 21.8% gain on record volume. It fell sharply from its intraday all-time high of $58.68. An earnings report tomorrow evening will add further drama to this show with the CEO making a post-earnings appearance on CNBC for good measure.
The video clip below comes from CNBC’s Fast Money featuring Timothy “Cannibis King” Seymour talking weed stocks. I often fail to quite understand Tim’s specific trading advice, and his commentary on TLRY was similarly hard to tie up neatly: the stock is “ridiculously expensive” but the stock is also potentially in play for a buy-out that will be a part of big brand building. The upcoming earnings event should make investors cautious; the stock could be due for a pullback. Yet, TLRY has some “impressive investors” on its board and has critical mass.
Tim has been selling upside calls against his TLRY position at the $60 strike; the actions speak more clearly than the words. The options market, no surprise, is pricing in about a 29% move from today’s close by September 21st. Let the fireworks continue!

Pot stocks are surging in part on deal speculation. @TimSeymour breaks down fact from fiction. $CRON $TLRY $APHQF pic.twitter.com/3v71BabbEd
— CNBC's Fast Money (@CNBCFastMoney) August 27, 2018
— – —
FOLLOW Dr. Duru’s commentary on financial markets via email, StockTwits, Twitter, and even Instagram!
“Above the 40” uses the percentage of stocks trading above their respective 40-day moving averages (DMAs) to assess the technical health of the stock market and to identify extremes in market sentiment that are likely to reverse. Abbreviated as AT40, Above the 40 is an alternative label for “T2108” which was created by Worden. Learn more about T2108 on my T2108 Resource Page. AT200, or T2107, measures the percentage of stocks trading above their respective 200DMAs.
Active AT40 (T2108) periods: Day #131 over 20%, Day #100 over 30%, Day #95 over 40%, Day #8 over 50%, Day #2 over 60% (overperiod), Day #51 under 70%
Daily AT40 (T2108)

Black line: AT40 (T2108) (% measured on the right)
Red line: Overbought threshold (70%); Blue line: Oversold threshold (20%)
Weekly AT40 (T2108)

*All charts created using freestockcharts.com unless otherwise stated
The charts above are my LATEST updates independent of the date of this given AT40 post. For my latest AT40 post click here.
Related links:
The AT40 (T2108) Resource Page
You can follow real-time T2108 commentary on twitter using the #T2108 or #AT40 hashtags. T2108-related trades and other trades are occasionally posted on twitter using the #120trade hashtag.
Be careful out there!
Full disclosure: long SPY puts, long UVXY calls
*Charting notes: FreeStockCharts.com stock prices are not adjusted for dividends. TradingView.com charts for currencies use Tokyo time as the start of the forex trading day. FreeStockCharts.com currency charts are based on Eastern U.S. time to define the trading day.
