
AT40 = 15.8% of stocks are trading above their respective 40-day moving averages (DMAs) – 2nd day of oversold period following 4-day oversold period
AT200 = 33.9% of stocks are trading above their respective 200DMAs (up 6 percentage points)
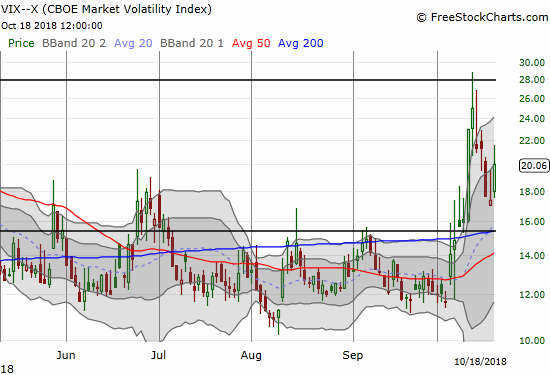
VIX = 20.1 (15% increase)
Short-term Trading Call: bullish
Commentary
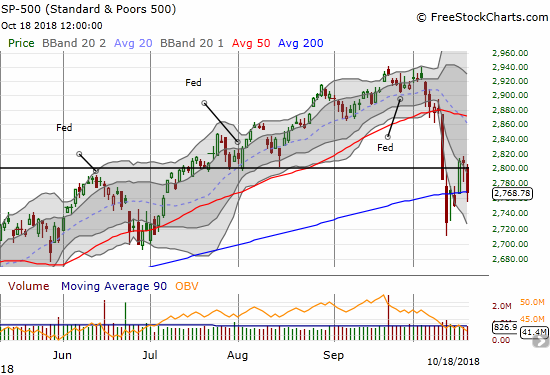
The 200-day moving averages (DMAs) still feature prominently in the market’s now protracted struggle to slog through oversold trading conditions. Almost like magic, the S&P 500 (SPY) closed the day right on top of its 200DMA after a 1.4% loss.
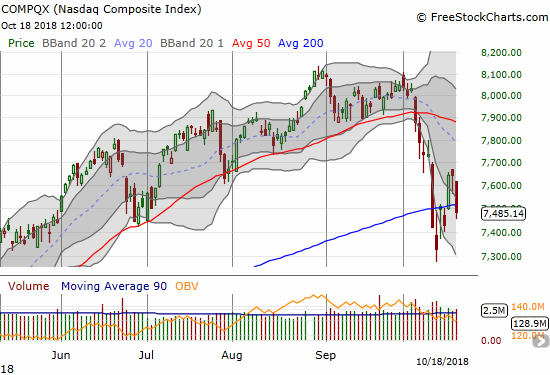
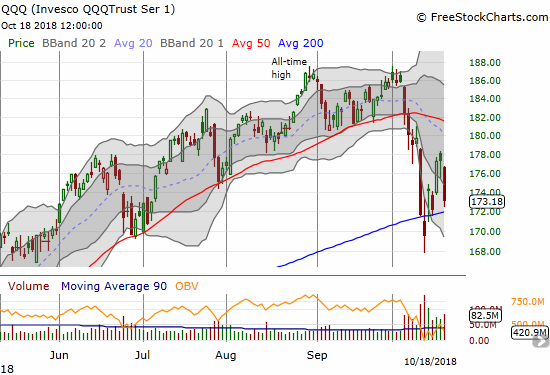
The NASDAQ was not quite as fortunate. Its 2.1% loss on the day pushed it just below its 200DMA. The Invesco QQQ Trust (QQQ) lost 2.3% but stayed above its 200DMA support the entire day.
Sellers added emphasis to the return of bearish sentiment with a return of the volatility index, the VIX, to the “elevated” level of 20.1. The VIX immediately went from looking poised to drop below the 15.35 pivot to looking like it is ready to launch higher than the last high.
On the currency side, the Australian dollar (FXY) versus the Japanese yen (JPY) faded from 50DMA resistance but at least it did not make a new low. At the time of writing, AUD/JPY reversed the previous loss and thus printed a potentially bullish sign for Friday’s trading. (For more background on the relationship of AUD/JPY to the S&P 500 see “The Australian Dollar and Japanese Yen Are Still Useful S&P 500 Signals“).

Source: TradingView
AT40 (T2108), the percentage of stocks trading above their respective 40DMAs, dropped to 15.8% for a second day of this latest oversold period. The trading action is starting to look similar to the churn that occurred from April to May of this year as the S&P 500 bounced from and dropped to its 200DMA support while only once closing below that support level. A friend of mine helped me realize the high potential for the market to get stuck in another protracted period of churn until at least the mid-term elections in the U.S. (November 6, 2018). After all, almost a week into earnings season nothing has happened to break the market’s back or to assure buyers to continue a journey out of and away from oversold conditions. I will keep this scenario in mind if the market starts to frustrate both buyers and sellers.
When the S&P 500 first hit its 200DMA I bought a fresh tranche of call options. I prepared to buy a lot more if sellers washed out the close. After buyers started taking the indices off their lows, I hit the reset button on my volatility fades with puts expiring in 2 weeks on the ProShares Ultra VIX Short-Term Futures (UVXY). I also took profits on more hedges. The largest outstanding hedge was a fist full of put options on Caterpillar (CAT). This phase of oversold trading always puts my convictions and analysis to the test. While the stock market struggles to bounce out of oversold conditions, I have a strong temptation to try to time and game the setbacks with bearish positions. The problem is not just in getting caught with too many bearish positions when the market suddenly snaps back from an oversold stretch but also in taking away time from identifying the even more attractive upside opportunities.
CHART REVIEWS
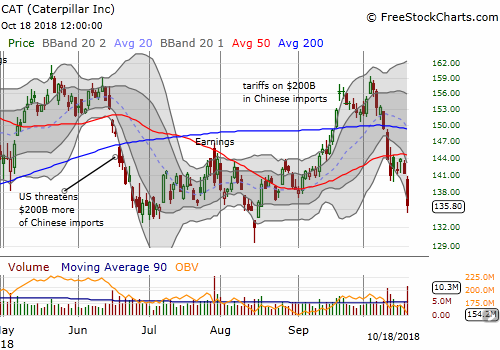
Caterpillar (CAT)
CAT is is approaching a critical juncture. The stock hovers above its closing low for the year at $132. A break of that level would likely lead to a swift drawdown to much lower prices. CAT’s run-up in the second half of 2017 was so strong and swift that the stock left behind few perches of natural support. The current levels correspond with the one month period of consolidation that followed CAT’s big earnings gap up October 24, 2017.
— – —
FOLLOW Dr. Duru’s commentary on financial markets via email, StockTwits, Twitter, and even Instagram!
“Above the 40” uses the percentage of stocks trading above their respective 40-day moving averages (DMAs) to assess the technical health of the stock market and to identify extremes in market sentiment that are likely to reverse. Abbreviated as AT40, Above the 40 is an alternative label for “T2108” which was created by Worden. Learn more about T2108 on my T2108 Resource Page. AT200, or T2107, measures the percentage of stocks trading above their respective 200DMAs.
Active AT40 (T2108) periods: Day #2 under 20% (oversold), Day #7 under 30%, Day #14 under 40%, Day #19 under 50%, Day #35 under 60%, Day #88 under 70%
Daily AT40 (T2108)
")
Black line: AT40 (T2108) (% measured on the right)
Red line: Overbought threshold (70%); Blue line: Oversold threshold (20%)
Weekly AT40 (T2108)

*All charts created using freestockcharts.com unless otherwise stated
The charts above are my LATEST updates independent of the date of this given AT40 post. For my latest AT40 post click here.
Related links:
The AT40 (T2108) Resource Page
You can follow real-time T2108 commentary on twitter using the #T2108 or #AT40 hashtags. T2108-related trades and other trades are occasionally posted on twitter using the #120trade hashtag.
Be careful out there!
Full disclosure: long UVXY puts, long SPY calls
*Charting notes: FreeStockCharts.com stock prices are not adjusted for dividends. TradingView.com charts for currencies use Tokyo time as the start of the forex trading day. FreeStockCharts.com currency charts are based on Eastern U.S. time to define the trading day.