
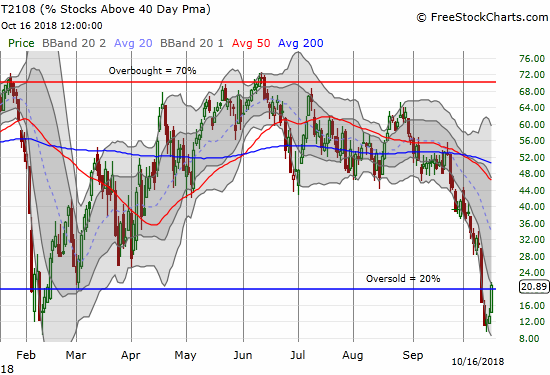
AT40 = 20.9% of stocks are trading above their respective 40-day moving averages (DMAs) – ended a 4-day oversold period
AT200 = 39.6% of stocks are trading above their respective 200DMAs (up 6 percentage points)
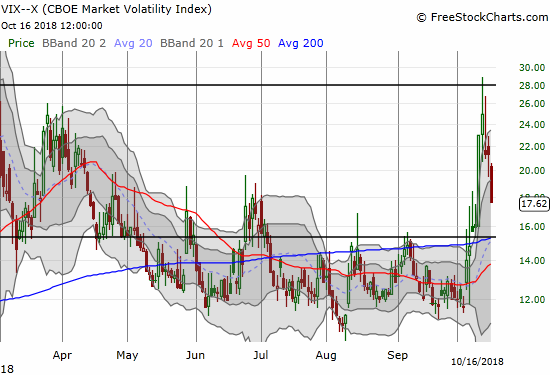
VIX = 17.6 (drop of 17.3%)
Short-term Trading Call: bullish
Commentary
The average oversold period lasts 5 days. The latest oversold period just ended at 4 days. This episode was yet one more reminder why I prefer the aggressive approach to buying oversold periods over the conservative approach. The conservative approach waits to buy a sell-off until after AT40 exits the oversold period.
AT40 (T2108), the percentage of stocks trading above their respective 40-day moving averages (DMAs), soared from 13.2% to 20.9%.
AT200 (T2107), the percentage of stocks trading above their respective 200DMAs, soared from 33.6% to 39.6% in a move that helped confirm a massive swing in sentiment from the bearish depths of last Thursday and Friday.
The S&P 500 (SPY) gained 2.2% in a move of pure poetry. The index gapped up to open just above its 200DMA and ran upward from there. The now downtrending 50DMA is in play as the next line of resistance.
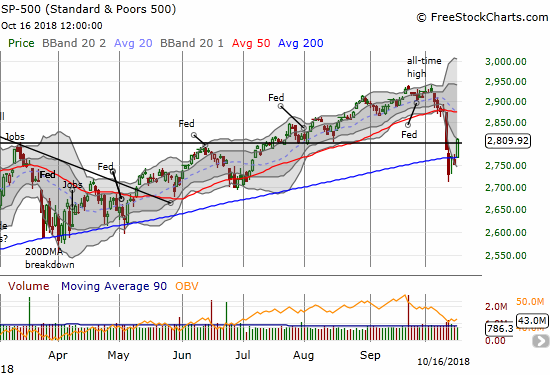
The S&P 500 only gained 0.9% for this latest oversold period. This performance is roughly in-line with the history of oversold periods and the resulting projection from this history.
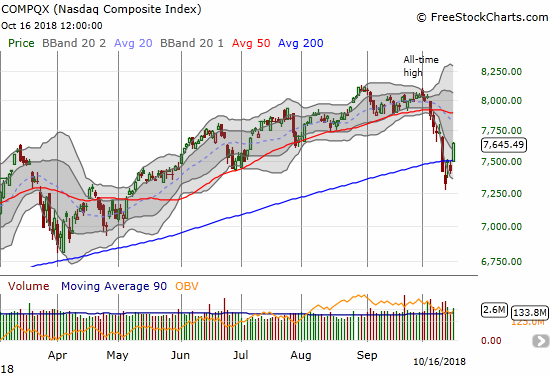
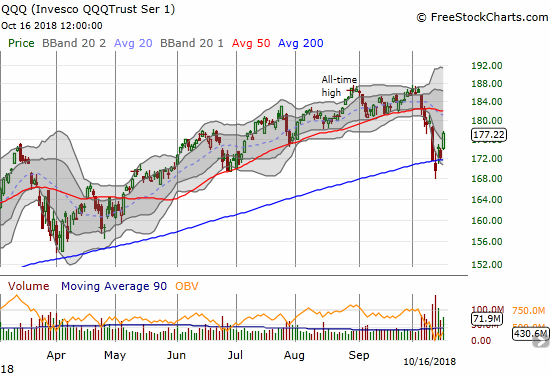
The NASDAQ imitated the poetry of the S&P 500 with a gap up and rally above its 200DMA for a 2.9% gain. The Invesco QQQ Trust (QQQ) gained 2.9% in a move that bullishly confirmed 200DMA support.
The jump in the breadth indices suggests that the market’s rally was comprehensive and broad. Even the much maligned iShares US Home Construction ETF (ITB) managed to gain 2.2% for only its second gain in 20 trading days. The volatility index, the VIX, was the icing on the cake with a 19.1% plunge to 17.2. All that remains is a complete reversal of fear is a close below the 15.35 pivot.
Speaking of fear, Reuters published a very timely article ahead of Tuesday’s rally titled: “Investors gloomiest on world growth in decade, cut U.S. equity holdings – BAML poll.” I think the following quote speaks volumes confirming the extremes of fear that just washed over the market:
“The survey, released on Tuesday was conducted Oct. 5 to 11 and canvassed investors managing $646 billion. It showed investors remained overweight equities overall, though the 22 percent overweight was just marginally off the recent record low of 19 percent…
The poll showed that a net 38 percent of respondents expected the global economy to slow, the worst outlook on global growth since November 2008…The poll showed a dramatic 17 percentage-point drop in U.S. equity allocations to a net 4 percent overweight.”
I sold my latest tranche of SPY call options into the rally; the options represented a quick double so by rule I sold. I held onto all my other short-term trading longs. I am also still holding onto my hedges. While these hedges are very small relative to my longs, I was not bullish enough during the market’s lows. For example, I did not aggressively accumulate put options on ProShares Ultra VIX Short-Term Futures (UVXY) and thus am still sitting on net losses. I took advantage of the implosion in implied volatility to add more puts.
Still, the train has not completely left the station. Plenty of upside remains until the next levels of resistance get hit and/or until AT40 hits overbought levels (above 70%). Moreover October’s tradition of outsized drawdowns means that 200DMAs could suffer another test before a sustained rally launches. For good measure, sellers might even be able to pull off a brief break of recent lows in the next dip.
Overall, it is still time to buy the dip until the market is otherwise proven guilty. Assuming Netflix (NFLX) can hold its monster after hours post-earnings gains from Tuesday night, the stock will add one more signal that breaks the selling spell with a confirmation of 200DMA support.
CHART REVIEWS
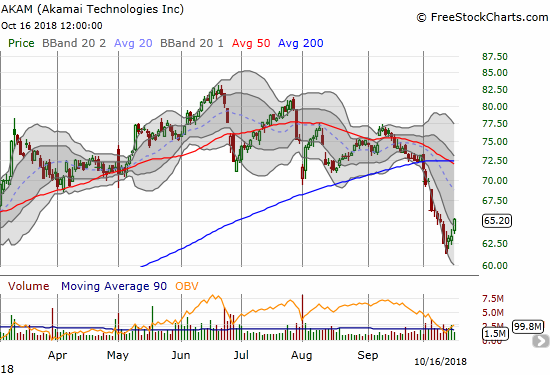
Akami (AKAM)
AKAM looks good to bounce into earnings on October 29th after bouncing away from the 2018 lows set in February.
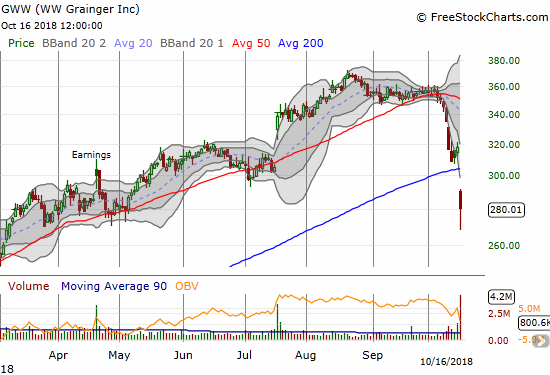
W.W. Grainger (GWW)
The rally day was definitely not all candy and roses. Industrial parts supplier GWW suffered a 12.0% post-earnings loss and closed well below its lower-BB.
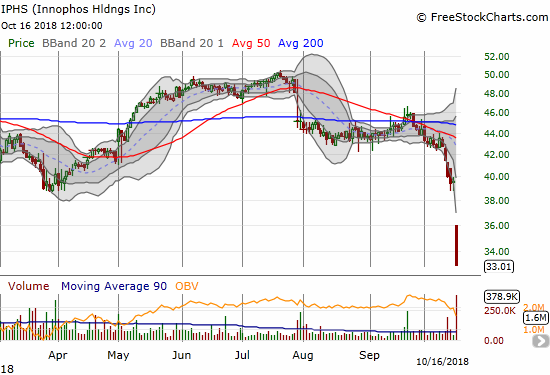
Innophos Holdings, Inc. (IPHS)
IPHS, a specialty chemicals company that supplies the food industry, suffered such a bad post-earnings loss it closed on its low of the day.
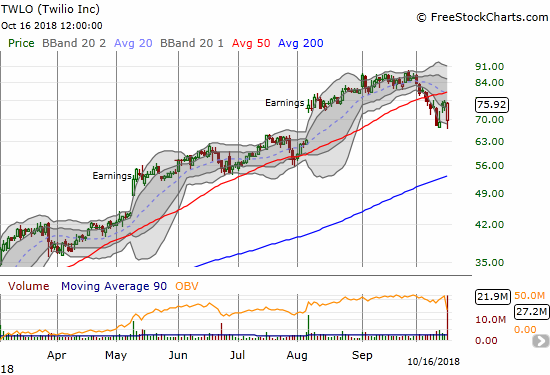
Twilio (TWLO)
Managed to close nearly flat after announcing its acquisition of Sendgrid (SEND). The ability to bounce off the intraday lows is a bullish sign for TWLO. Note that 50DMA resistance looms overhead.
— – —
FOLLOW Dr. Duru’s commentary on financial markets via email, StockTwits, Twitter, and even Instagram!
“Above the 40” uses the percentage of stocks trading above their respective 40-day moving averages (DMAs) to assess the technical health of the stock market and to identify extremes in market sentiment that are likely to reverse. Abbreviated as AT40, Above the 40 is an alternative label for “T2108” which was created by Worden. Learn more about T2108 on my T2108 Resource Page. AT200, or T2107, measures the percentage of stocks trading above their respective 200DMAs.
Active AT40 (T2108) periods: Day #1 over 20% (overperiod ending 4 days undersold), Day #5 under 30%, Day #12 under 40%, Day #17 under 50%, Day #33 under 60%, Day #86 under 70%
Daily AT40 (T2108)
")
Black line: AT40 (T2108) (% measured on the right)
Red line: Overbought threshold (70%); Blue line: Oversold threshold (20%)
Weekly AT40 (T2108)

*All charts created using freestockcharts.com unless otherwise stated
The charts above are my LATEST updates independent of the date of this given AT40 post. For my latest AT40 post click here.
Related links:
The AT40 (T2108) Resource Page
You can follow real-time T2108 commentary on twitter using the #T2108 or #AT40 hashtags. T2108-related trades and other trades are occasionally posted on twitter using the #120trade hashtag.
Be careful out there!
Full disclosure: long UVXY puts
*Charting notes: FreeStockCharts.com stock prices are not adjusted for dividends. TradingView.com charts for currencies use Tokyo time as the start of the forex trading day. FreeStockCharts.com currency charts are based on Eastern U.S. time to define the trading day.