
Stock Market Commentary
Media coverage of bubble talk in AI has become increasingly urgent and loud in recent months. Legendary short seller Michael Burry seemed to ring the clarion call when news dropped on Tuesday (November 4) about a massive bearish bet against NVIDIA (NVDA) and Palantir (PLTR). NVDA fell 4.0% that day. The downward trajectory continued until buyers finally showed up after NVDA broke support at its 50-day moving average (DMA). That attempted rescue cascaded throughout the tech sector, AI in particular, but fell far short of rescuing the entire stock market. Small caps ended the week in breakdown territory and market breadth broke down just as I feared could happen this week. This partial rescue prevents me from declaring a likely bottom as I would be inclined to do after such prominent hammers created by the buyers rushing into the breach during roughly the final two-thirds of Friday’s trading.
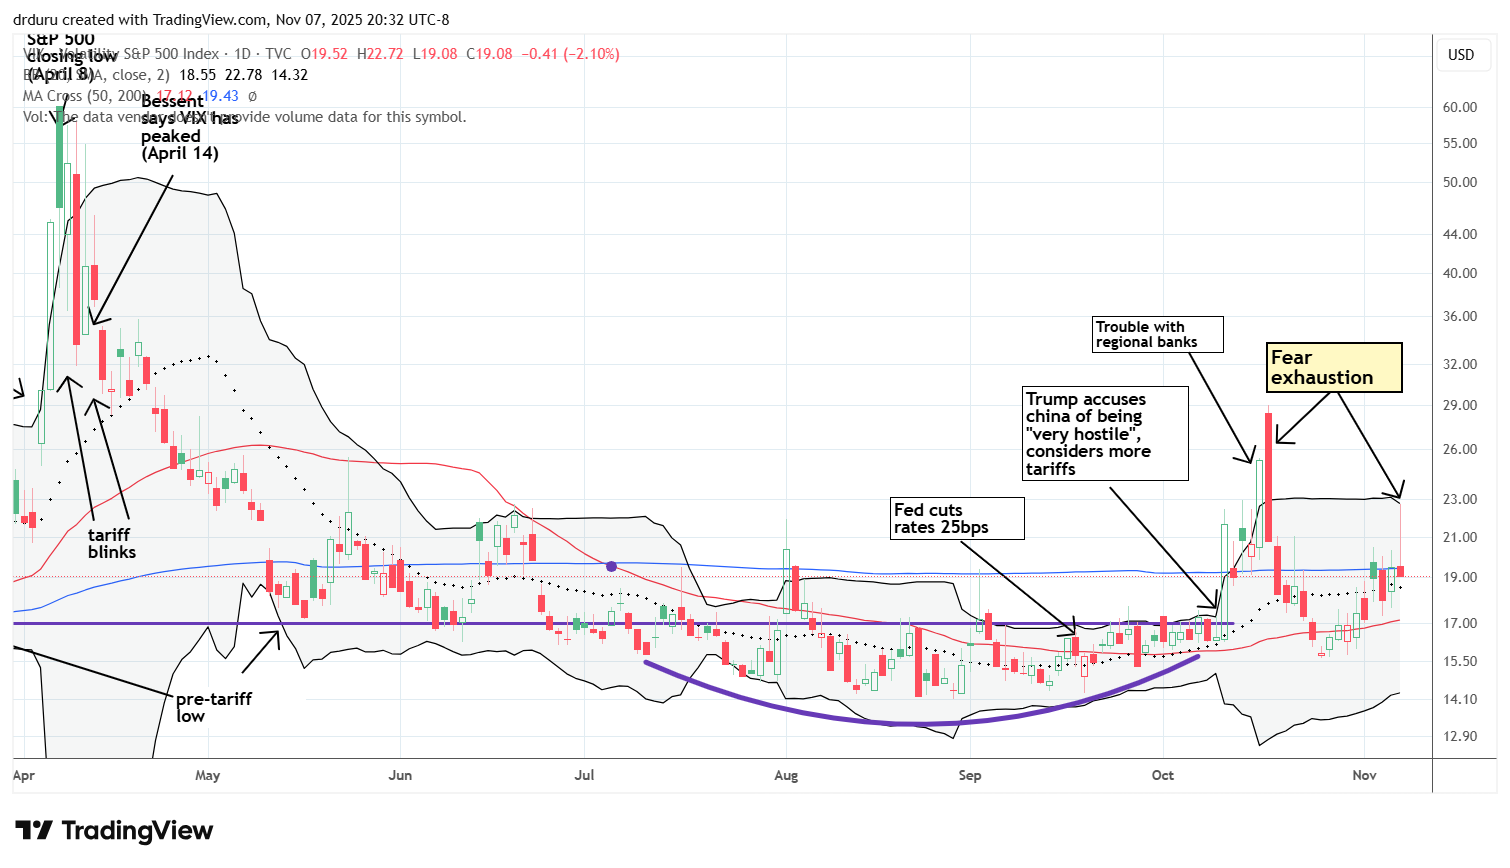
The volatility index (VIX) responded to the partial rescue with a sharp fade on Friday that looks like the second exhaustion of fear in a month. This reversal is a positive sign for the buyers and bulls and could form the launchpad for the next rally for the S&P 500 and the NASDAQ even if market breadth continues to languish.
Stock Market Commentary
The Stock Market Indices
S&P 500 (SPY)
The S&P 500 (SPY) tumbled 1.0% after the Fed’s rate cut and has yet to recover. The index fell another 1.2% in the wake of the Burry news, seemed to stabilize the next day, and resumed selling the next day plus a few hours. The S&P 500 last closed below its 50DMA (the red line below) on April 30th….and buyers on Friday made sure the streak and the uptrend continued. Even if this rescue ends up failing, the S&P 500 will still have likely support at the October closing low of 6,553.
")
NASDAQ (COMPQX)
Recall that the NASDAQ managed to hit an all-time high on the day of the Fed rate cut. Even after tumbling 1.6% the next day, the tech-laden index drifted higher the next two days to challenge the all-time high. The Burry news took the NASDAQ down 2.0% that day. Buyers were more precise with the NASDAQ than with the S&P 500 by stepping in right below the 50DMA for a picture-perfect defense of key support.
")
iShares Russell 2000 ETF (IWM)
Small caps continue to lag. The partial rescue from the AI bubble fears left IWM behind. The ETF of small caps ended the week with a close below converged support from its 50DMA and previous all-time high. Although IWM is technically in bearish territory with this breakdown, I went ahead and reloaded on my trade in IWM calls with a weekly $242.50/$242 calendar call spread. If weakness continues, I am looking for a rebound in the following week.
")
The Short-Term Trading Call With A Partial Rescue
- AT50 (MMFI) = 37.96% of stocks are trading above their respective 50-day moving averages
- AT200 (MMTH) = 53.13% of stocks are trading above their respective 200-day moving averages
- Short-term Trading Call: cautiously bullish
AT50 (MMFI), the percentage of stocks trading above their respective 50DMAs, closed the week at 38.0%. The Burry news pushed my favorite technical indicator into a breakdown to its lowest level since April. Friday’s rebound failed to reverse the breakdown. Thus the partial rescue of the stock market leaves the market in a critical juncture. A further slide from here would put into play a long overdue trip to oversold territory (AT50 below 20%). If the bull market remains as strong as ever, then this dip to the mid-30s will act like “oversold enough” and create the next buy-the-dip opportunity. I am staying focused on the bullish possibilities mainly because November begins the seasonally strong period for the market. I will get aggressive if the market actually slips into true oversold territory.
AT200, the percentage of stocks trading above their 200DMAs, managed to avoid closing the week in breakdown territory. Thus, this longer-term indicator for market breadth is flashing in favor of the buyers and bulls…just barely!
The Equities: Breadth’s Edge
Oracle Corporation (ORCL)
Description: Oracle Corporation provides enterprise software, hardware, and cloud solutions that help businesses manage data, applications, and infrastructure. The company’s cloud platform and database products serve enterprises across a wide range of industries.
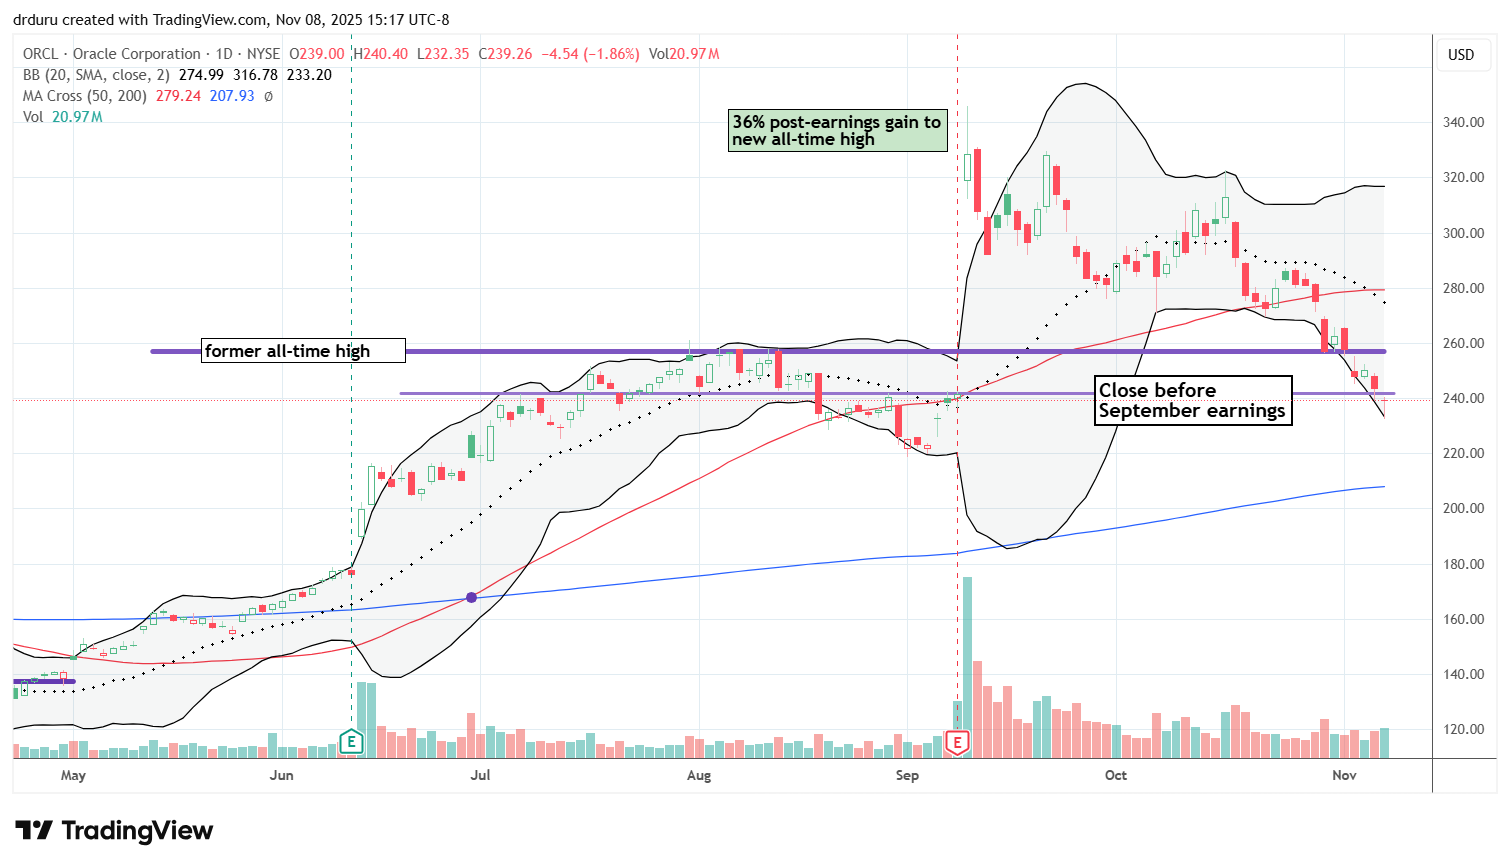
Technical status: ORCL finished reversing its entire 36% post-earnings gain from September. With the stock also below its former all-time high, below its 50DMA, and below a declining 20DMA, ORCL is suddenly deep in bearish territory.
Trade commentary: I am on AI “bubble” alert given ORCL’s reversal of fortunes plus the market’s compliance with Burry’s AI bubble trade. I warned just a week ago that ORCL could be the leading signal of a (short-term) top in big cap tech. Thus, I completed a bearish trade in ORCL after it slipped below its former all-time high. Now, I have this stock on my list as a hedge against my bullishness on my select AI-related stocks.
JFrog Ltd (FROG)
Description: JFrog Ltd offers a DevOps platform that automates the process of building, managing, and delivering software releases. Its products enable continuous software delivery by streamlining updates and enhancing security across development pipelines.
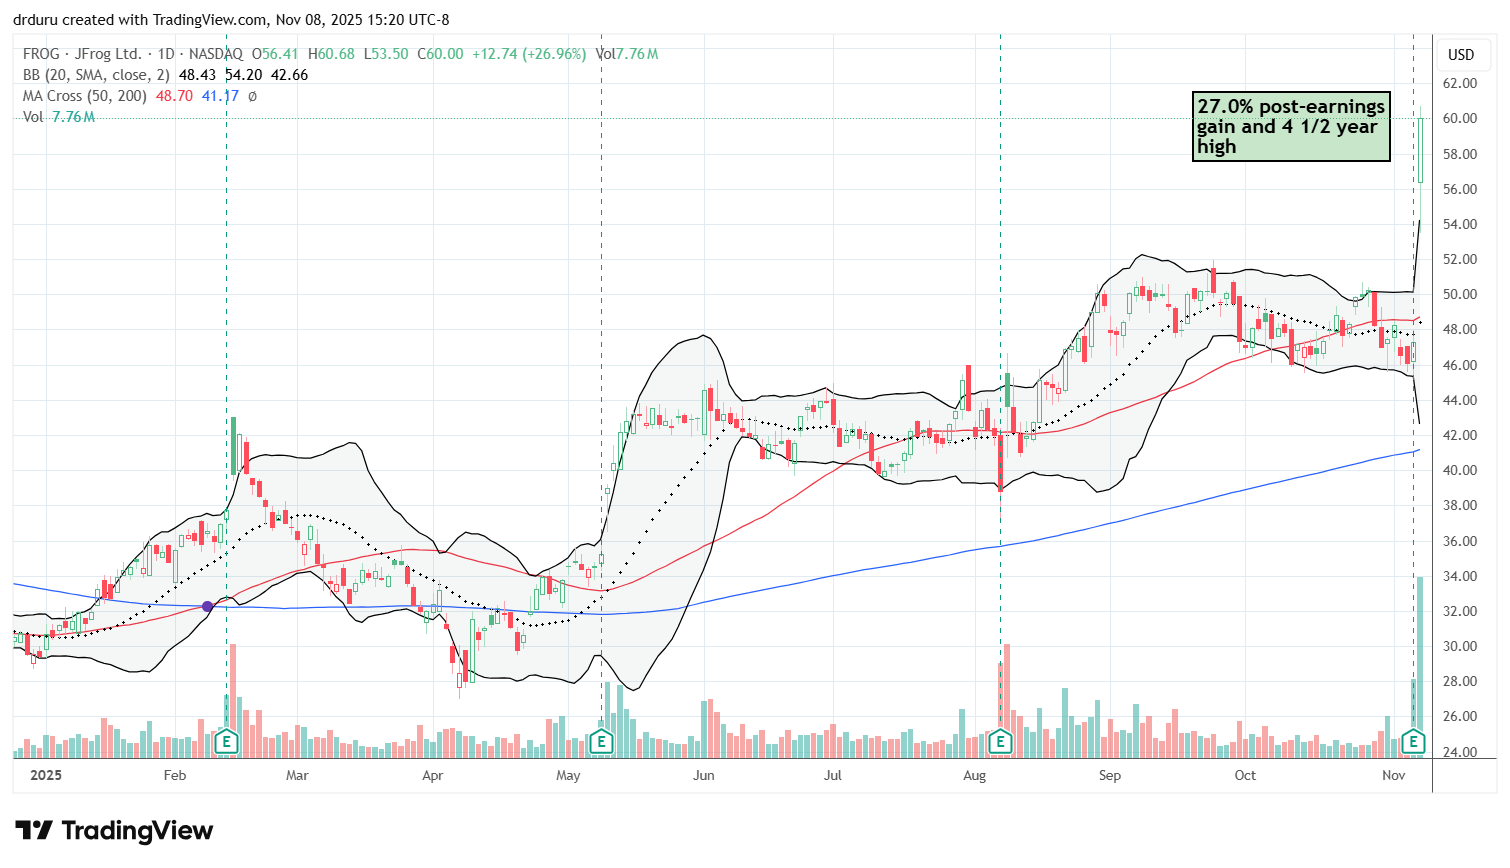
Technical status: A 27.0% post-earnings surge took FROG to a 4½-year high. The stock is now over-extended above its upper Bollinger Band (BB).
Trade commentary: I let FROG slip from my radar after its breakdown in March. I am long-term bullish on this company after writing about their business several years ago. It is time for me to put FROG back on my buy-the-dip list.
Duolingo, Inc (DUOL)
Description: Duolingo, Inc operates an online learning platform focused on language education through mobile and web-based applications. The company monetizes its platform through subscriptions, advertising, and language proficiency testing.
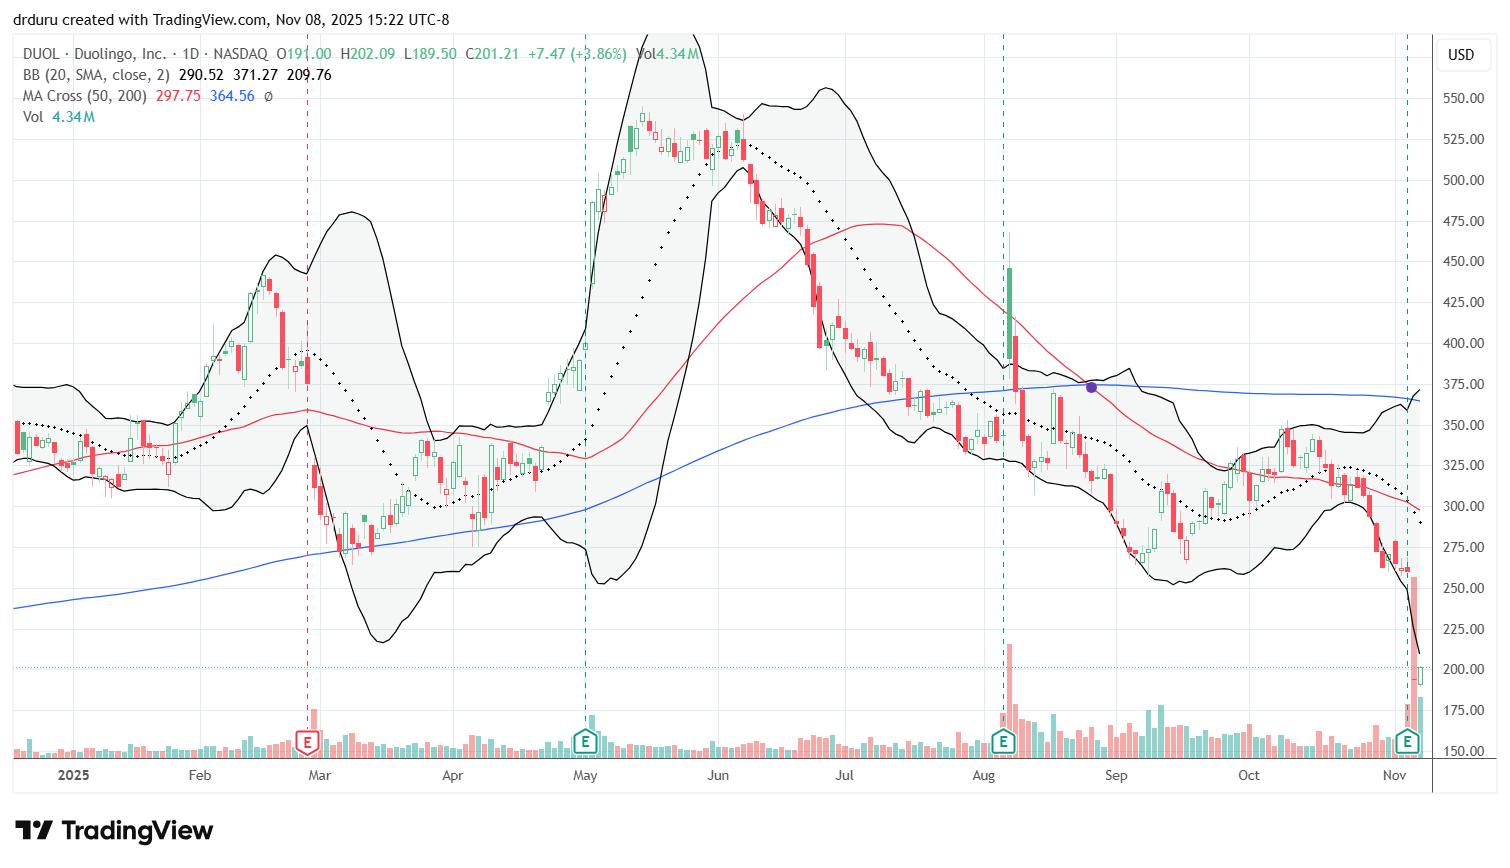
Technical status: Months of technical pressure proved too much for DUOL. The stock collapsed 25.5% post-earnings and closed the week at a 14-month low.
Trade commentary: DUOL remains a no-touch for me. At the beginning of September I lamented that I could not determine a good risk/reward trade (bearish or bullish), and I still cannot. However, last week’s post-earnings collapse confirms the bubble (I described it earlier) in DUOL has popped and the stock has topped for some time to come if not permanently.
Fortinet, Inc (FTNT)
Description: Fortinet, Inc is a global cybersecurity company offering broad, integrated, and automated security solutions. Its flagship FortiGate firewalls and related software protect enterprise networks and cloud environments from cyber threats.
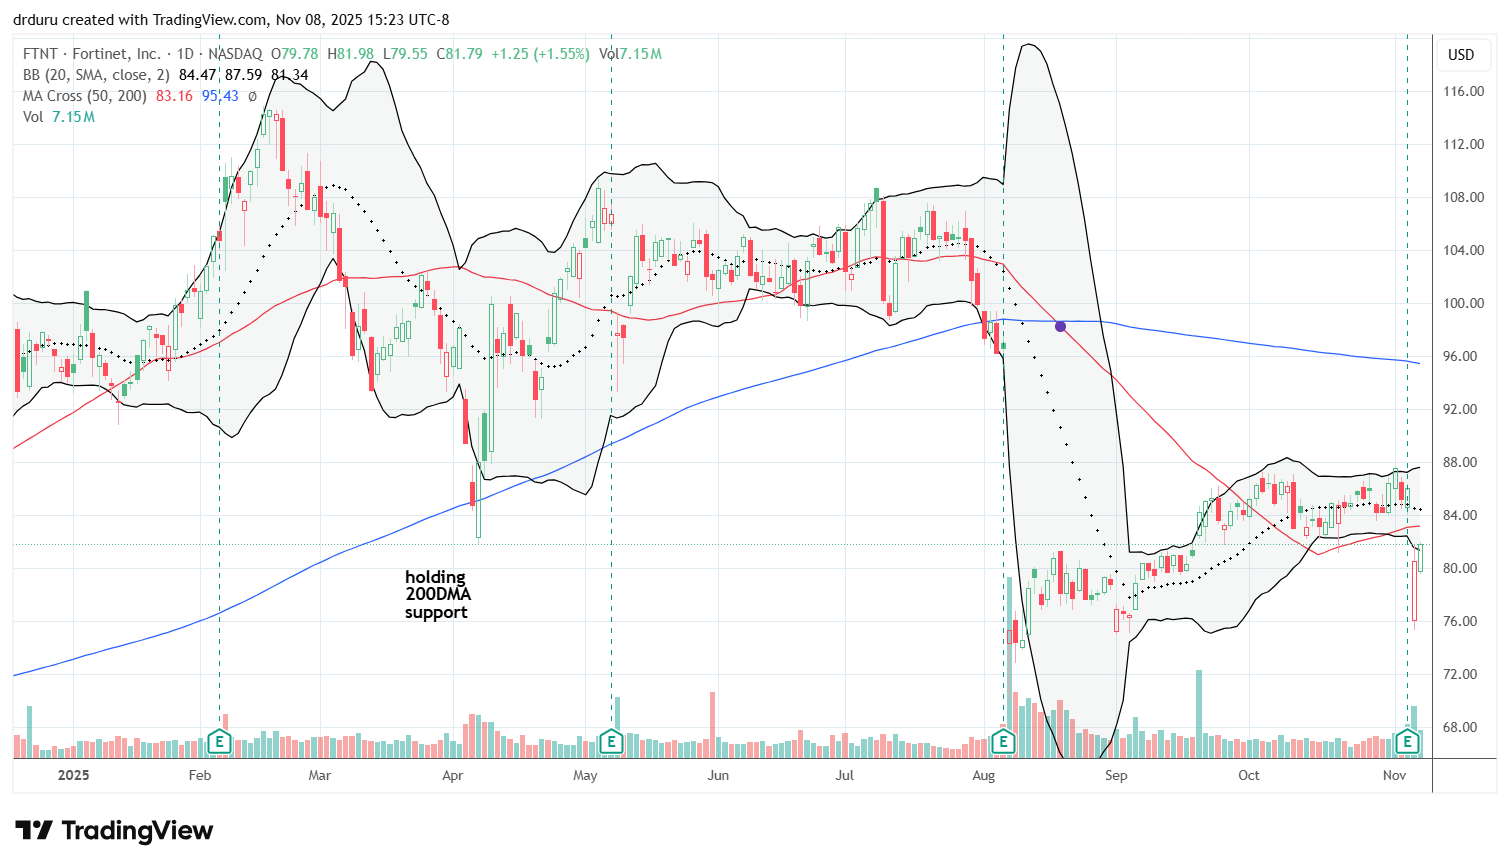
Technical status: FTNT suffered a 6.4% post-earnings loss last week. However, buying that started from the intraday low carried into Friday for a 1.6% gain. So while FTNT is in bearish territory below its 50DMA, buyers look prepared to challenge resistance.
Trade commentary: FTNT printed an impressive and picture-perfect defense of 200DMA support in April. In a little over 3 months, FTNT confirmed a 200DMA breakdown ahead of a 22.0% post-earnings collapse. Thus, I consider FTNT to be a broken stock: a no touch for me unless I see a compelling setup for a short like a failed test of 50DMA resistance.
CDW Corporation (CDW)
Description: CDW Corporation provides technology products and services to business, government, education, and healthcare clients. Its offerings include hardware, software, cloud solutions, and professional IT services from major technology vendors.
Technical status: CDW lost 8.5% post-earnings and ended the week at a near 5-year low after closing below its April low.
Trade commentary: CDW flashed an early warning about IT spend a year ago. However, given the overall sector’s buoyancy from AI-related spend, CDW now looks more like the odd stock out. The stock still looks like a short and could be a good hedge (pairs trade) against trading AI-related stocks. If I short the stock, I will place a tight stop above the previous low from April (see the chart below).
")
Cogent Communications Holdings, Inc (CCOI)
Description: Cogent Communications Holdings, Inc provides high-speed internet access and data transport services through its global fiber-optic network. The company serves corporate and carrier customers in North America, Europe, and Asia.
Technical status: CCOI suffered from a 34.9% post-earnings crash, hitting its lowest point since 2013. The stock reconfirmed a 50DMA downtrend.
Trade commentary: CCOI must be in a dying networking/communications segment. The company is clearly not benefiting enough from supporting AI-related connectivity needs. The stock is yet another example of the dangers on betting against a downtrend, especially one that is exactly the inverse of the general market. The company’s reduction in the dividend and termination of a share buyback plan send danger signals and make the stock even less attractive. I have zero interest in trying to bottom-fish here even with the stock around a 12-year low. The 13.4% short interest is high enough to keep me from shorting the stock, yet it seems to validate the on-going (secular) decline in the stock.
")
Roblox Corporation (RBLX)
Description: Roblox Corporation operates an online entertainment platform that allows users to create, share, and play games developed by other users. The company earns revenue through in-game purchases of its virtual currency, Robux.
Technical status: RBLX broke down below its 50DMA after a 15.5% post-earnings fall, continuing to tumble before barely avoiding a test of 200DMA support.
Trade commentary: If RBLX closes up a second day from Friday’s gain, I will open a speculative trade. I like having 200DMA support as a clear point for a stop-loss. My upside target will be a test of downtrending 20DMA resistance (the dotted line below).
")
Roku, Inc (ROKU)
Description: Roku, Inc operates a television streaming platform that connects viewers to content providers and advertisers. Its devices and operating system enable users to access streaming services while generating revenue from ads and subscriptions.
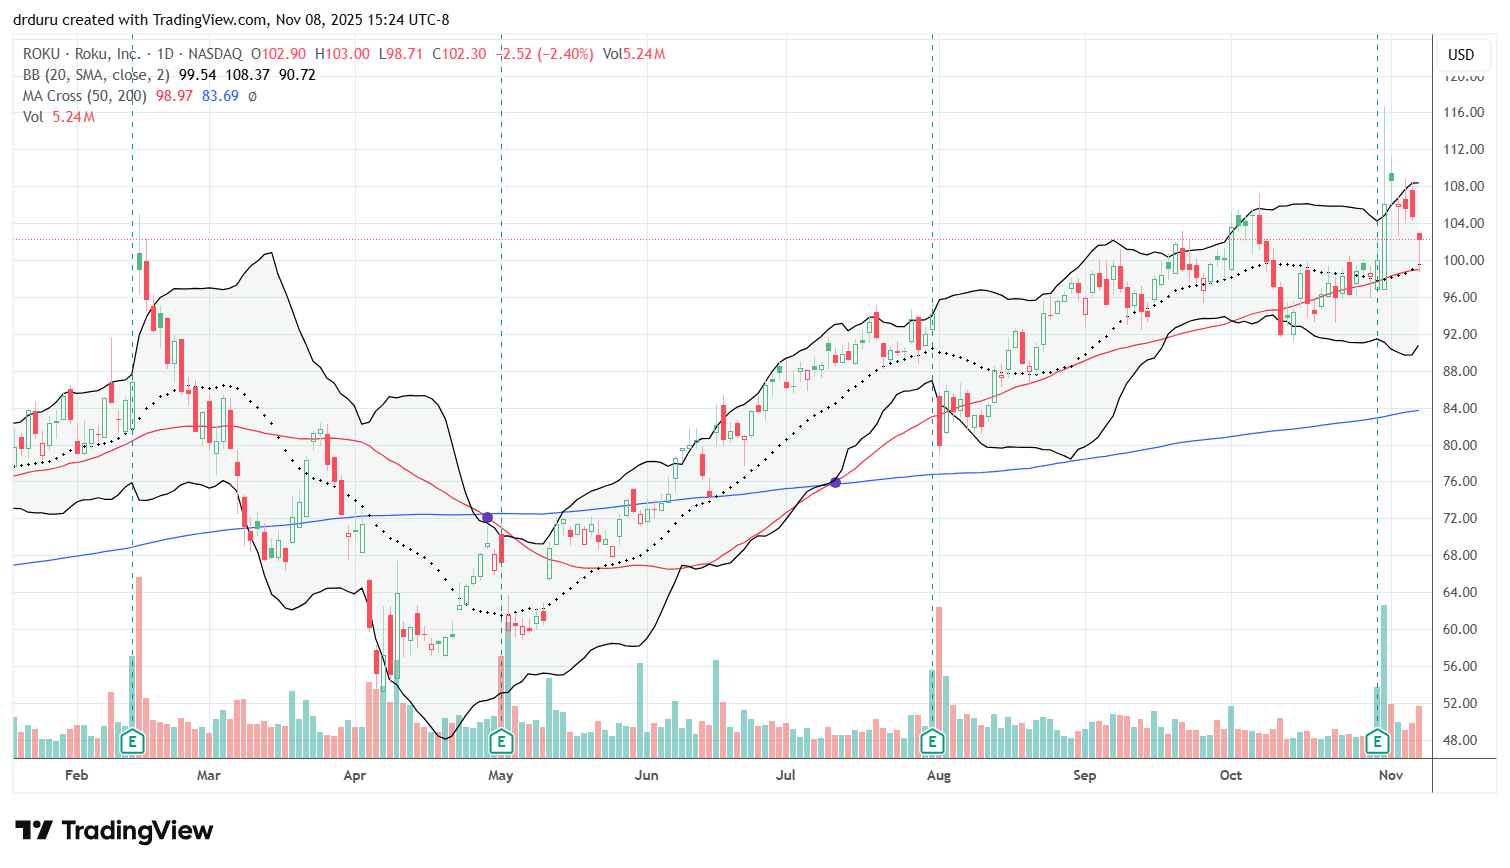
Technical status: ROKU continued to hold 50DMA uptrending support with a 6.1% post-earnings gain. Sellers last week nearly reversed all those gains before buyers defended 50DMA support again.
Trade commentary: The combination of a new high for the year, granted very brief, and another bounce away from the 50DMA, makes ROKU a buy for me. The stock has consolidated for over 3 1/2 years since its pandemic-driven bubble collapsed. So if the current momentum continues, even at this slow pace, ROKU has substantial (speculative) upside potential.
Spotify Technology (SPOT)
Description: Spotify Technology S.A. operates a digital music and podcast streaming platform with free and premium subscription tiers. The company monetizes through advertising and paid subscriptions, serving users globally across devices.
Technical status: SPOT dipped below its 200DMA after a 2.3% post earnings trip.
Trade commentary: I bought SPOT as a (late) long-term play. So I am very disappointed the stock already broke down below its 200DMA trend line (the blue line below), the first such close in almost 3 years. I went ahead and took a small loss and will just wait for SPOT to re-establish its longer-term uptrend before considering a re-entry.
")
Live Nation Entertainment, Inc (LYV)
Description: Live Nation Entertainment, Inc promotes, operates, and manages live music events worldwide. The company owns Ticketmaster and numerous venues, generating revenue from ticketing, sponsorships, and artist management.
Technical status: LYV broke down below its 200DMA after a post-earnings 10.6% decline, hitting its lowest point since June.
Trade commentary: Add LYV to the growing list of suffering consumer-facing stocks. LYV’s 10.6% post-earnings loss on a large miss on expected revenue and earnings closed the stock below its 200DMA for the first time in 14 months. I put this stock on my list of potential shorts, ideally after one more day of gains so that the stock is closer to 200DMA resistance. My stop loss would happen above the 200DMA.
")
Tapestry, Inc (TPR)
Description: Tapestry, Inc is a luxury accessories and lifestyle brand that owns Coach, Kate Spade, and Stuart Weitzman. The company designs and markets handbags, footwear, and other fashion goods worldwide through retail and digital channels.
Technical status: TPR broke down below its 50DMA on a 9.6% post-earnings decline, tumbling towards its 200DMA before attempting to recover with a 5% jump.
Trade commentary: Given the pressure on so many consumer-facing stocks, I am not surprised TPR fell post-earnings. The higher-end consumer is reportedly propping up the U.S. economy, but at some point this fuel will run out….right? TPR may be one of the early signs that even the high-end consumer is starting to stall out. Still, buyers stepped right into the stock above 200DMA support and added 5% on Friday. So sellers still have a lot to prove.
")
DoorDash, Inc (DASH)
Description: DoorDash, Inc operates a logistics platform that connects consumers with local restaurants, grocers, and retailers for delivery and pickup services. The company earns revenue primarily from delivery fees and commissions paid by merchants.
Technical status: DASH broke down below its 200DMA with a post-earnings 17.5% loss. DASH last traded below its 200DMA 16 months ago.
Trade commentary: I am treating DASH as a prototypical consumer-facing stock given it represents the willingness of consumers to pay a premium for convenience. The stock’s earlier struggles holding 50DMA support portended last week’s post-earnings collapse. However, I have an inverse strategy with DASH. Whenever the consumer economy is healthy again, DASH will be a big winner. So I want to accumulate shares over time. Accordingly, I added to my position when the stock hit $200. This move is definitely risky given the bearish breakdown, but just a little while ago I thought I would never get this chance to buy at such a price. Note well that DASH is collapsing off a hard-earned all-time high, thus this damage could last for quite some time.
")
Uber Technologies, Inc (UBER)
Description: Uber Technologies, Inc provides ride-hailing, food delivery, and freight logistics services through its mobile applications. The company operates globally, connecting drivers, riders, and merchants on a single platform.
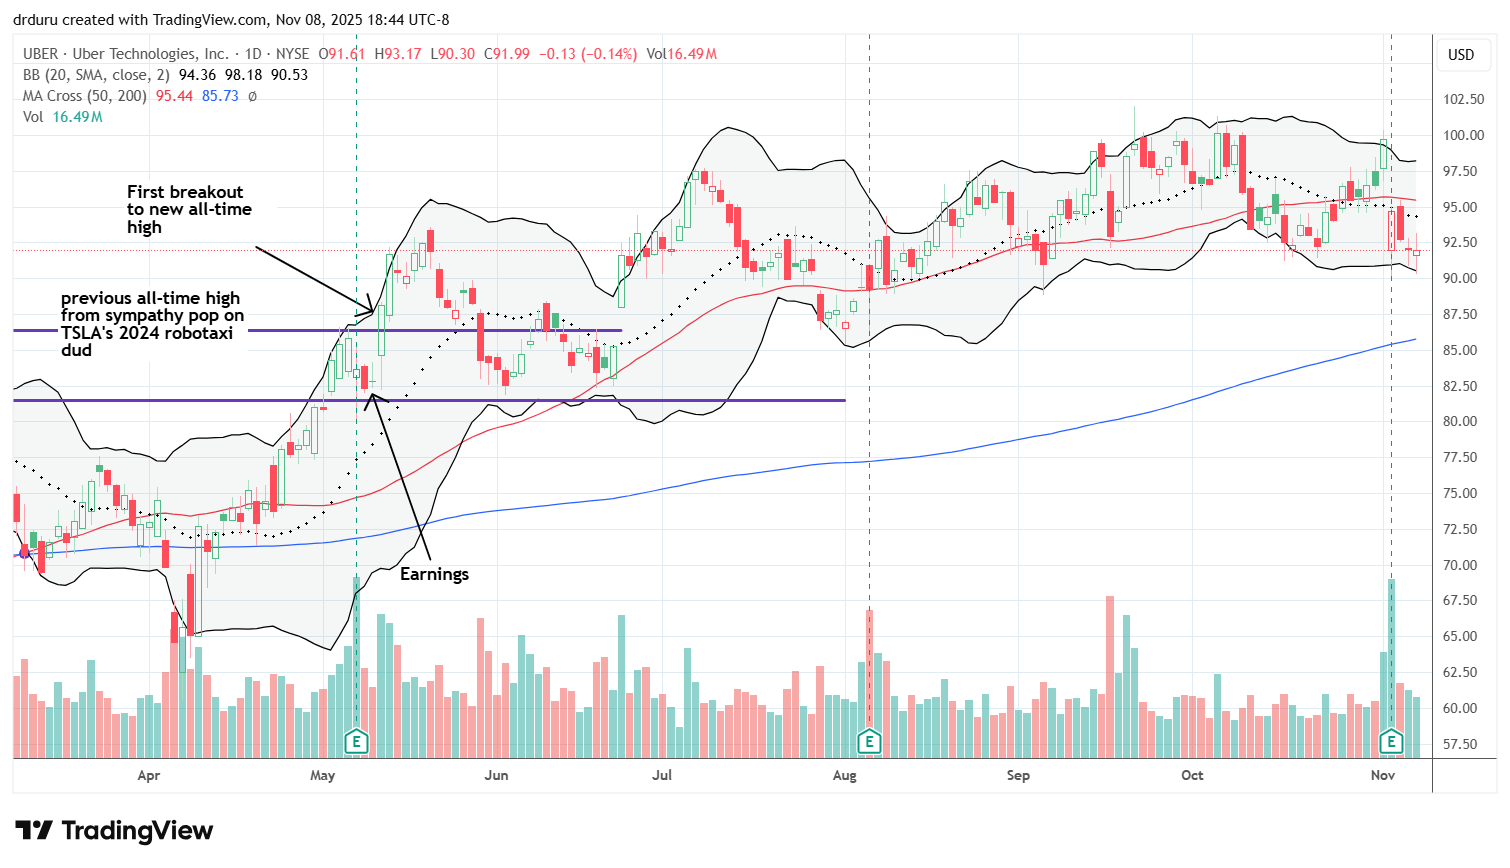
Technical status: UBER lost 5.1% post-earnings. A rebound stopped cold at 50DMA resistance. Thus the stock remains stuck in what is now a 4-month high just under the all-time high.
Trade commentary: As a consumer-facing stock, UBER is hanging in there pretty well. Still, I will not be surprised to see an eventual test of 200DMA support. I jumped back into the stock after the post-earnings loss and sold a call against the position. I will add to my position at lower prices. Three months ago I decided to build a long-term position, but I quickly realized that UBER was in a trading range where I could sell calls against my position. On one of those rounds my position actually got called away.
Royal Caribbean Cruises Ltd (RCL)
Description: Royal Caribbean Cruises Ltd operates a global cruise vacation company under several brands, including Royal Caribbean International and Celebrity Cruises. It offers itineraries to destinations worldwide through its fleet of ships.
Technical status: RCL confirmed a 200DMA breakdown after falling by 7.4% a few days after a 9.6% post-earnings loss.
Trade commentary: Back in March I marveled at RCL’s ability to hold 200DMA support. The eventual breakdown was short-lived. Now the stock has reversed a breakout that started in June. The 200DMA breakdown puts RCL in bearish position. This stock is now a short as long as the consumer-facing economy is under pressure.
")
Denny’s Corporation (DENN)
Description: Denny’s Corporation operates and franchises full-service family dining restaurants under the Denny’s brand. The company serves breakfast, lunch, and dinner items across locations primarily in the United States and internationally.
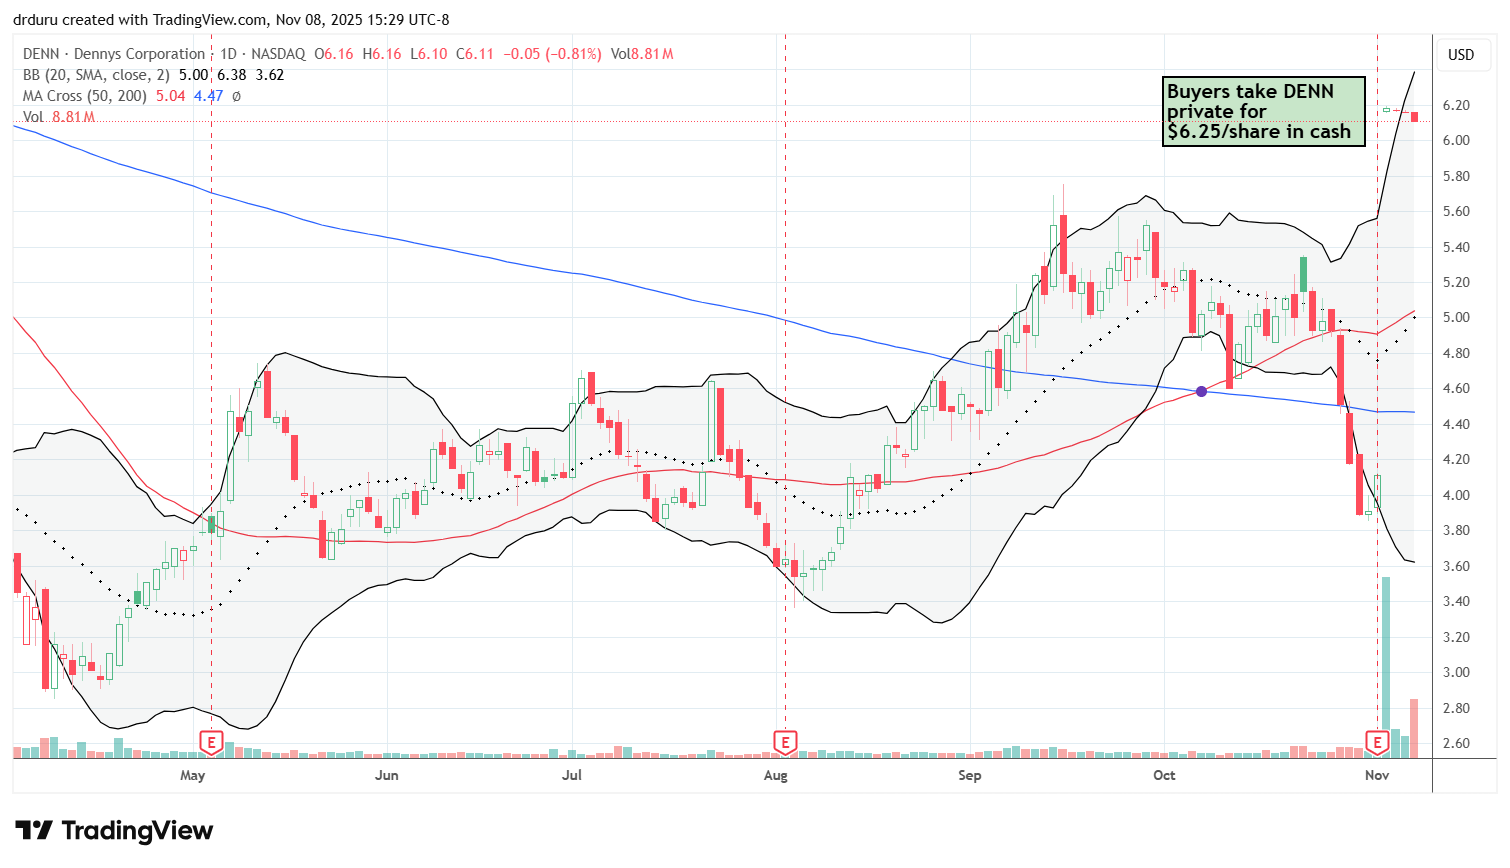
Technical status: DENN went from a bearish position trading under its 50DMA and 200DMA to a major breakout on a buyout offer. DENN’s 50.4% gain only took the stock to a 9-month high.
Trade commentary: DENN reminded shorts the danger of hanging out too long in a languishing stock! While DENN’s acquisition is a major surprise with so many casual dining and fast food companies languishing, the 9-month high on a 50% gain says everything about the damage in this sector. DENN soared for multiple years before hitting an all-time high around $24 just ahead of the pandemic. The stock has not been the same since.
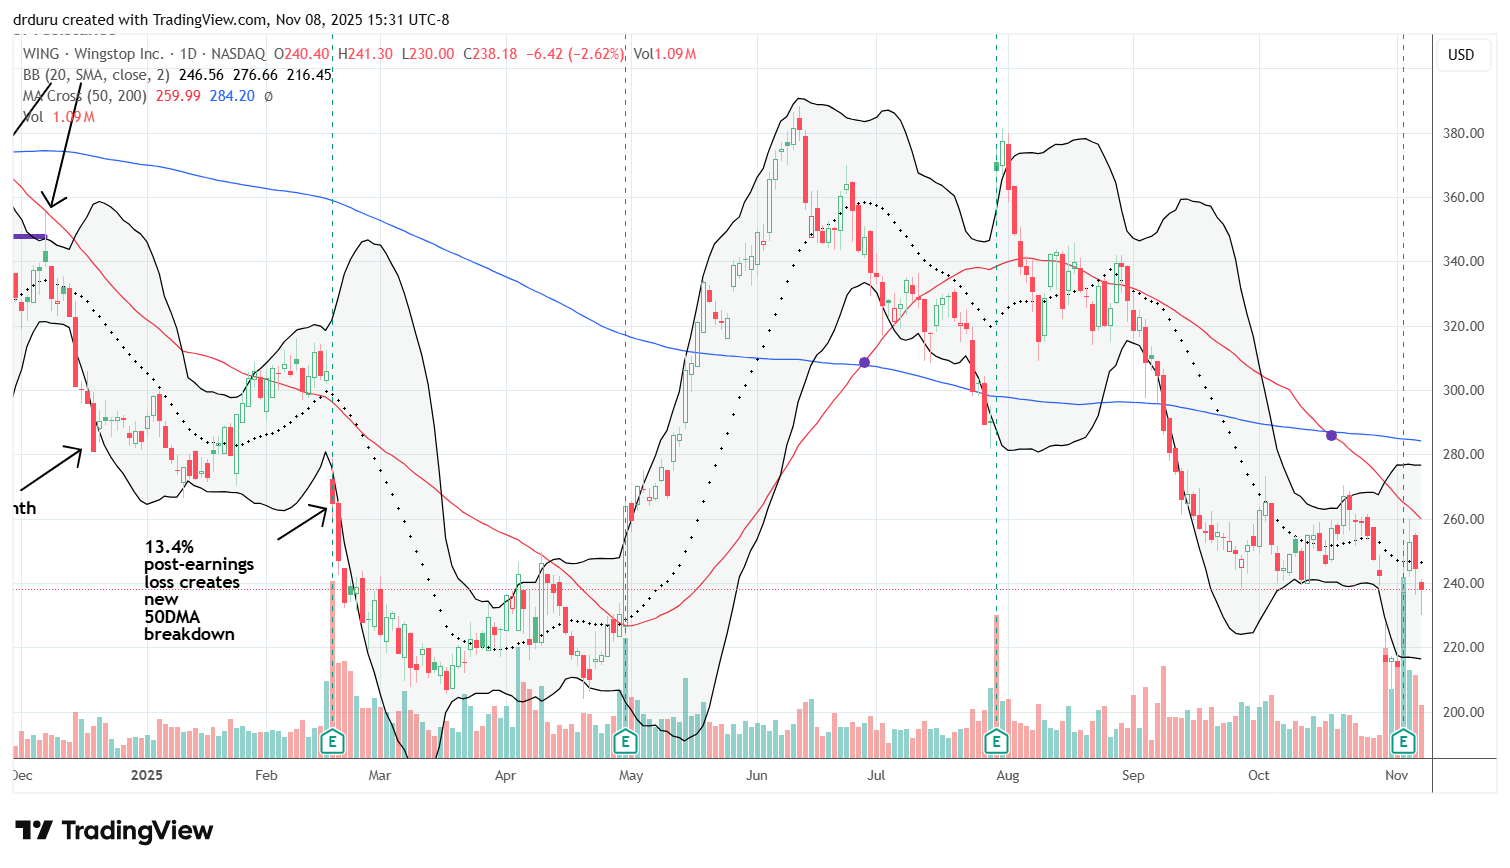
Wingstop (WING)
Description: Wingstop Inc operates and franchises quick-service restaurants specializing in cooked-to-order chicken wings, fries, and sides. The company has grown rapidly through its takeout and digital ordering model.
Technical status: WING gained 10.9% post-earnings and the next day finished reversing earlier losses from sympathy selling in the wake of poor earnings news from Chipotle Mexican Grill (CMG).
Trade commentary: WING fell 11.1% in sympathy with the poor response to Chipotle’s earnings on October 30. Given the stock’s post-earnings rebound and ability to hold the April lows as support, I am concluding that sympathy selling exhausted motivated sellers…for now. Buyers still have a lot to prove with the downtrending 50DMA and 200DMA resistance looming overhead.
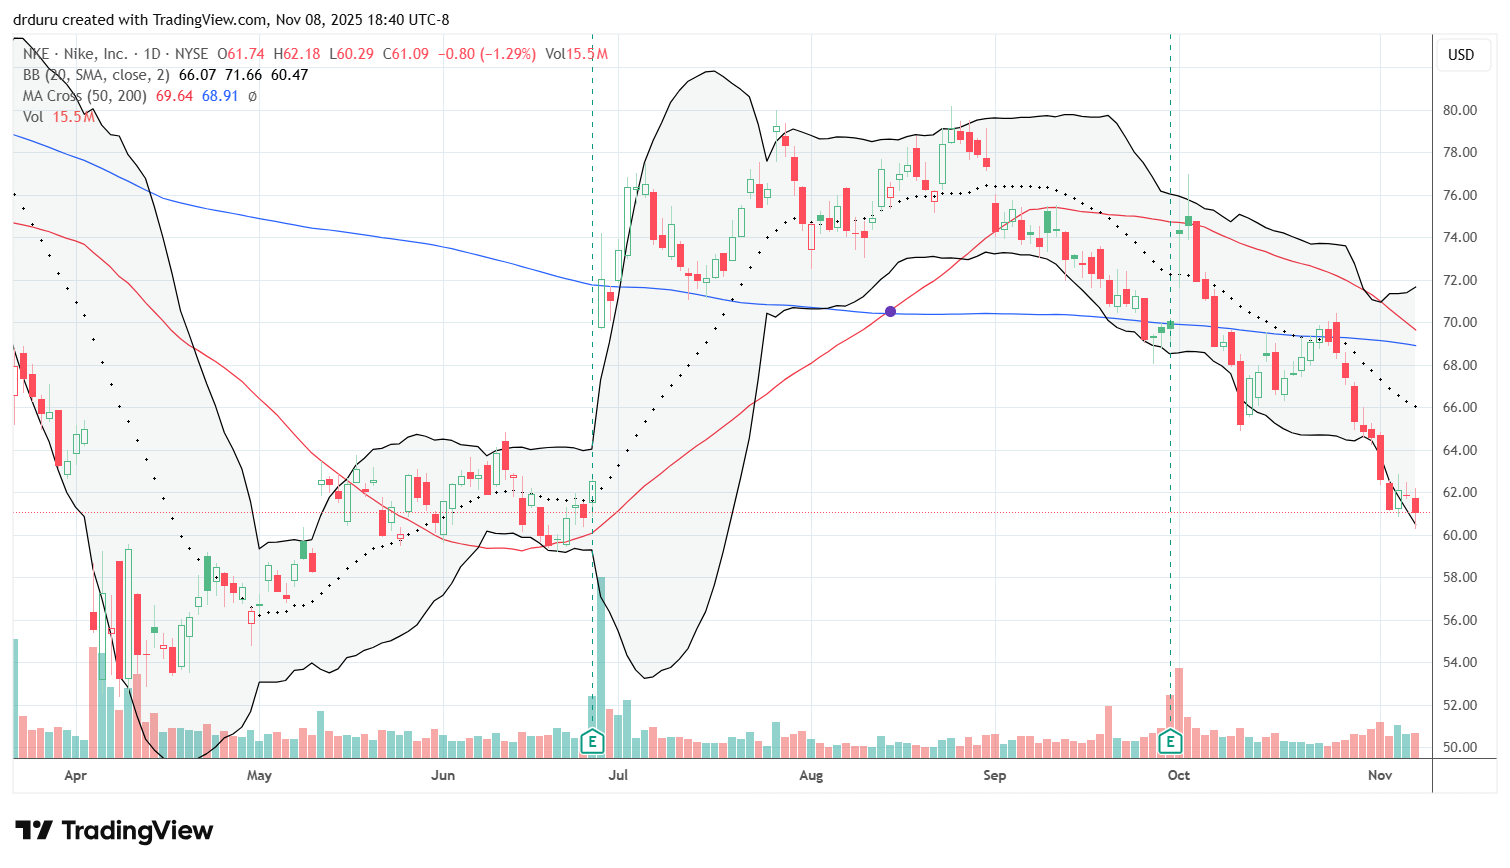
Nike, Inc (NKE)
Description: Nike, Inc designs, develops, and markets athletic footwear, apparel, equipment, and accessories worldwide. The company’s products are sold under the Nike, Jordan, and Converse brands through retail, wholesale, and digital channels.
Technical status: Nike (NKE) last traded this low just ahead of its June earnings-driven surge. The stock is bearish with all its major trendlines pointing downward.
Trade commentary: NKE returned to bearishness shortly after a post-earnings relief bounce. Last week, NKE further confirmed its bearishness by completing a reversal of its June post-earnings gains. I opened a Nov/Dec 62.5 calendar put spread in the prior week.
Steven Madden, Ltd (SHOO)
Description: Steven Madden, Ltd designs, sources, and markets fashion-forward footwear, accessories, and apparel. The company sells its products through wholesale, retail, and e-commerce channels under multiple owned and licensed brands.
Technical status: SHOO managed to confirm 50DMA support with a 13.6% post-earnings gain as it tries to recover losses for the year.
Trade commentary: While Nike sinks, Steven Madden is, surprisingly, recovering. Apparently, strong guidance encouraged investors. However, this strong guidance sets up SHOO for a major test in its next earnings. If the consumer-facing economy is still under pressure at that time, investors could suffer deep disappointment in SHOO’s actual results.
")
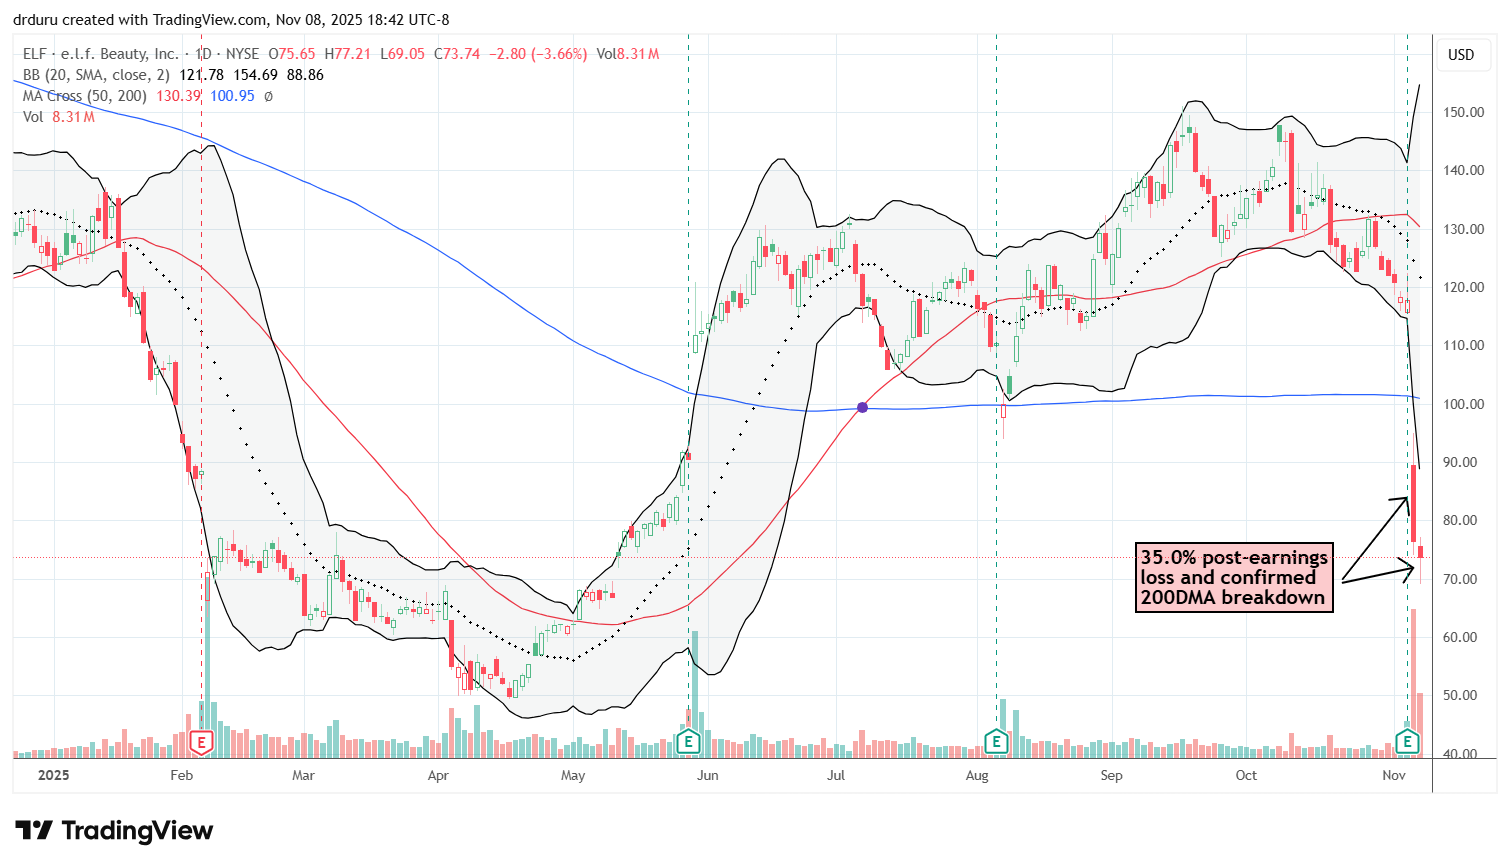
e.l.f. Beauty, Inc (ELF)
Description: e.l.f. Beauty, Inc develops and markets cosmetics and skincare products sold through retail and digital channels. The company emphasizes affordable, cruelty-free products and rapid innovation cycles.
Technical status: ELF plunged 35.0% post-earnings and the next day confirmed a 200DMA breakdown. The stock now trades at a 6-month low.
Trade commentary: You got it – yet one more consumer-facing company suffered mightily post-earnings. This consistent weakness is helping to weigh down market breadth even as the major indices cling to uptrends.
Celsius Holdings, Inc (CELH)
Description: Celsius Holdings, Inc develops and markets fitness and energy drinks designed to accelerate metabolism and provide sustained energy. Its beverages are sold globally through retail, convenience, and fitness channels.
Technical status: CELH crashed 24.8% post-earnings and slid another 7.9% with a 200DMA breakdown and 5-month low.
Trade commentary: Until last week’s collapse, CELH looked like it was on its way to regaining the lofty status it held on its way into a double-top in 2024. Now, having fallen far short of those heights, CELH looks like a broken and topped out stock, especially as a consumer-facing stock. I have no interest in shorting the stock, but I will keep an eye out for a convincing close above its 200DMA.
")
Six Flags Entertainment Corporation (FUN)
Description: Six Flags Entertainment Corporation operates regional theme and water parks across North America. The company generates revenue from admissions, food, merchandise, and season pass sales.
Technical status: FUN broke down below its 50DMA, and fell further after earnings to a new low since the pandemic.
Trade commentary: While suffering along with so many consumer-facing stocks, I have my eye on FUN thanks to bullish interest from Jana Partners and NFL player Travis Kelce. I did not jump on the news given my recent memory of how a big investor’s stake in Novo Nordisk (NVO) turned out to be a false signal. FUN now approaches a major test of its pandemic low, so I am content to wait for an entry signal from the stock.
")
Cleveland-Cliffs Inc (CLF)
Description: Cleveland-Cliffs Inc is a vertically integrated steel producer and supplier of iron ore pellets in North America. The company serves end markets such as automotive, construction, and manufacturing with steel products and raw materials.
Technical status: CLF broke down below its 50DMA after the company sold 75 million shares, falling further before confirming 200DMA support.
Trade commentary: What a turn of events for CLF since the company excited investors with talk about exploring rare earths during its last earnings report. The earlier 75M share offering laid bare the company’s attempt to push shares much higher ahead of the offering (to get a better price?). Now I am watching CLF’s test of 200DMA support for a potential entry. I want to see buyers close the stock higher one more day…
")
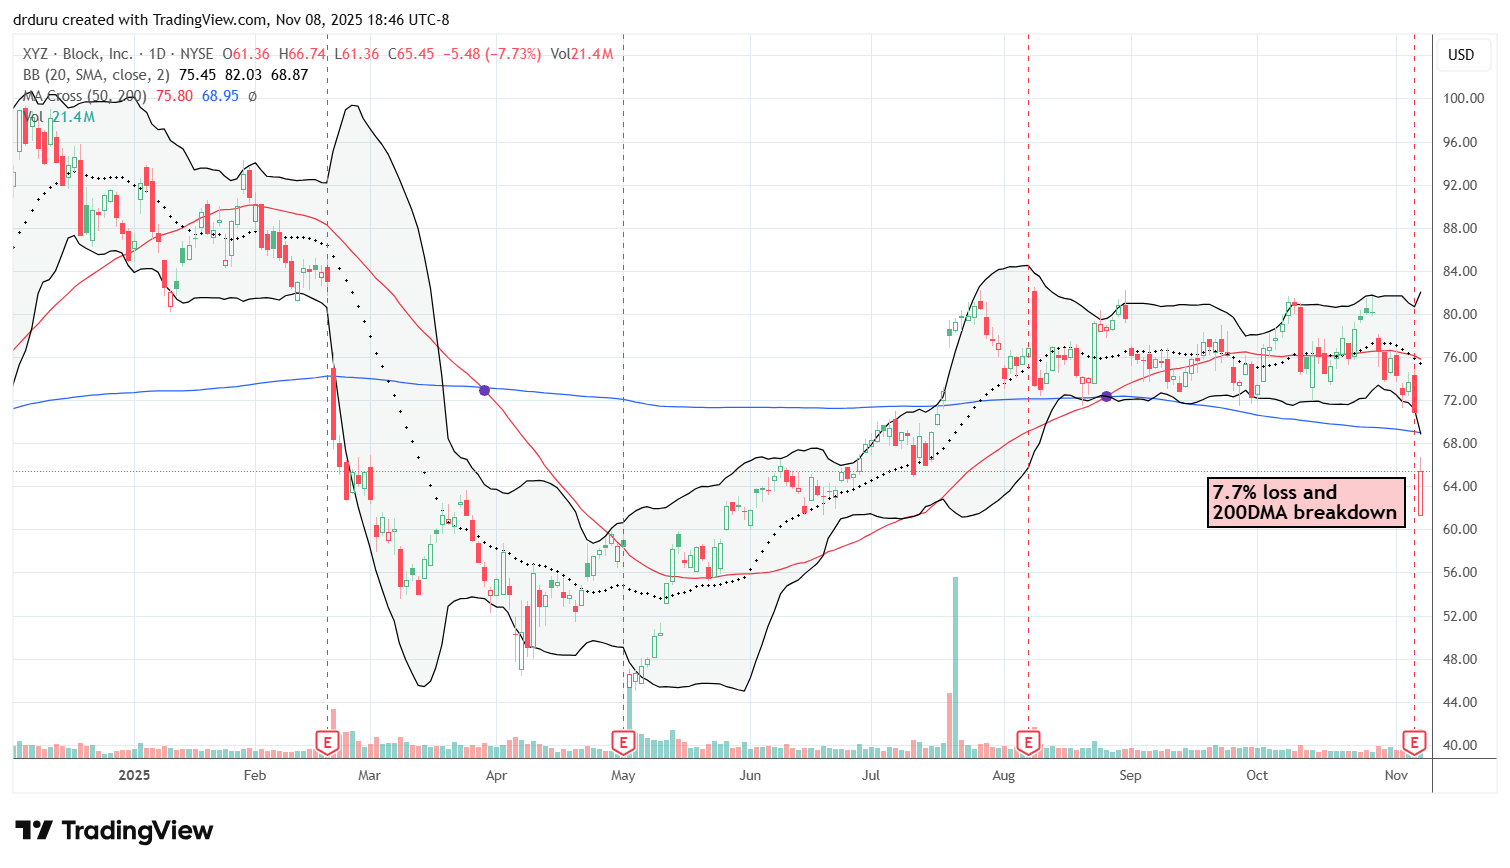
Block, Inc (XYZ)
Description: Block, Inc (formerly Square) provides financial technology solutions, including payment processing, business tools, and the Cash App peer-to-peer payments platform. The company also owns the music streaming service Tidal and focuses on blockchain-based innovation.
Technical status: META dropped 11% post-earnings, slicing through its 200DMA support after committing to extra capital investments in AI.
Trade commentary: After META flipped short-term bearish, I decided not to trade the stock. This latest breakdown confirms a top after months of resistance near its former highs. The “gap and crap” from the previous pop to an all-time high looms large as the beginning of an extended topping pattern….and a theme for a number of big cap tech stocks.
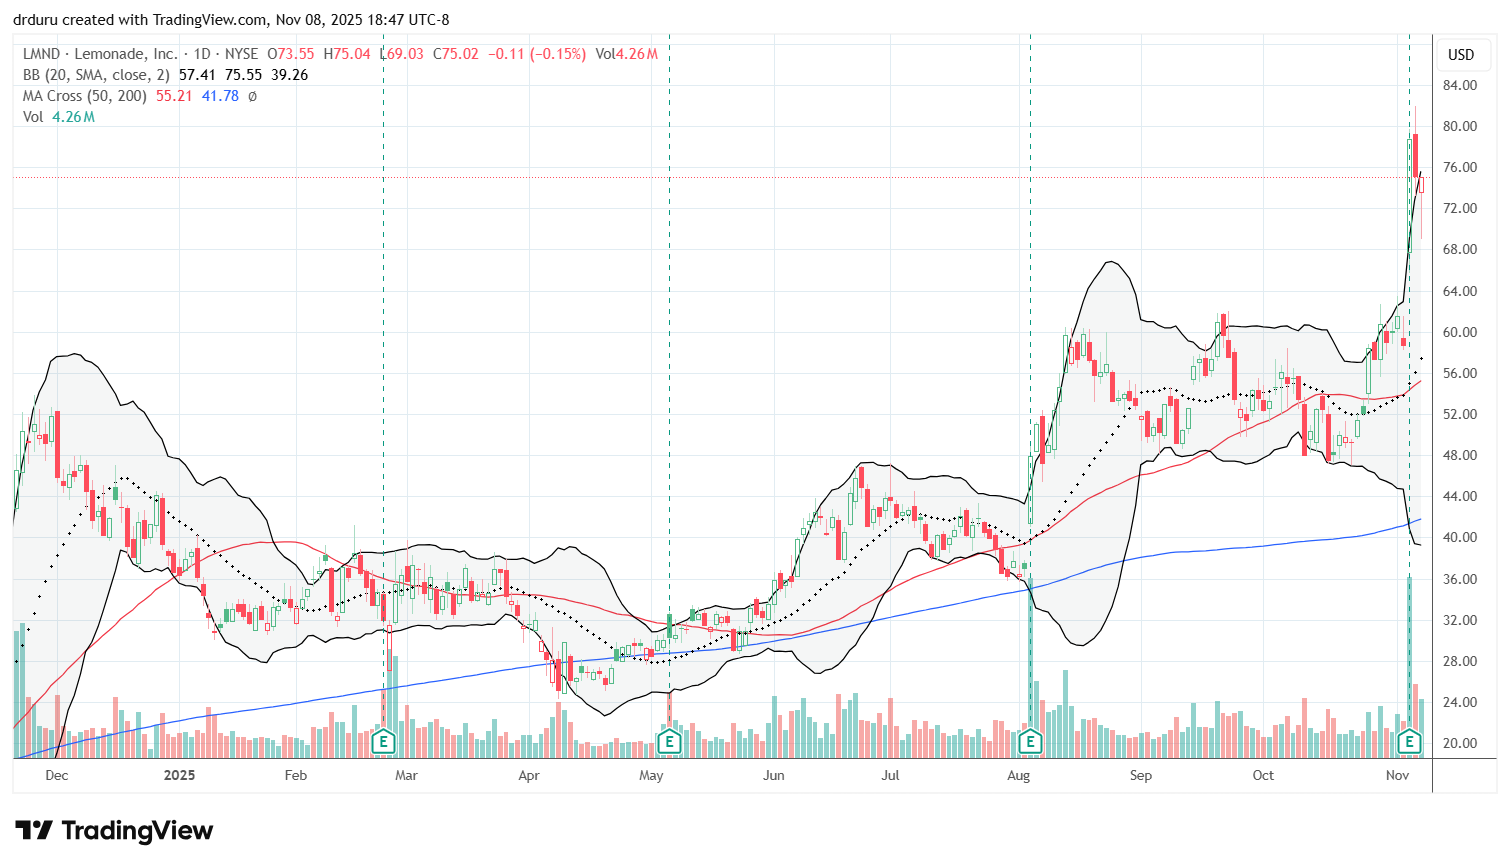
Lemonade (LMND)
Description: Lemonade, Inc is a digital insurance company that uses artificial intelligence and behavioral economics to offer renters, homeowners, life, pet, and car insurance. The company operates primarily through a mobile app with an emphasis on automation and transparency.
Technical status: LMND surged 34.2% post-earnings to a 4-year high.
Trade commentary: LMND defied the overwhelming weakness in consumer-facing stocks. A small increase in guidance seemed to do the trick. However, with a 21% short interest in the stock, I suspect a squeeze was also at work in sending the stock so much higher. LMND could easily reverse last week’s gains in due time if indeed a short squeeze were mostly at work in these price dynamics.
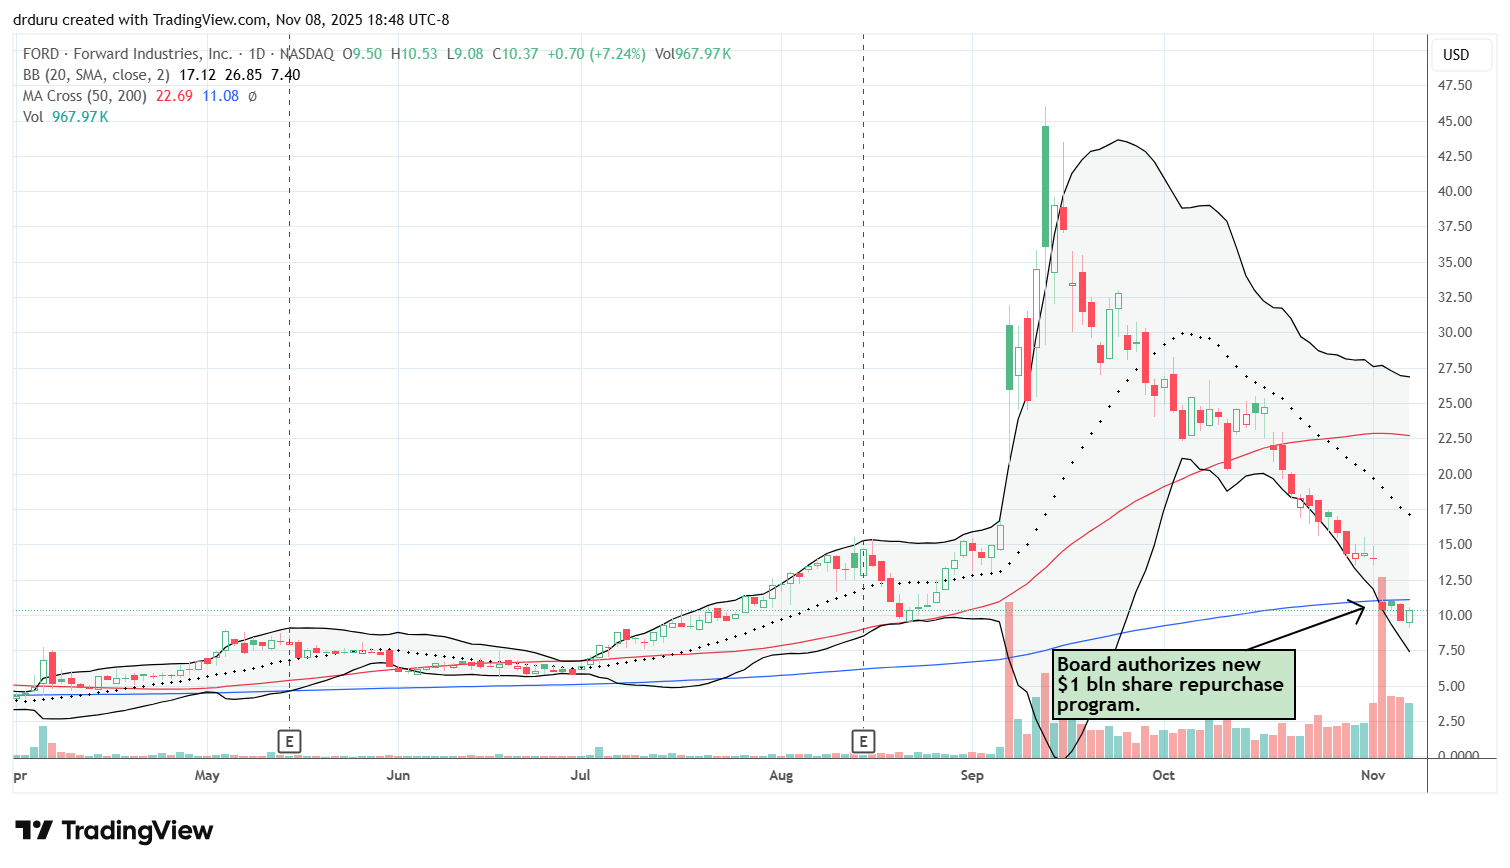
Forward Industries, Inc (FORD)
Description: Forward Industries, Inc designs, manufactures, sources, and distributes carrying cases and protective solutions for medical diagnostic devices and consumer electronics. The company operates through its OEM Distribution and Design segments and serves global clients across several industries.
Technical status: FORD confirmed a 200DMA breakdown despite the company’s announcement of a $1B share buyback program. The stock’s collapse from a September surge only brings FORD to a 3-month low.
Trade commentary: Forward Industries created a lot of excitement after announcing it secured $1.65B to launch a Solana (SOL/USD) treasury operation. Like so many other companies switching to or adding treasury operations, the stock soared on the news. FORD gained 58.7% on the first day and eventually gained another 50% before fading sharply…as just about every other recent treasury company. It is telling that the stock zipped right by its price level just before the announcement of the treasury operations.
While the company’s announcement of a major share repurchase plan should inject fresh investor excitement, the effort siphons away a major source of cash to buy SOL cryptocurrency. Thus, it is no longer clear how exactly the company will provide a return to the investors who provided the $1.65B in financing. The company only earned $30.2M in revenue last year and has been unprofitable 5 of the last 6 years.
")
")
Be careful out there!
Footnotes
Subscribe for free to get email notifications of future posts!
“Above the 50” (AT50) uses the percentage of stocks trading above their respective 50-day moving averages (DMAs) to measure breadth in the stock market. Breadth defines the distribution of participation in a rally or sell-off. As a result, AT50 identifies extremes in market sentiment that are likely to reverse. Above the 50 is my alternative name for “MMFI” which is a symbol TradingView.com and other chart vendors use for this breadth indicator. Learn more about AT50 on my Market Breadth Resource Page. AT200, or MMTH, measures the percentage of stocks trading above their respective 200DMAs.
Active AT50 (MMFI) periods: Day #102 over 20%, Day #100 over 30% (overperiod), Day #4 under 40% (underperiod), Day #9 under 50%, Day #33 under 60%, Day #75 under 70%
Source for charts unless otherwise noted: TradingView.com
Full disclosure: long IWM shares and calls, long SPY put spreads, long NKE calendar put spread, long DASH, long UBER shares and short a call option
FOLLOW Dr. Duru’s commentary on financial markets via StockTwits, BlueSky, and even Instagram!
*Charting notes: Stock prices are not adjusted for dividends. Candlestick charts use hollow bodies: open candles indicate a close higher than the open, filled candles indicate an open higher than the close.
* Blog notes: this blog was written based on the heavily edited transcript of the following video that includes a live review of the stock charts featured in this post. I used ChatGPT to process the transcript.
Seems to me it’s hard to untangle the effects of the government shutdown, the AI bubble, and risk of a consumer-led recession (due primarily to wildly varying tariffs causing inflation by disrupting global supply chains).
Definitely hard to untangle, but very telling how hard the AI-related stocks got hit last week shortly after Burry’s disclosure.