

Stock Market Commentary
A bearish engulfing top pattern in the S&P 500 now seems like a distant memory. Yet, the melt-up in the stock market faces a new test. Just as the stock market enters its most dangerous months of the year in terms of drawdowns, a bearish divergence has emerged with market breadth. What looked like a fresh breakout for market breadth quickly reverted into slippage away from the on-going uptrend for the major indices. Given the market remains well-supported and in bullish mode, I am not worrying about the bearish divergence…at least not until the emergence of a new technical indication of a top. I see no reason to make guesses projecting a top in the middle of a melt-up.
Last week was full of a flurry of earnings news along with more trade and tariff news that the U.S. stock market largely ignored. Some traders were even too busy chasing the latest meme mania (hello DORK – DNUT, OPEN, RKT, and KSS) to notice the news. The rest of us are looking ahead to the upcoming Federal Reserve meeting and the likely questions Powell will get about more escalating tensions with the President and his administration. The market expects no rate cut and sticky inflation news has hopes fading for a September rate cut. Still, some dissent from the voting members, especially from Christopher Waller, could add material intrigue to the meeting and questions from the press corps.
The Stock Market Indices
S&P 500 (SPY)
The S&P 500 climbed every single day, invalidating the bearish engulfing top signal from July 17 (see chart below). I am fond of noting that the invalidation of a technical top clears the way for a fresh run-up. This setup worked out for the S&P 500 as the path of least resistance continues to point higher. Still, the bearish divergence with market breadth means that I remain on watch for the next technical sign of a top.
")
NASDAQ (COMPQ)
The NASDAQ has steadily crept higher ever since the June 24th breakout and looks even better than the S&P 500.
")
iShares Russell 2000 ETF (IWM)
IWM is also in melt‑up mode but with choppy price action. The ETF of small-cap stocks closed the week flat around $224.38, holding its uptrend off 20DMA support. I bought a calendar call spread at the $225 strike. I am now riding the long side going into Fed week.
")
The Short-Term Trading With A Bearish Divergence
- AT50 (MMFI) = 69.5% of stocks are trading above their respective 50-day moving averages (first overbought day)
- AT200 (MMTH) = 54.8% of stocks are trading above their respective 200-day moving averages
- Short-term Trading Call: cautiously bullish
AT50 (MMFI), the percentage of stocks trading above their respective 50DMAs, closed the week just under the overbought threshold at 70%. When AT50 popped above 70% in the middle of the week, I thought the melt-up rally received much needed confirmation from market breadth. Instead, a market breadth divergence began as my favorite technical indicator dipped below the overbought line as the S&P 500 and the NASDAQ continued their regularly scheduled programming.
AT200 (MMTH), the percentage of stocks trading above their 200DMAs, painted an even clearer divergence. It popped above a trendline I marked from the last time the S&P 500 hit all-time highs earlier in the year, and partnered with AT50 to confirm the midweek strength. But just as quickly, AT200 fell back. So now I have a double confirmation of a bearish divergence: the indices are setting new highs, but market breadth is slipping. Still, this bearish divergence is not actionable. The market is in melt-up mode, and in these kinds of environments, I do not dare try to time a top.
The Equities: Bearish Divergence
GoPro, Inc (GPRO)
Description: GoPro makes wearable action cameras for adventure and sports enthusiasts.
Technical status: GPRO spiked from around $1 to $2.30, then plunged back toward $1.50—a textbook gap‑and‑crap pattern.
Trade commentary: GPRO is a classic, highly speculative renter stock. Unless a catalyst appears, I expect a continued fade over time. The gap and crap from $2.30 to $1.54 likely exhausted the most enthusiastic speculative buyers as a near triple in three trading days was begging for profit-taking.
International Business Machines (IBM)
Description: IBM is a global enterprise technology and consulting company offering cloud and AI solutions.
Technical status: Post‑earnings, the stock dropped 7.6% and fell below its 50‑day moving average (DMA) before finding buyers near intraday lows for two straight trading days.
Trade commentary: IBM is a potential buy on the first close higher after earnings with a targeted rebound back to its 50DMA. On a longer time frame, a test of the 200DMA could offer another buying opportunity.
")
Intuitive Surgical, Inc (ISRG)
Description: Intuitive Surgical develops robotic surgical systems including the da Vinci platform.
Technical status: ISRG gapped up post‑earnings but faded for a 1.8% loss on the day.
Trade commentary: I had to exit – ISRG is mildly bearish after failing at important 200DMA resistance and closing below the intraday low of the Deutsche downgrade. I am now watching for a close above the converging 50 and 200DMAs before reentering. ISRG was supposed to be a long-term investment, but I cannot ignore this bearish price action. I will consider the stock again on a fresh bullish breakout.
CMG (Chipotle Mexican Grill)
Description: Chipotle operates fast‑casual restaurants offering Mexican cuisine across North America.
Technical status: Shares jumped 2.2% on Friday, but CMG is now officially a broken stock after a 13.3% post-earnings loss and 18-month low.
Trade commentary: I added shares cautiously, treating CMG as a long‑term hold. I expect to be happy years out that I stuck with CMG and added shares at these prices.
ASML Holding, N.V. (ASML)
Description: ASML manufactures advanced photolithography systems used in semiconductor fabrication worldwide.
Technical status: ASML dropped 8.3% post‑earnings, broke below its 50DMA and failed at resistance at its 200DMA.
Trade commentary: ASML is in a bearish position. I am tempted to short ASML, but I am wary of semiconductor volatility.
")
Uber Technologies, Inc (UBER)
Description: Uber operates ride‑hailing, delivery, and freight services globally.
Technical status: UBER is holding 50DMA support after a previous breakout.
Trade commentary: I bought more shares and traded around my core position with a call spread. I remain optimistic and monitor whether UBER decouples from TSLA‑linked volatility.
Toyota Motor Corporation (TM)
Description: Toyota Motor Corporation is a global automotive manufacturer headquartered in Japan.
Technical status: Shares surged 13.6% after a trade deal announcement but gapped down on Friday with a 1.7% loss.
Trade commentary: That surge caught me off guard, but I am neither buyer nor seller. I remain on the sidelines, just observing how post‑deal euphoria unfolds.
")
Freshworks Inc (FRSH)
Description: Freshworks provides AI‑driven customer engagement software for businesses.
Technical status: The stock failed to hold its breakout above the 50 and 200DMAs, rolling over ahead of earnings with a technical failure at 50DMA resistance.
Trade commentary: I sold my FRSH position to preserve a small gain. If earnings outperform later, I will revisit FRSH above technical resistance.
CrowdStrike (CRWD)
Description: CrowdStrike provides cloud‑native endpoint security and cyber‑defense services.
Technical status: CRWD recently slipped below its 50DMA. Its 20DMA (the dashed line below) is now downtrending.
Trade commentary: I missed great entries on tests of 200DMA support in March and April, but I am primed to buy on the next test of 200DMA support as a follow-through from the current 50DMA breakdown.
D.R. Horton (DHI)
Description: D.R. Horton builds and sells single‑family homes across the U.S.
Technical status: Shares rallied 17% post‑earnings, then neatly pulled back to the open before stalling—forming a calm after the storm chart pattern.
Trade commentary: DHI is part of a larger development for home builders where, despite on-going poor to lukewarm news, the stocks are moving through a bearish to bullish reversal. If I did not already have enough stocks in home builders, I would buy DHI on the next close higher. On a continued pullback, I am expecting converging 20/200DMA support to hold.
PulteGroup (PHM)
Description: PulteGroup is a U.S. homebuilder constructing and selling residential properties across major metros.
Technical status: PHM mirrors DHI’s setup: strong post‑earnings surge, pullback to support, and signs of an inflection toward higher prices.
Trade commentary: Same as for DHI.
Sarepta Therapeutics, Inc (SRPT)
Description: Sarepta Therapeutics develops genetic medicines to treat rare neuromuscular diseases.
Technical status: Weakness continues as regulatory pressures threaten to severly constrain the business on drug safety concerns.
Trade commentary: I was hopeful for at least a sharp relief rally. However, after an analyst came on CNBC with a convincing case for a zero value on SRPT, I decided to take remaining profits on my short put and dump shares at a loss. I see no point in speculating again on SRPT.
Las Vegas Sands Corp (LVS)
Description: Las Vegas Sands operates integrated resorts and casinos across Asia and the U.S.
Technical status: LVS broke out above its 200DMA and bounced from 20DMA support on its way to a 4.3% post-earnings gain.
Trade commentary: I pointed out the bullish 200DMA breakout after it happened, but I was not brave enough to risk buying ahead of earnings. While LVS remains bullish, the long-term trading range points to upside capped between $70 to $80.
Netflix (NFLX)
Description: Netflix is a streaming entertainment platform offering subscription video content worldwide.
Technical status: Post‑earnings, NFLX dropped 5.1% and confirmed a breakdown below its 50DMA support.
Trade commentary: I do not want to short NFLX, but I am monitoring for a potential technical test near the 200DMA. Such a test could offer an entry for a long-term position.
")
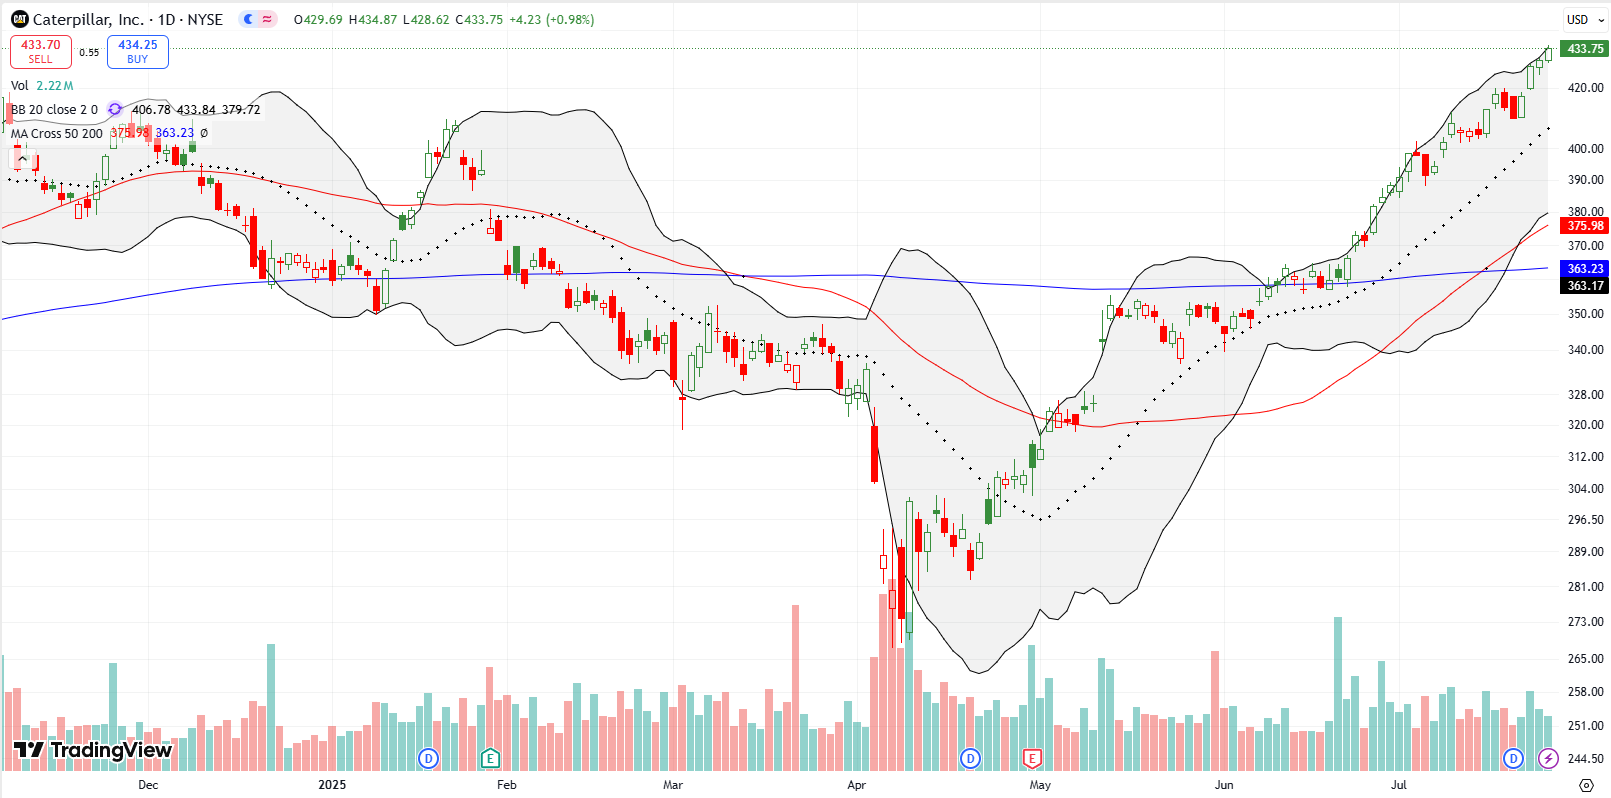
Caterpillar, Inc. (CAT)
Description: Caterpillar designs, manufactures, and sells heavy equipment and machinery for construction and mining.
Technical status: CAT continues powering higher with a sequence of all-time highs.
Trade commentary: CAT is as bullish as it gets. I am watching for earnings in a couple of weeks—strength there could fuel further market confidence. I have not had a reason in several weeks to buy CAT puts as a hedge against bullishness.
Dow Inc. (DOW)
Description: Dow Incorporated is a major chemical company serving industrial, consumer, and materials markets globally.
Technical status: DOW has lost more than half its value since 2024 and sank 17.4% post‑earnings on Thursday, approaching the pandemic all-time low.
Trade commentary: I am watching for a contrarian setup starting with a close above the prior low around $26.47. I am not interested otherwise.
")
Alphabet Inc (GOOG)
Description: Alphabet Inc. is the parent company of Google, a tech giant focused on search, ads, AI, and cloud services.
Technical status: GOOG gapped and crapped post-earnings. Buyers may have made a lasting stand with Friday’s 0.5% gain.
Trade commentary: I remain neutral but on alert. I want to wait for a lower entry near the 20DMA before initiating another long position.
")
Texas Instruments Incorporated (TXN)
Description: Texas Instruments designs and manufactures semiconductors and embedded processors.
Technical status: TXN sliced downward 13.3% post‑earnings, gapping beneath is 50DMA and closing below its 200DMA – a double bearish breakdown.
Trade commentary: I might short on a rebound to 200DMA resistance given TXN is not quite as volatile as other semiconductor stocks.
")
Corning Incorporated (GLW) (“Glow worm”)
Description: Corning Inc. produces specialty glass and ceramics, including fiber optics for data centers and AI infrastructure.
Technical status: GLW has enjoyed a steady run-up since the April lows.
Trade commentary: I bought shares after the 200DMA breakout in May. I should have added shares on the recent test of 20DMA support. I will ride my position at least through next earnings.
")
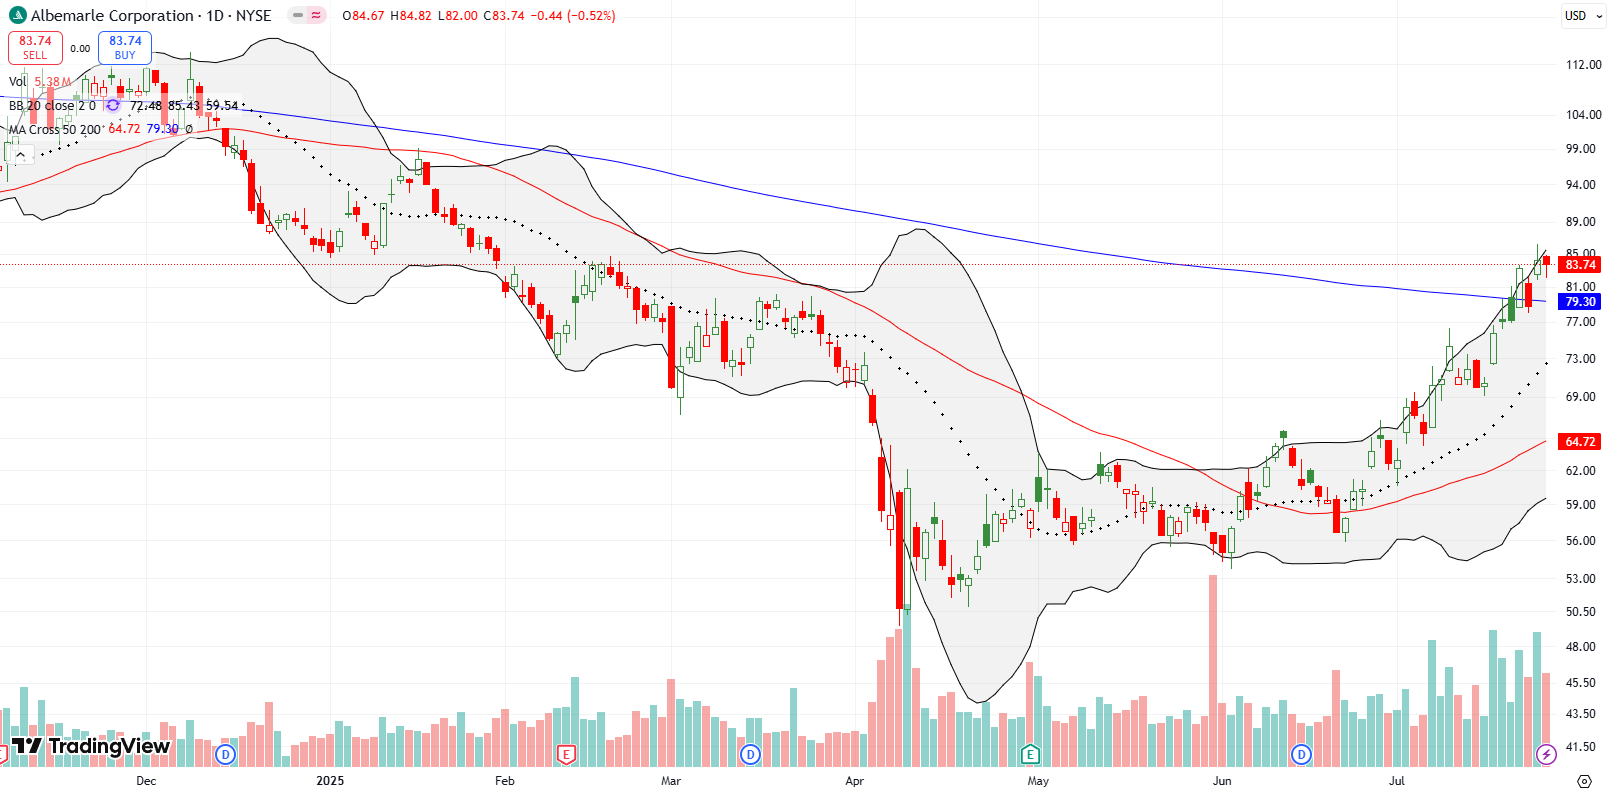
Albemarle (ALB)
Description: Albemarle Corp. is a leading producer of lithium and specialty chemicals for electric‑vehicle batteries and new‑economy growth.
Technical status: ALB broke out above its 200DMA resistance for the first time since December.
Trade commentary: I am a holder heading into earnings. I am hoping to further ride this uptrend from the June low.
")
")
Be careful out there!
Footnotes
Subscribe for free to get email notifications of future posts!
“Above the 50” (AT50) uses the percentage of stocks trading above their respective 50-day moving averages (DMAs) to measure breadth in the stock market. Breadth defines the distribution of participation in a rally or sell-off. As a result, AT50 identifies extremes in market sentiment that are likely to reverse. Above the 50 is my alternative name for “MMFI” which is a symbol TradingView.com and other chart vendors use for this breadth indicator. Learn more about AT50 on my Market Breadth Resource Page. AT200, or MMTH, measures the percentage of stocks trading above their respective 200DMAs.
Active AT50 (MMFI) periods: Day #48 over 20%, Day #46 over 30%, Day #41 over 40%, Day #36 over 50%, Day #34 over 60%, Day #2 under 70%
Source for charts unless otherwise noted: TradingView.com
Full disclosure: long IWM shares and calls, long ALB, long GLW, long CMG, long SPY put options
FOLLOW Dr. Duru’s commentary on financial markets via StockTwits, BlueSky, and even Instagram!
*Charting notes: Stock prices are not adjusted for dividends. Candlestick charts use hollow bodies: open candles indicate a close higher than the open, filled candles indicate an open higher than the close.
* Blog notes: this blog was written based on the heavily edited transcript of the following video that includes a live review of the stock charts featured in this post. I used ChatGPT to process the transcript.
The S&P 500 is becoming something like the Dow Jones Industrials: too dominated by a few stocks to use as a general-market weathervane, and more importantly to provide trustworthy diversity. From an analysis about a month ago:
« Today, just the top 10 companies make up approximately 35% of the entire index—nearly double the historical average of 20-25%. Before recent market corrections, this concentration had reached as high as 40%. »
Yep! Perhaps it is time for me to use the RSP? It closed Friday right at its all-time high. It would also be interesting to see how a “S&P bottom 490” is doing on a market cap basis.