Stock Market Commentary
Financial markets are supposed to act like discounting mechanisms which use the wisdom of the crowd to anticipate important events. The stock market stalled and then broke down ahead of the election. Excluding a last minute rush to buy on election day, I assumed the stock market might have a muted reaction no matter the results. Instead, Donald Trump’s victory flipped the post-election script and sent asset prices soaring across a broad range of classes (I was even hesitant to believe what was happening in overnight trading). The tension created by fades pressing on market supports ahead of the election was resolved bigtime to the upside. Bearish signals were yet again washed away in a flash.
I loathe making projections. However, at this juncture, I feel the need to have some kind of longer-term framework even as I scramble to adjust the short-term trades to short-term shifts. I will start by saying that if your understanding of the economy comes from politicians, you’re doing it wrong. The current economy is strong and cannot get much better on the whole. If my read of the actual data is correct, then major changes to the way the economy works will carry higher than usual risk of breaking something important.
In other words, when the economy is almost as good as it gets, the benefits of thinking contrarian could be really high when major policy changes are afoot. Sure, certain individuals or small groups or sectors may benefit from major changes, but they could come at the expense of the greater economy. Time will tell, and, as usual, I am taking things one step at a time and will avoid front-running what I think politicians MIGHT do. I am content to wait for and react to the real action.
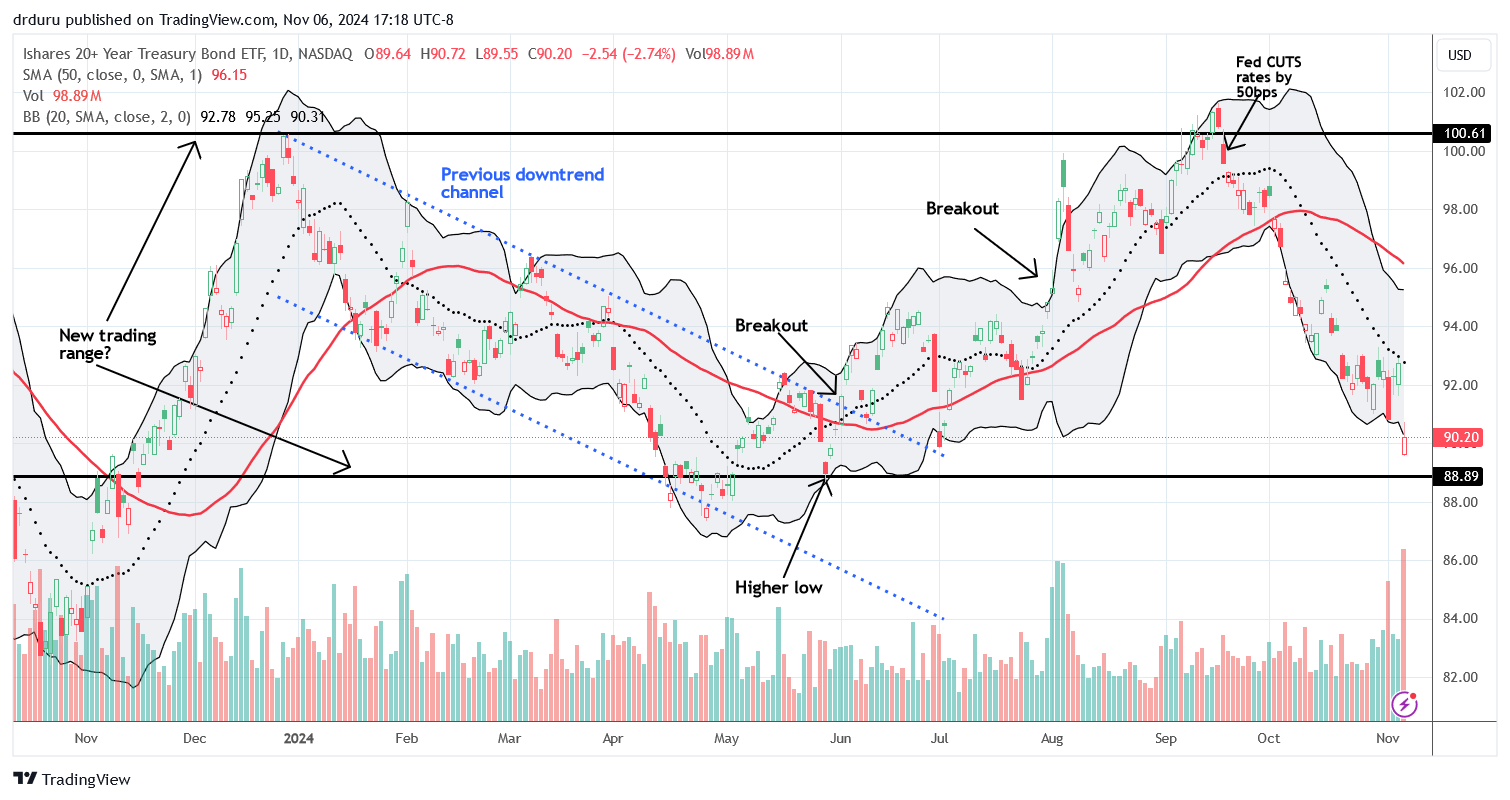
In the meantime, the bond market is making some strong predictions about some combination of economic strength, ballooning government deficits, and/or stabilizing inflation. The iShares 20+ Treasury Bond ETF (TLT) sufferd a post-election gap down and nearly tested the bottom of the presumed trading range. Given my strategy to fade rallies in TLT, I happily bought TLT put options (but not enough!) as the ETF performed a pre-election jump into 20DMA resistance (the dotted line). I took profits at the market open.
The Fed’s got next and could trigger the next TLT rally whereas the Fed triggered the current sell-off. I stand ready to fade such a rally (preferably at the declining 50DMA (the red line) this time).
The Stock Market Indices
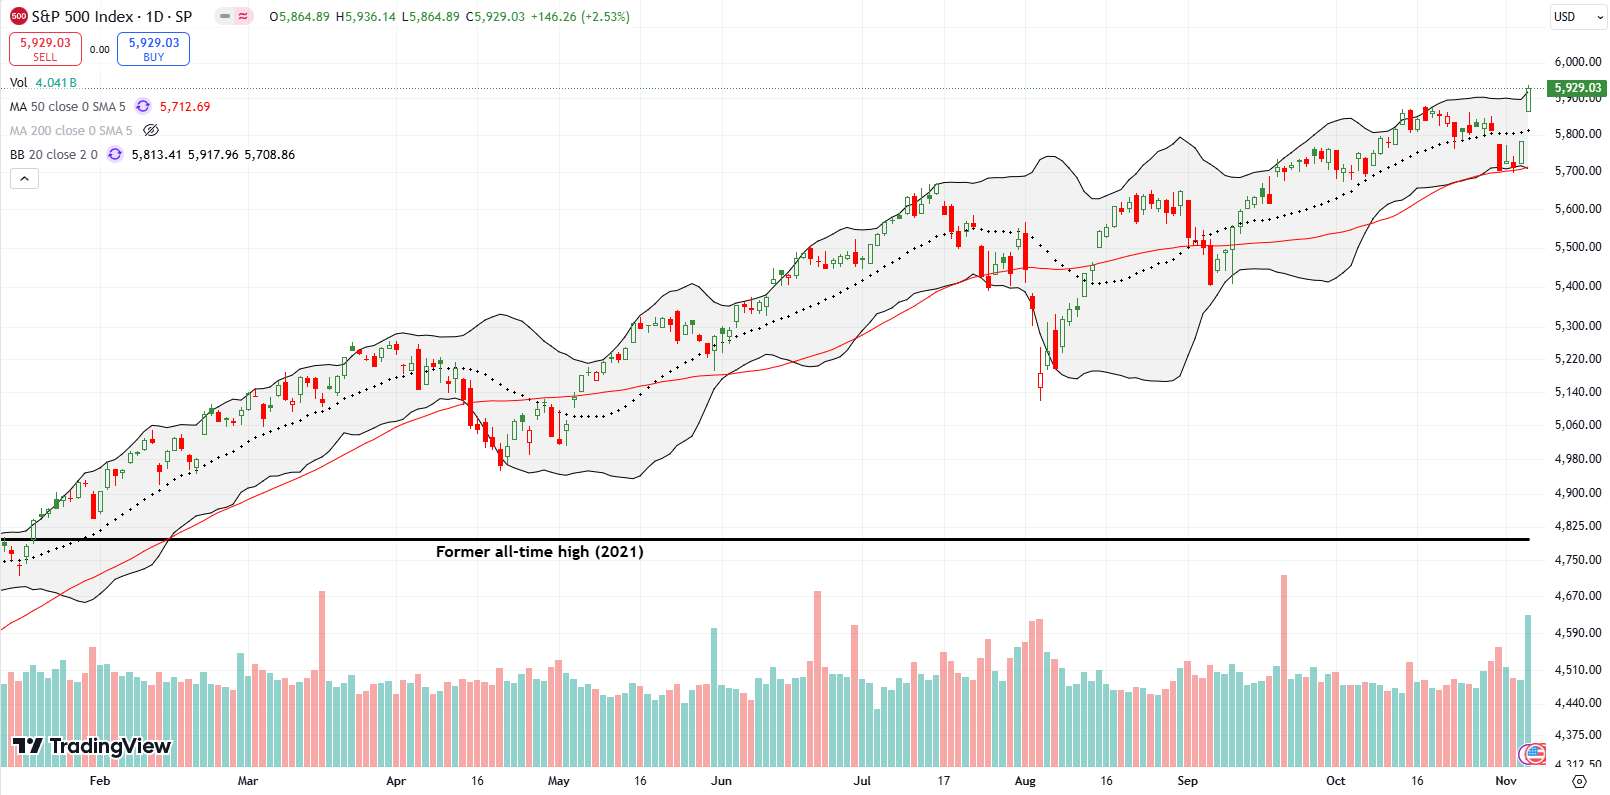
The S&P 500 (SPY) confirmed support at its 50DMA with a 2.5% surge to a new all-time high. The defense of support was picture-perfect as sellers failed to punch through for 4 straight days. The index also invalidated the previous topping pattern just days after validating the topping pattern. Recall that in my last Market Breadth post I observed that “…the drama going into the presidential election is wound as tight as can be expected in a persistent bull market.” The spring unloaded to the upside.
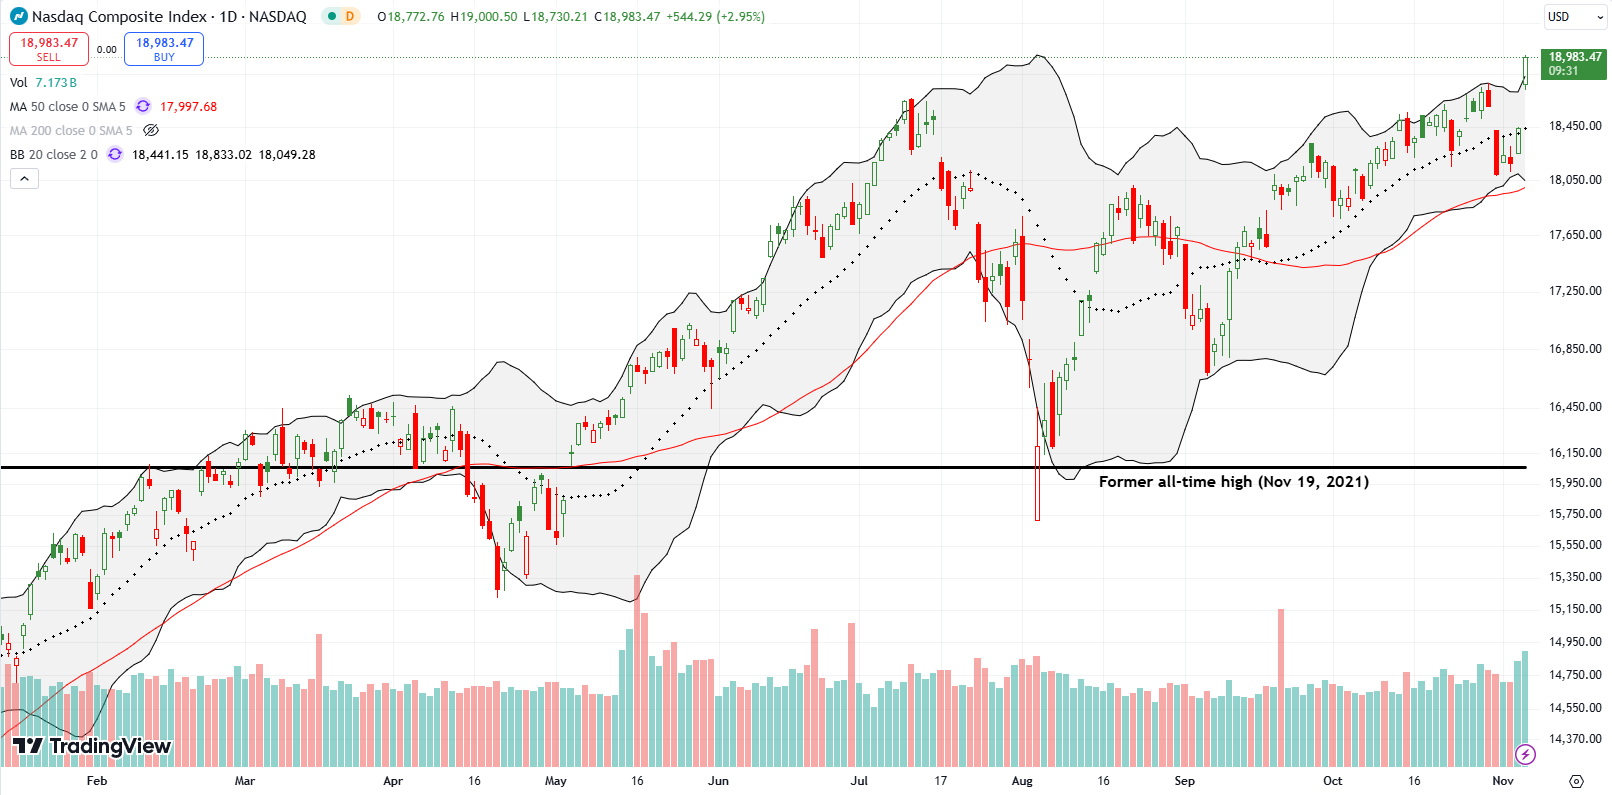
The NASDAQ (COMPQX) never reached 50DMA support but no matter but it was smothered by 20DMA resistance (the dotted line) for 4 days, including the pre-election close. Today’s 3.0% post-election surge finally ended the tech-laden index’s multi-month topping pattern from the July to October highs.
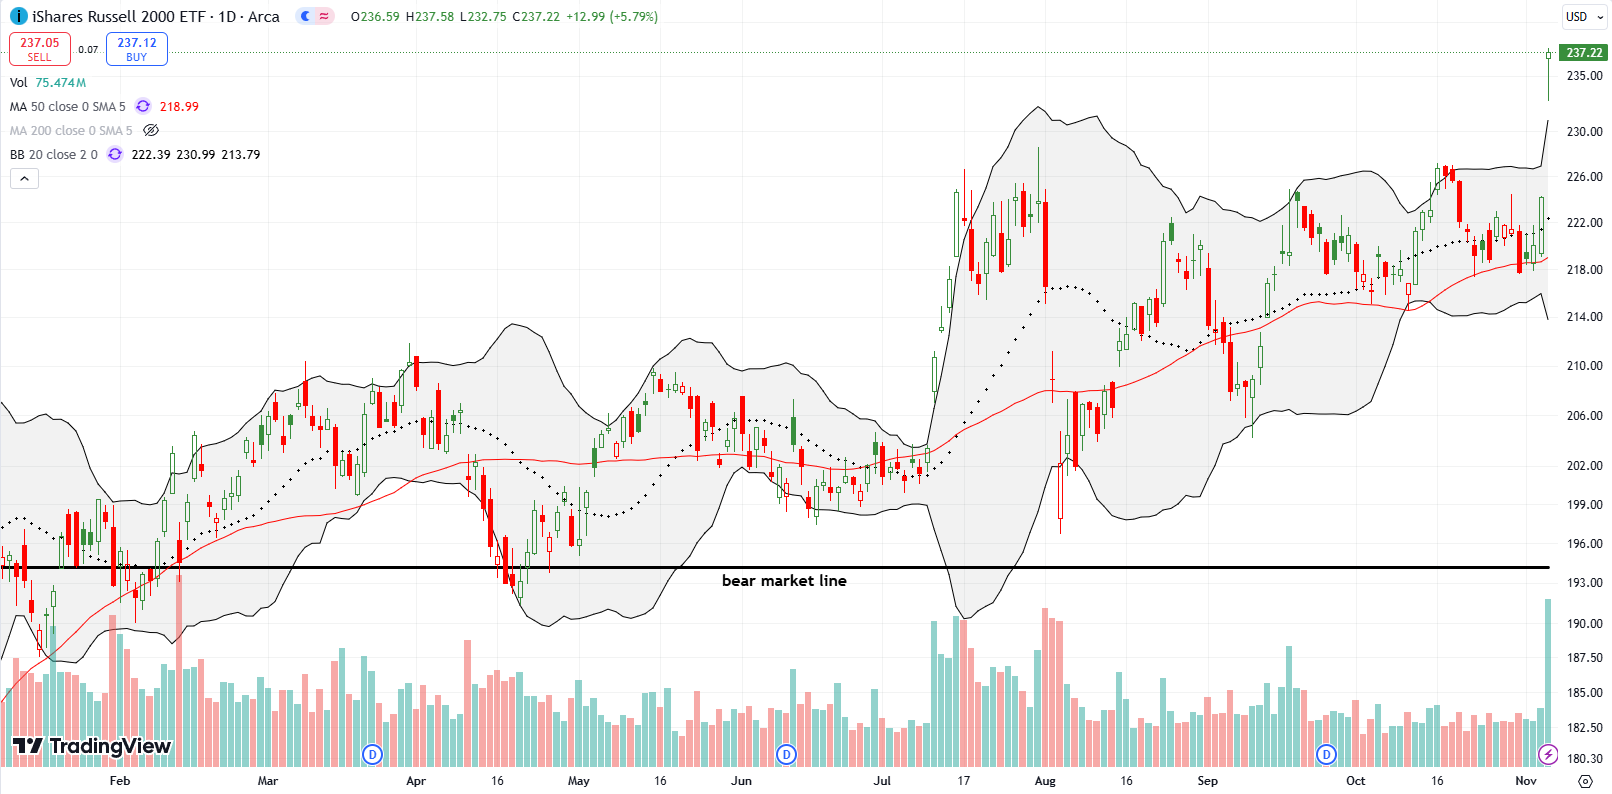
The iShares Russell 2000 ETF (IWM) was the big post-election winner. Buyers even staved off an attempt by sellers to fade the gap higher. The ETF of small caps surged 5.8% and left behind confirmed 50DMA support. IWM also closed at a 3-year high and just short of its all-time high. Finally, IWM looks ready to chase permabull Tom Lee’s projection for outsized gains ahead. While I am of course still holding shares, I kicked myself for taking profits on my latest round of call options the day before!
The Short-Term Trading Call Post-Election
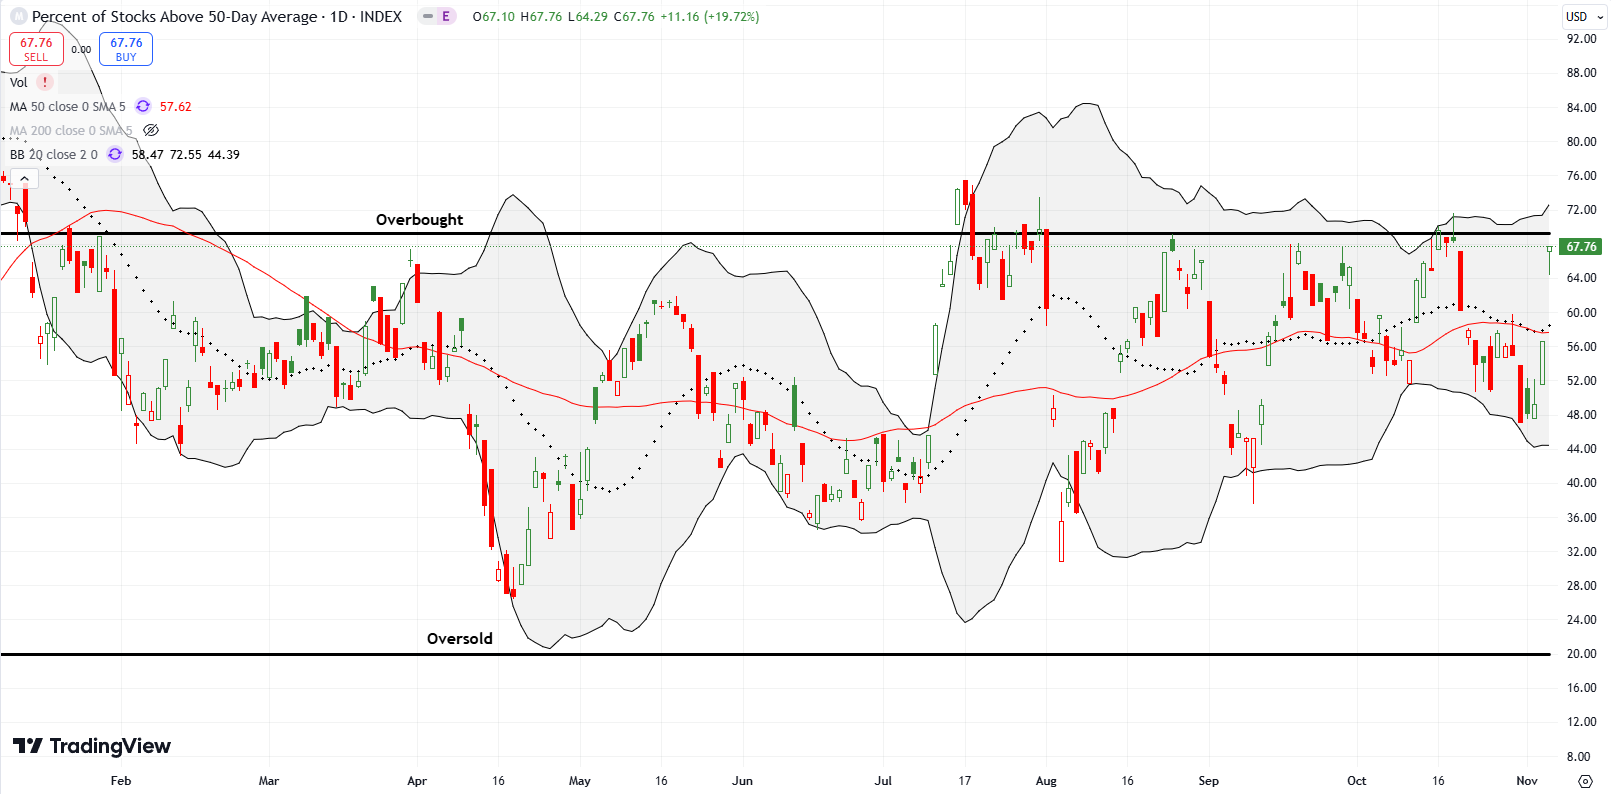
- AT50 (MMFI) = 67.8% of stocks are trading above their respective 50-day moving averages
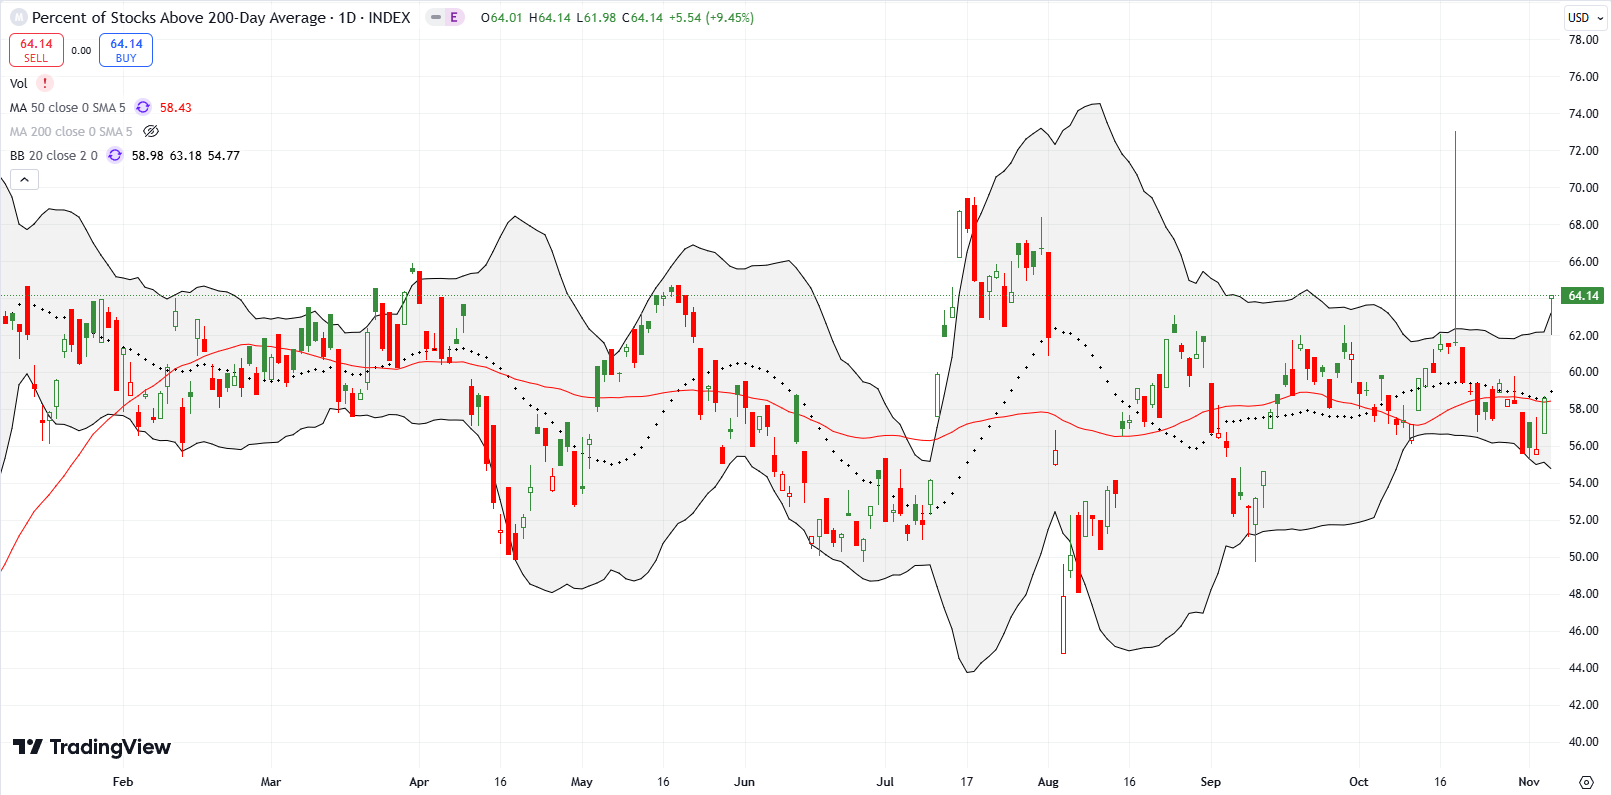
- AT200 (MMTH) = 64.1% of stocks are trading above their respective 200-day moving averages
- Short-term Trading Call: neutral
AT50 (MMFI), the percentage of stocks trading above their respective 50DMAs, zipped from a 6-week low last week to right back to the overbought threshold (70%). My favorite technical indicator closed at 67.8%. While technically I could maintain a cautiously bearish, short-term trading call, I upgraded to neutral given the resounding defense of 50DMA supports. I am hoping that AT50 can avoid fading from the overbought threshold for the fifth time in just over 3 months because 1) I do not want to churn the trading call, and 2) dips should be bought after this bullish surge and shorting will again require quick trading.
Recall that the the AT50 trading rules trigger a bearish signal on a fade from the overbought threshold. The last fade in mid-October was responsible for my prior bearish trading call. AT200 (MMTH), the percentage of stocks trading above their respective 200DMAs, cleared a period of consolidation and re-establish a bullish positioning.
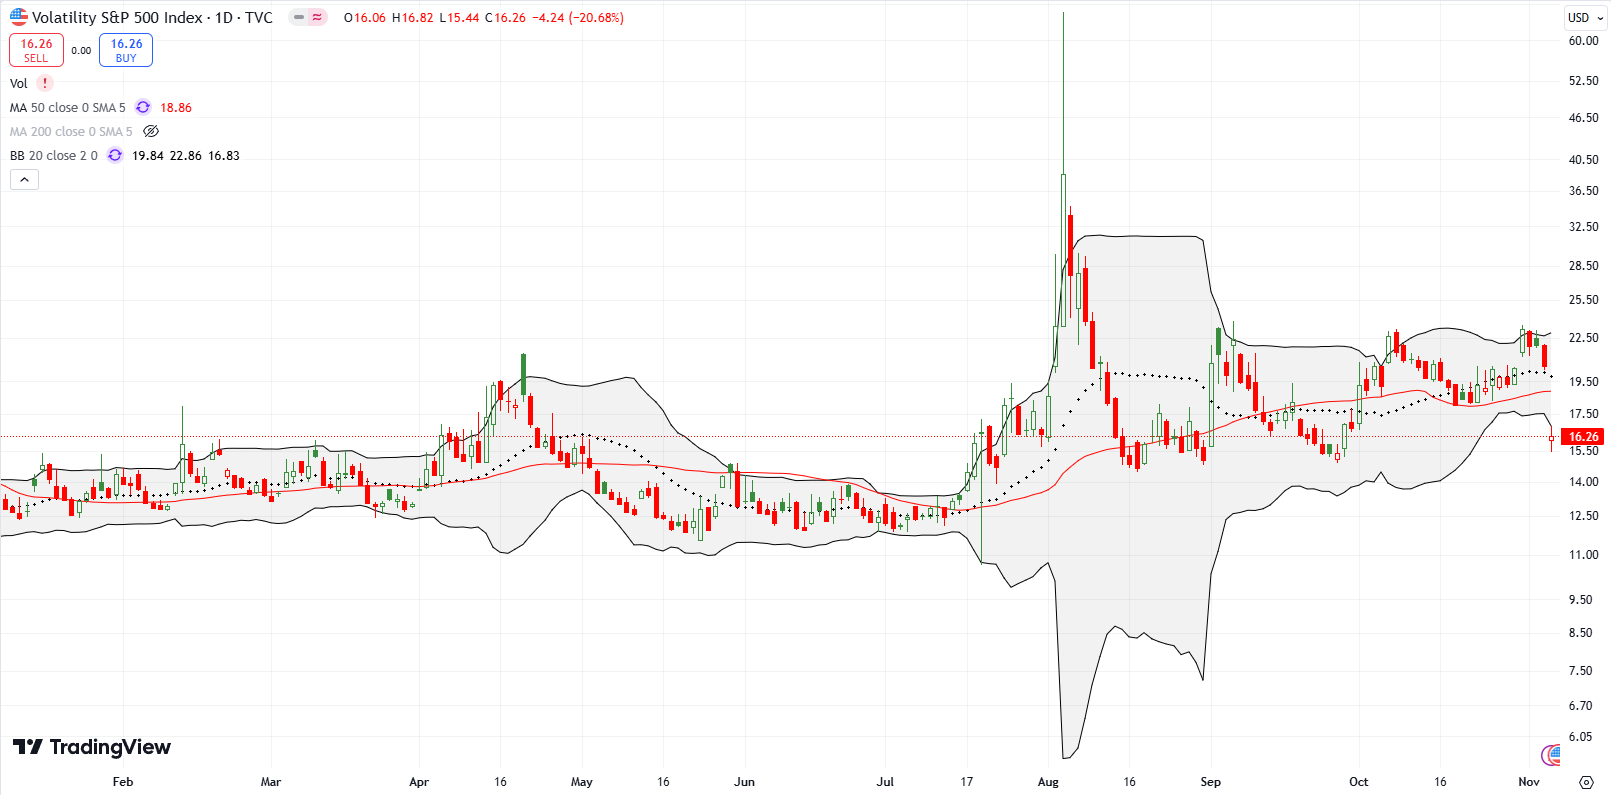
The volatility index (VIX) was a big post-election victim. I previously claimed that “the volatility index (VIX) looks like it is getting ready for something big…or it is on the edge of its next major fade and collapse.” The VIX chose a post-election sigh of relief and collapsed to 20.7% to a 5-week low. I was surprised to see VXX fading ahead of the election results and thought I was fortunate to be able to take profits on my VXX put options. Needless to say, that decision is one more trade I wish I delayed one more day! (VXX fell 9.3%).
The Fed’s got next; the monetary policy captains are likely relieved that the stock market makes their collective lives easy. Still, the image of the Fed cutting rates into the teeth of a strong stock market and robust economy remains quite surreal to veterans in the game like myself. The Federal Reserve’s decision on monetary policy will likely pressure the VIX lower as traders and investors breathe more sighs of relief… or at least I am assuming Chair Jerome Powell will be more loathe than usual to surprise financial markets. I cannot wait to hear how he answers questions about the surge in long-term bond yields.
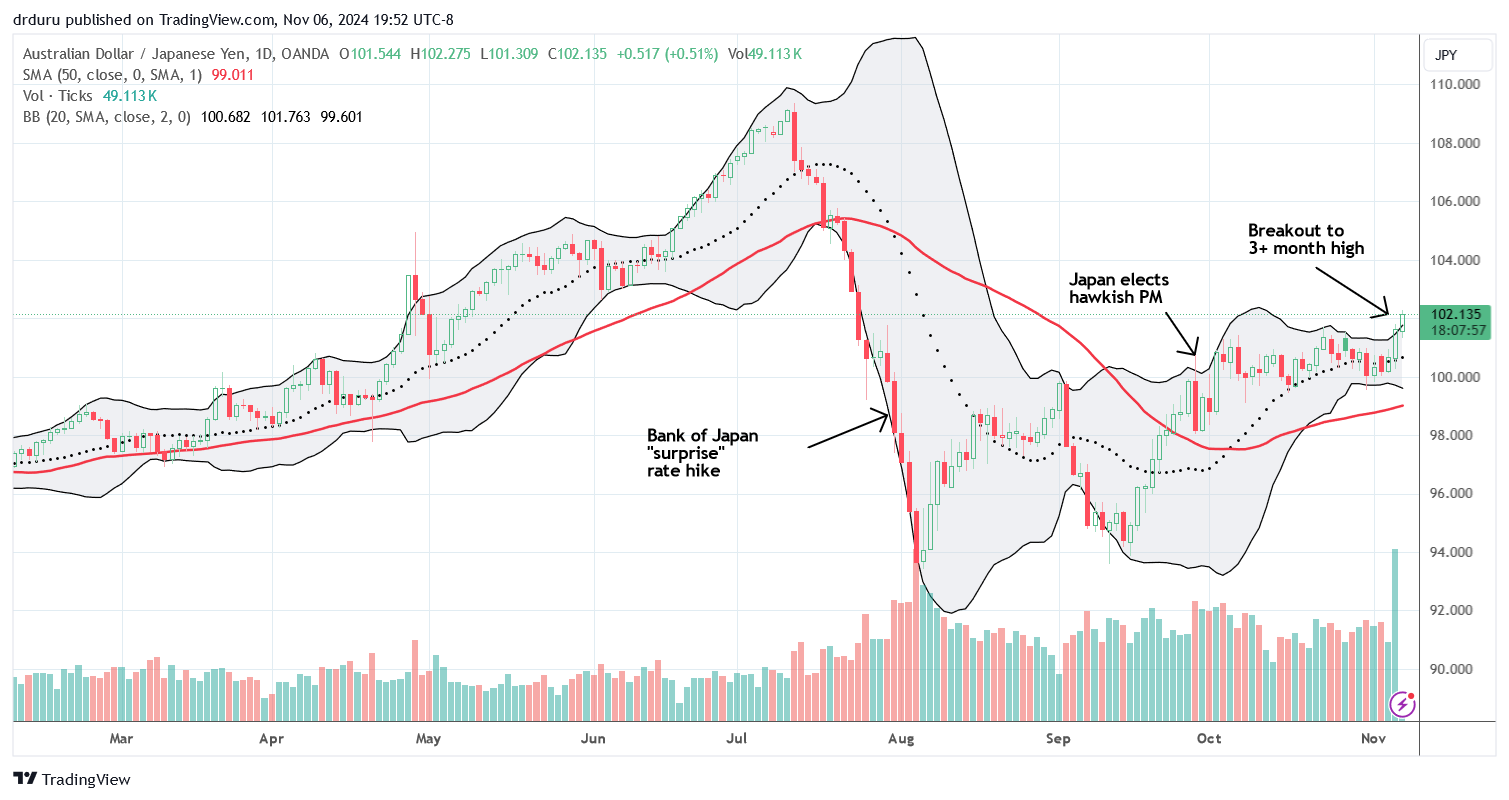
The currency markets are signalling a post-election flip of the script for the bulls. My favorite indicator, the Australian dollar versus the Japanese yen (AUD/JPY) broke out to a multi-month high. As a reminder, AUD/JPY tends to have a direct correlation with the S&P 500 for stretches at a time and even sometimes anticipates the next move. I am short for now as a hedge. I am waiting for the Fed move to decide whether to flip that position into a long.
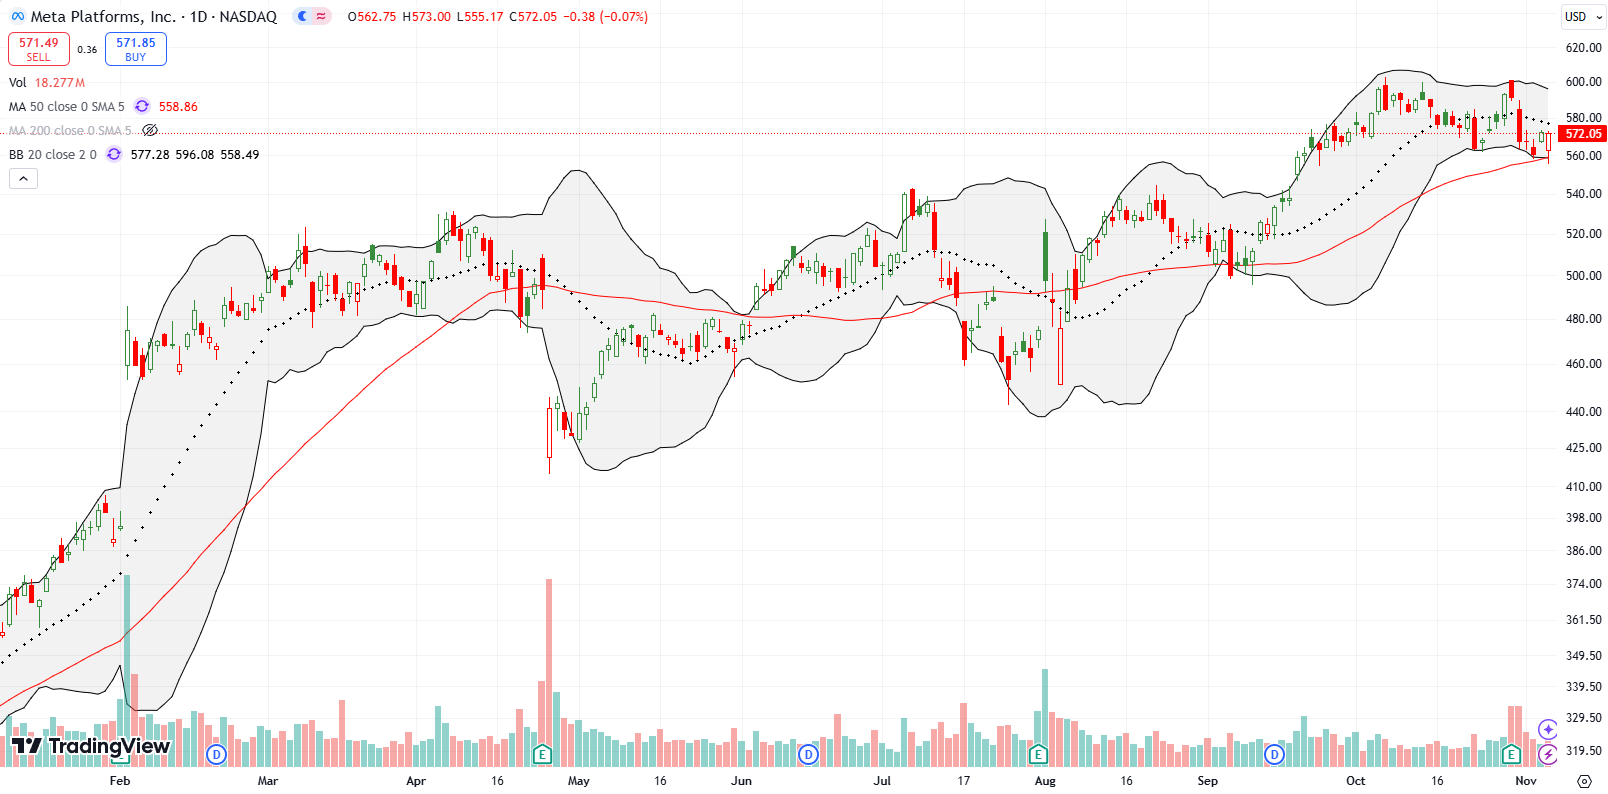
Meta Platform, Inc (META) was a curious bystander to the post-election rally. Trump has had disparaging words for the social media platform. As President he may find ways to undermine Facebook in favor of his own social media platform. Still, META is only a short on a close below 50DMA support. Buyers defended the 50DMA today in picture-perfect fashion.
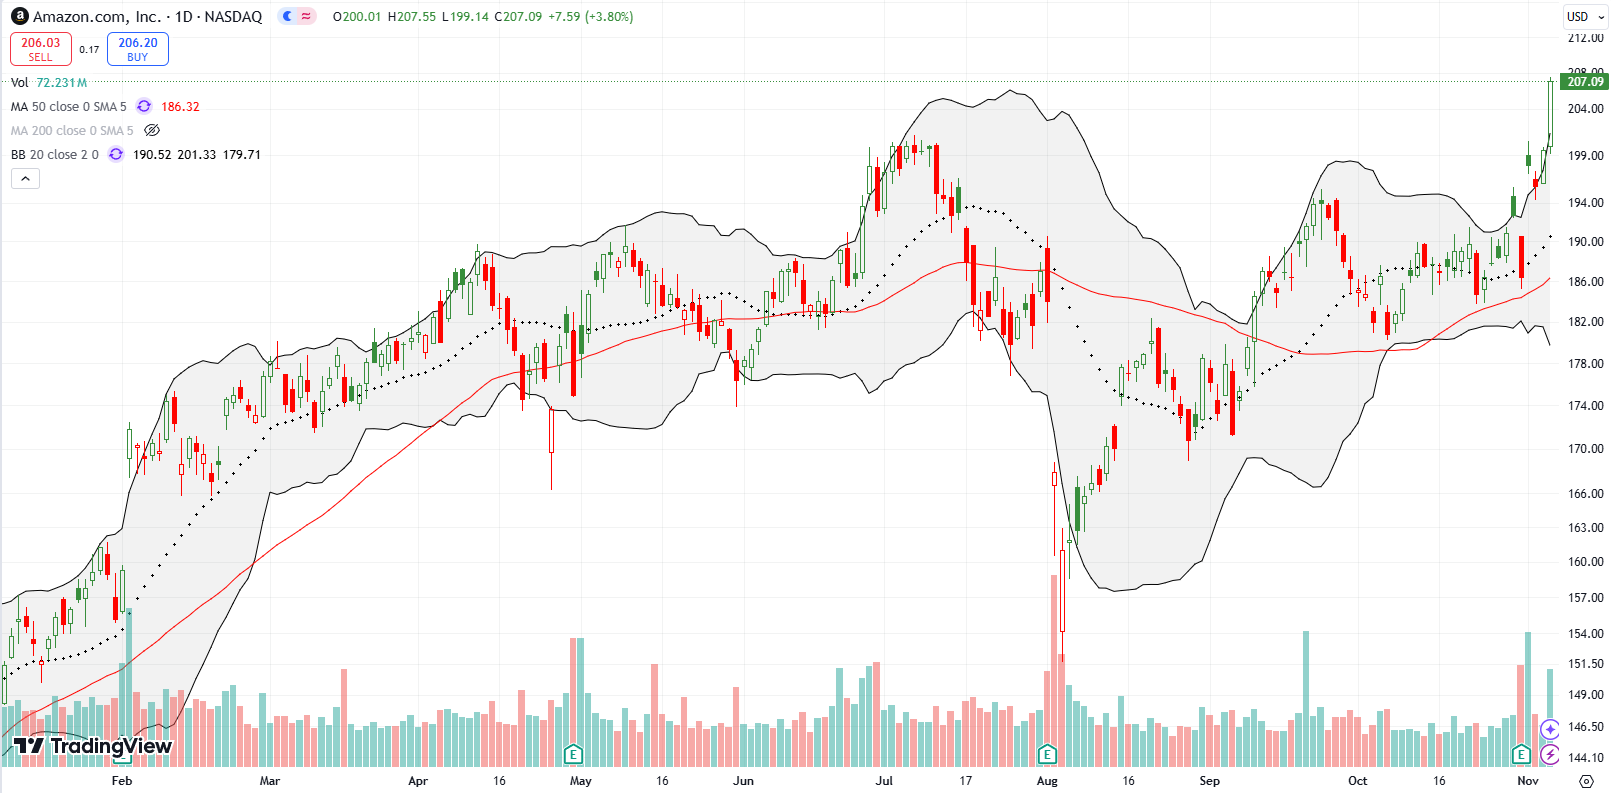
Amazon.com (AMZN) soared in parabolic fashion and gained 3.8%. The new all-time high confounded me; I am looking for any readers to help me understand why AMZN enjoyed such a strong post-election surge. I would have guessed that Trump’s promise to enact massive tariffs against China and other trading partners would threaten to make a broad swath of Amazon goods more expensive.
In the meantime, I am duly noting that once again the AMZN post-earnings trading strategy worked: buy AMZN at any point the day after earnings and profit within 2 weeks. Recall that I chose to stay on the sidelines this time: “I decided to sit on my hands for this round. I cannot justify a trade on a stock extended well above its upper Bollinger Band, facing down resistance from an all-time high, all while I have a bearish short-term trading call in play.” Monday’s gap down and 1.1% loss even seemed to validate my decision as it created a bearish abandoned baby pattern right at a double top.
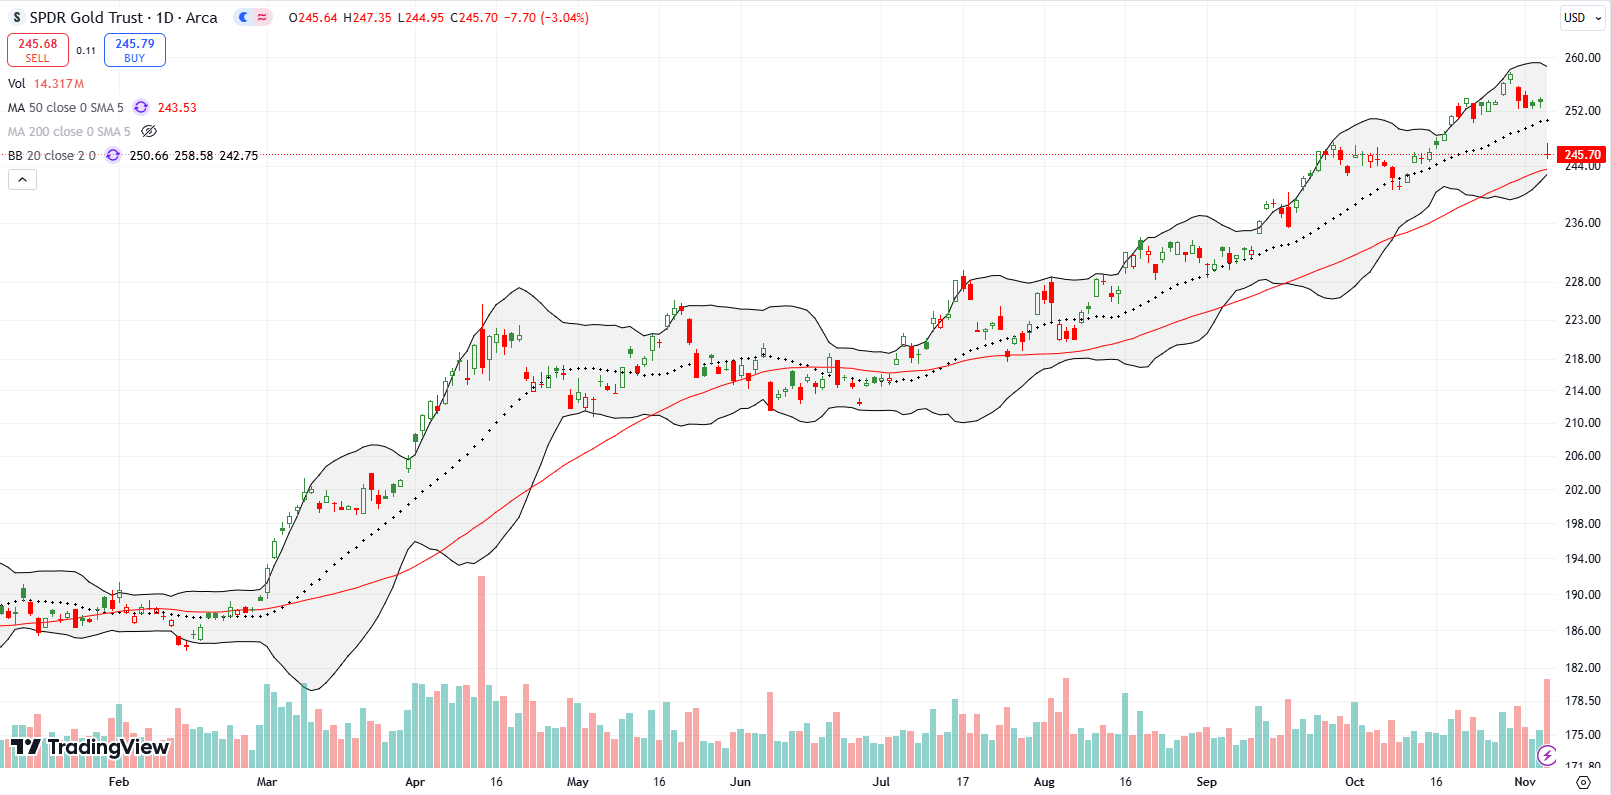
SPDR Gold Trust (GLD) was another surprise. GLD gapped down 3.0% and nearly tested 50DMA support. With Trump promising to blow out the Federal budget with corporate and personal income tax cuts and a long assortment of spending promises, I expected a post-election surge in GLD, not a plunge. Needless to say, I promptly opened a new short-term trade in GLD with call options and shares in PHYS.
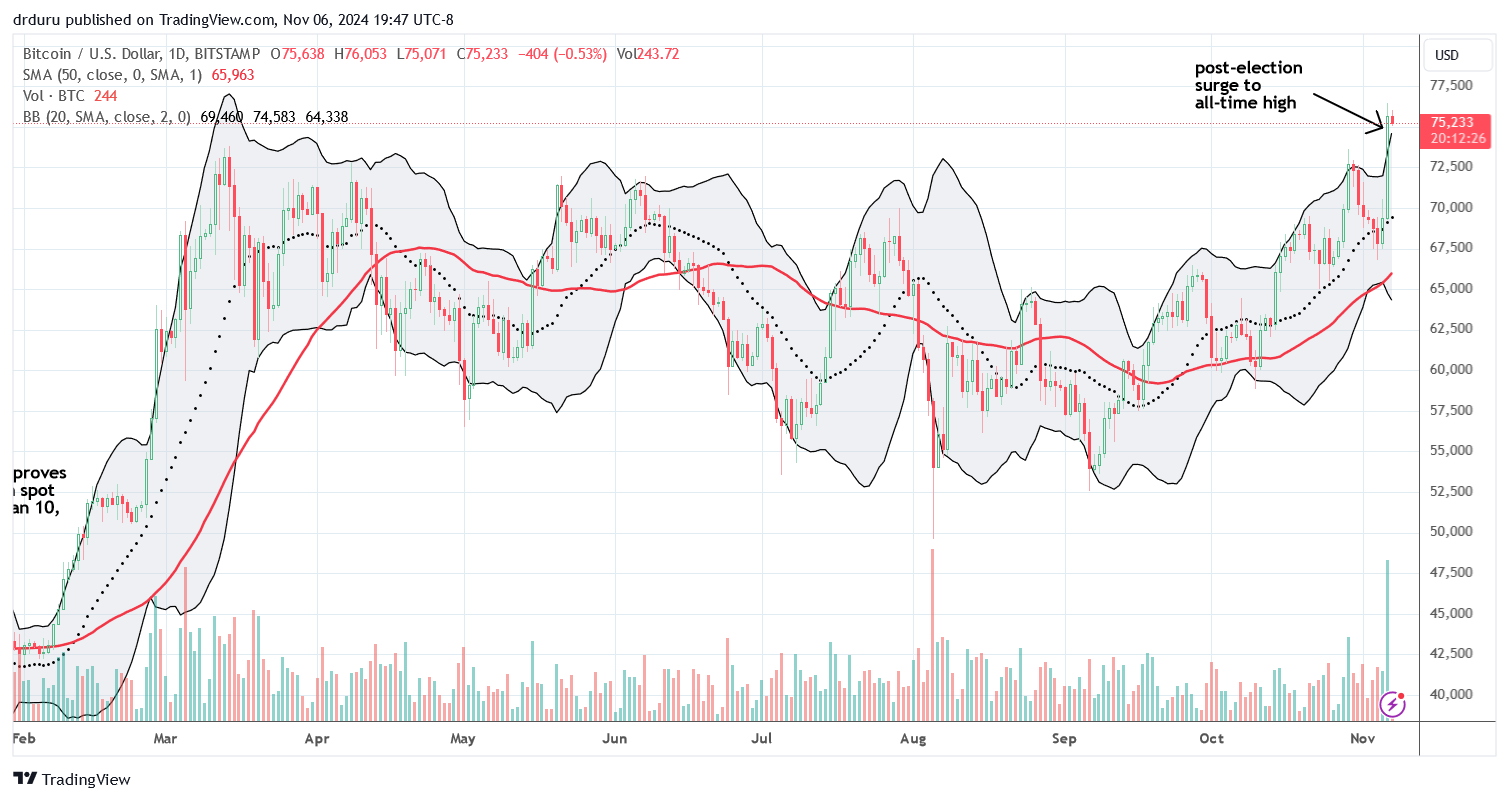
It is very possible that traders sold gold to buy more cryptocurrencies. Bitcoin (BTC/USD) was a major post-election beneficiary given Trump’s advocacy for Bitcoin, including to maintain government Bitcoin holdings forever (Uncle Sam HODLR). I jumped back into Bitcoin as soon as it broke out above the July high, and I added more on the immediate pullback. I plan to hold my position much longer than my typical trade, and I am even looking to accumulate in an uptrend. Given the extended consolidation for 8 months, a new uptrend from here should (could?) be epic.
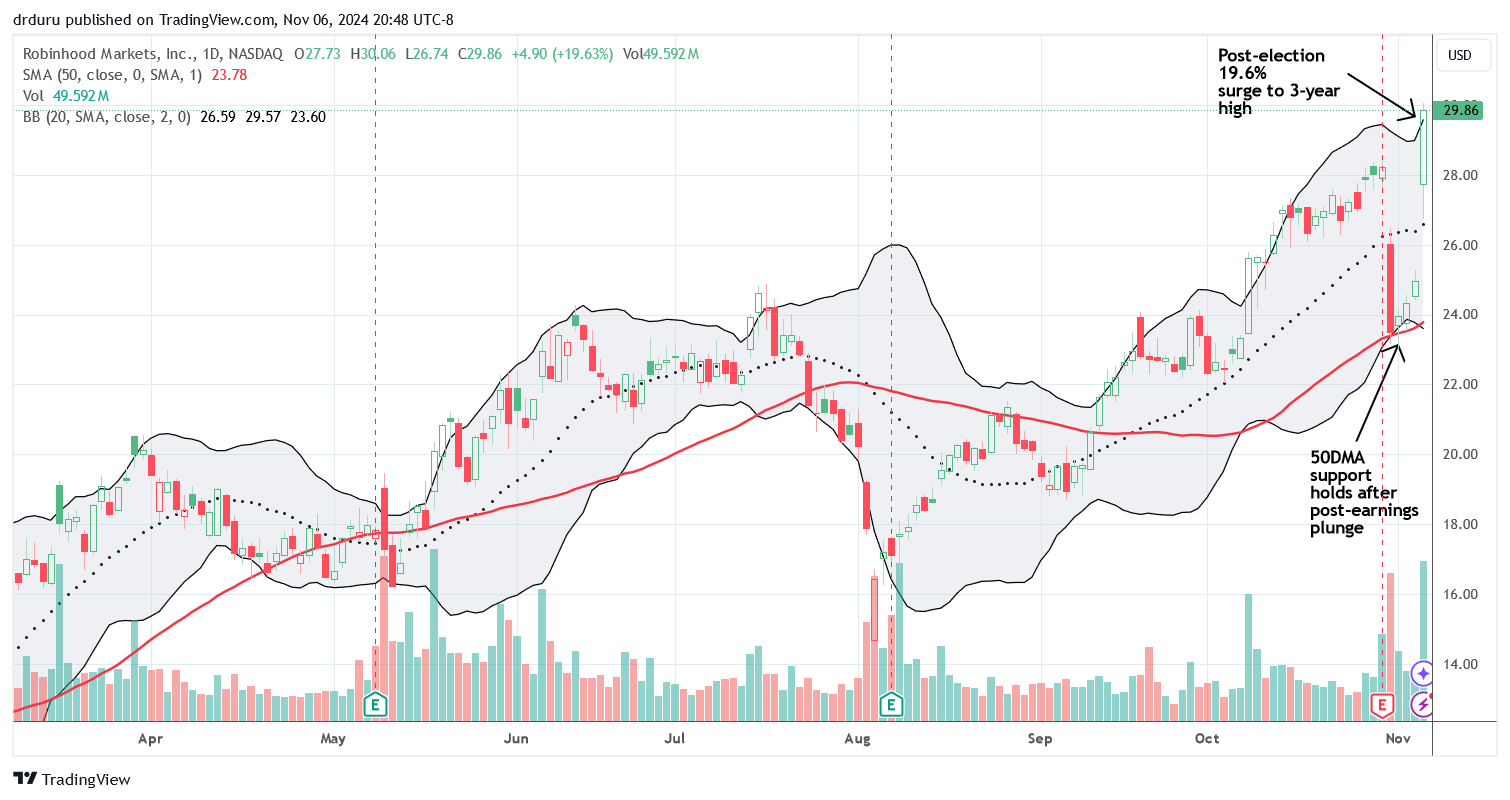
Thanks the post-election flip of the script, my trade in Robinhood Markets, Inc (HOOD) worked out even better than I could have hoped. HOOD soared 19.6% to a new 3-year high and left behind a picture-perfect test of 50DMA support. Funny how technicals work so well…
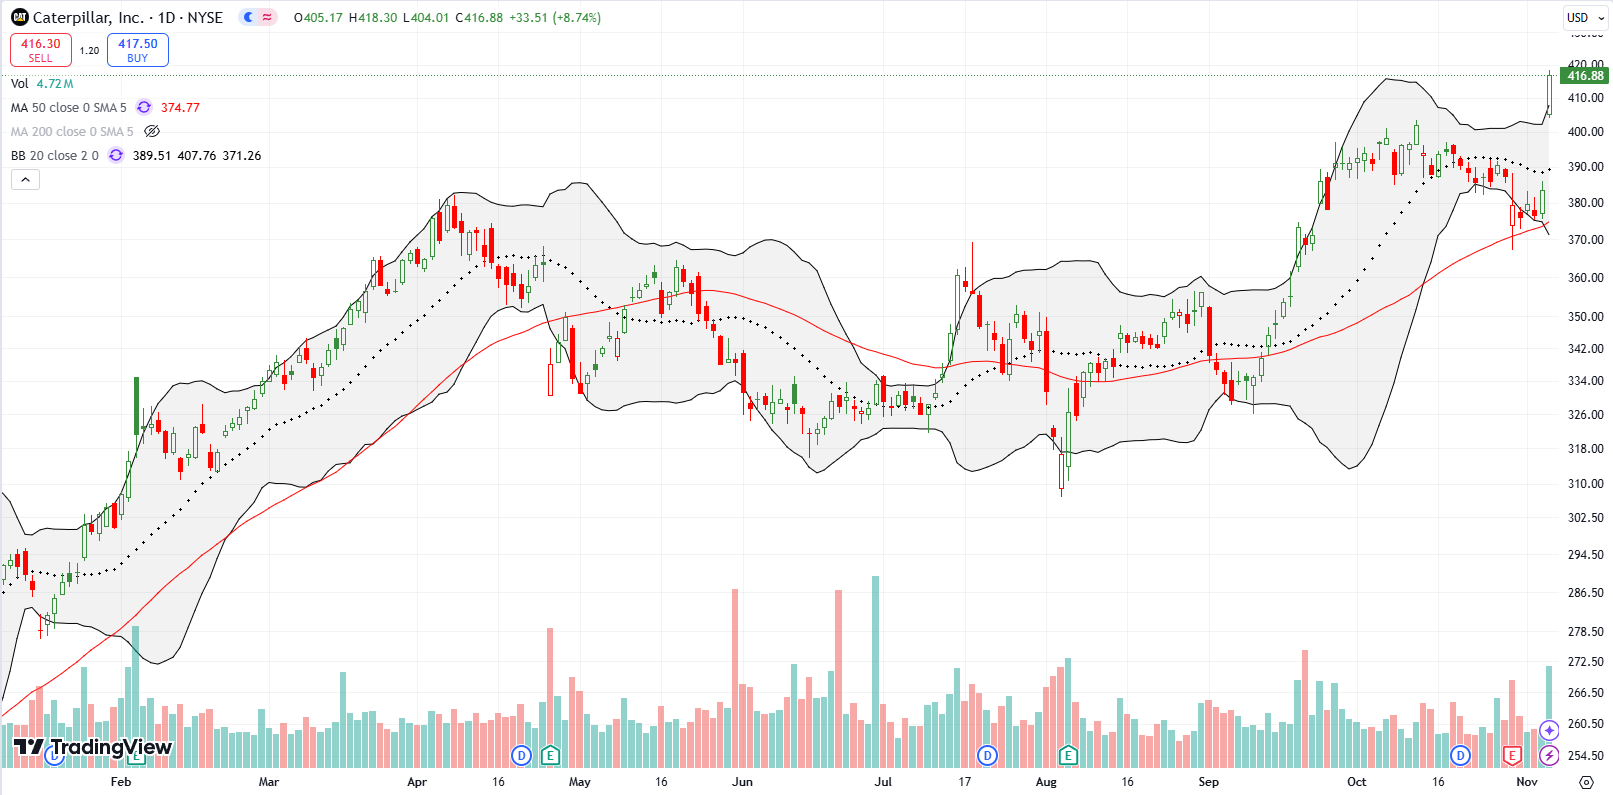
Caterpillar, Inc (CAT) is yet another equity which enjoyed a post-election confirmation of 50DMA support. CAT lost 2.1% post-earnings and for 4 more days sellers tried and failed to break 50DMA support. CAT surged 8.7% post-earnings to an all-time high. While CAT is my favorite hedge against bullishness, I see zero reason to buy puts even for a hedge until/unless the stock closes below today’s intraday low.
Be careful out there!
Footnotes
Subscribe for free to get email notifications of future posts!
“Above the 50” (AT50) uses the percentage of stocks trading above their respective 50-day moving averages (DMAs) to measure breadth in the stock market. Breadth defines the distribution of participation in a rally or sell-off. As a result, AT50 identifies extremes in market sentiment that are likely to reverse. Above the 50 is my alternative name for “MMFI” which is a symbol TradingView.com and other chart vendors use for this breadth indicator. Learn more about AT50 on my Market Breadth Resource Page. AT200, or MMTH, measures the percentage of stocks trading above their respective 200DMAs.
Active AT50 (MMFI) periods: Day #241 over 20%, Day #140 over 30%, Day #64 over 40%, Day #2 over 50%, Day #1 over 60% (overperiod ending 11 days under 60%), Day #79 under 70% (underperiod)
Source for charts unless otherwise noted: TradingView.com
Full disclosure: long SPY put spread, long IWM shares, long QQQ put spread, long GLD shares and calls, short AUD/JPY, long Bitcoin
FOLLOW Dr. Duru’s commentary on financial markets via StockTwits, Twitter, and even Instagram!
*Charting notes: Stock prices are not adjusted for dividends. Candlestick charts use hollow bodies: open candles indicate a close higher than the open, filled candles indicate an open higher than the close.


1 thought on “Trump Flips the Post-Election Script, The Fed’s Got Next – The Market Breadth”