Stock Market Commentary
I hate to be one of THOSE bears, but this current wild stock market has turned me into the classic broken record of bearishness. Last week’s red flags consisted of mind-boggling price changes in certain stocks both up and down. Stocks should not move in big chunks at a time, sometimes for days in a row, sometimes up and down in rapid succession. This price action reminds me of the dot-com bubble from 1999 to 2000 and the path to the crash of the Great Financial Crisis from 2008 to 2009. While I am NOT predicting a crash – such proclamations are the foils of click baiters – I continue to insist on staying ready so I do not need to get ready.
Moreover, for a market that is supposed to be bullish, there are too many key stocks suffering technical post-earnings breakdowns. Each one is like a peg removed from the stool supporting the bulls. Accordingly, market breadth has yet to break out of its 2024 downtrend.
The Stock Market Indices
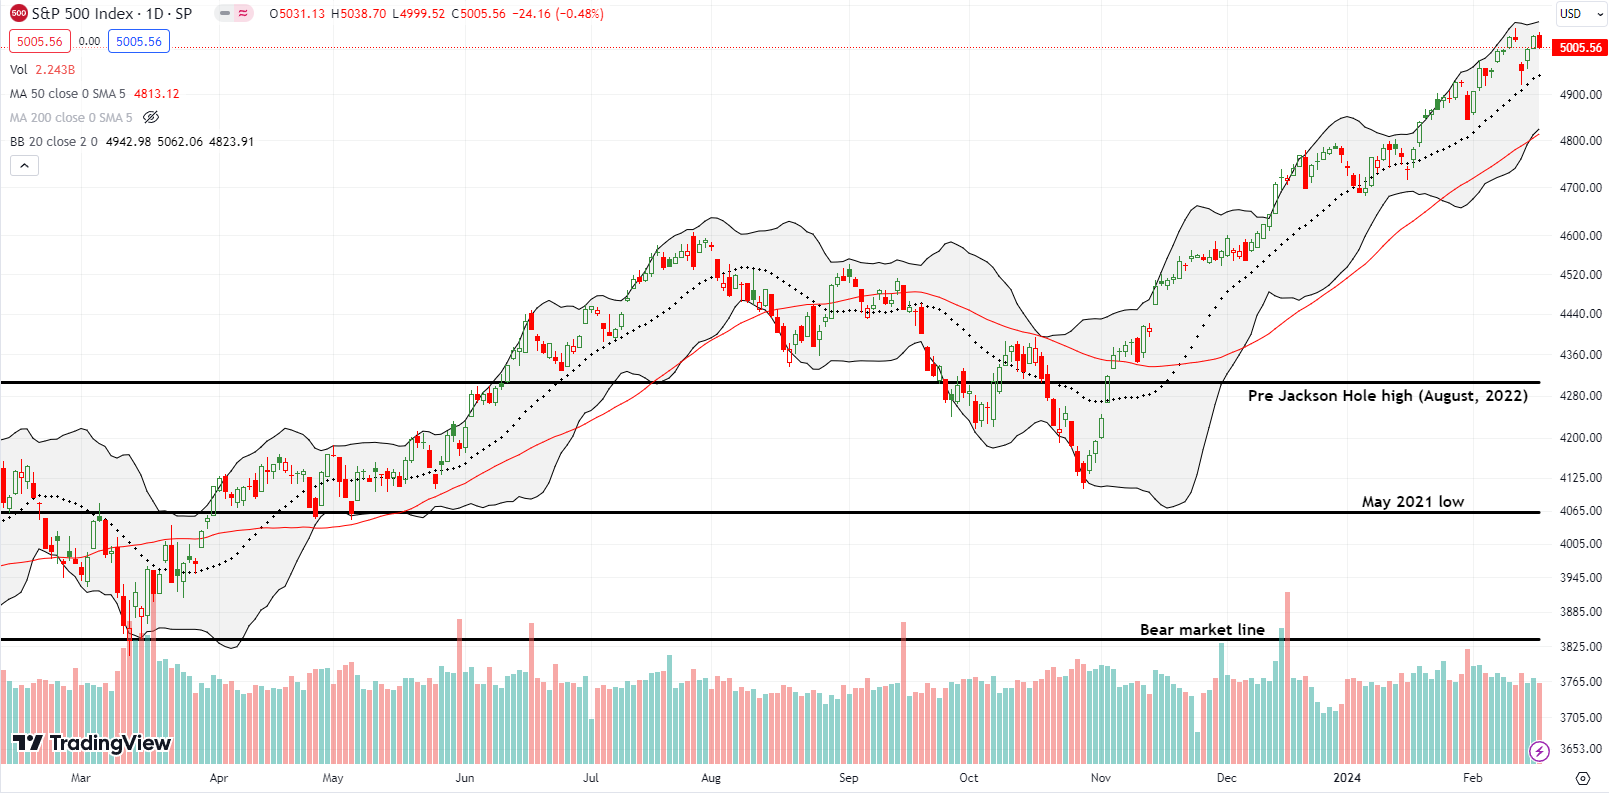
On Tuesday, the S&P 500 (SPY) accompanied the rest of the stock market on a sudden and abrupt gap down in response to a disappointing inflation report. It was a BE READY kind of day in the stock market. Yet, sellers could barely blink at the latest downward catalyst. The S&P 500 bounced nearly perfectly off support at its uptrending 20-day moving average (DMA) (the dashed line). In just two more days, it was like nothing happened as buyers closed the gap. Friday’s small pullback reversed Thursday’s gains and thus stopped short of invalidating the bearish shooting star candlestick pattern that preceded the gap down. I am waving another red flag at the week’s trading action despite the bullish test of support.
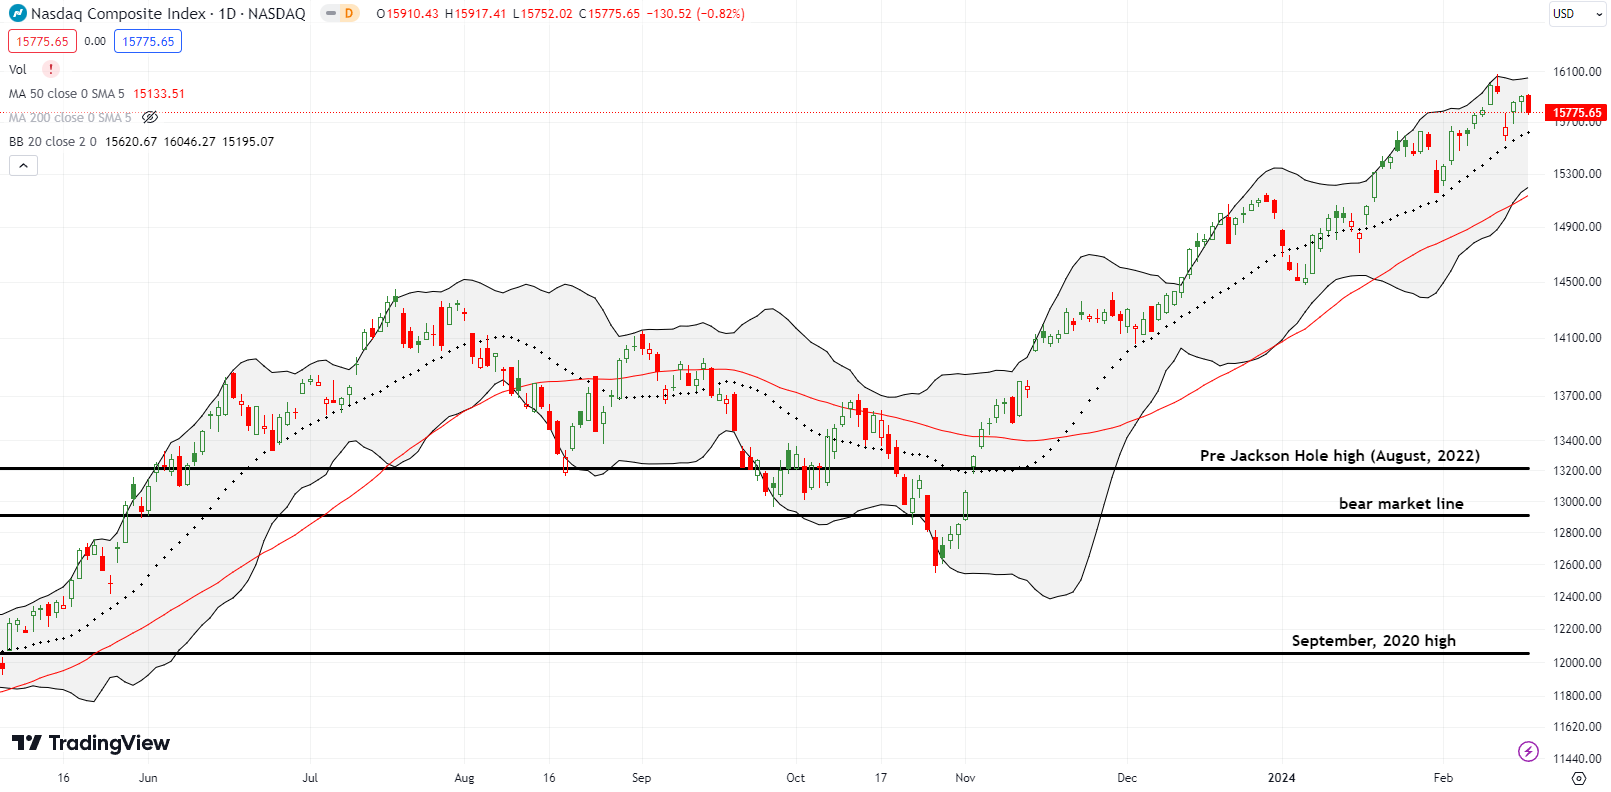
The NASDAQ (COMPQ) did not quite close the gap from Tuesday. That failure is a red flag even with the tech-laden index enjoying a successful test of its 20DMA. The NASDAQ’s bearish shooting star candlestick sticks out even more clearly as a potential top thanks to Friday’s small setback.
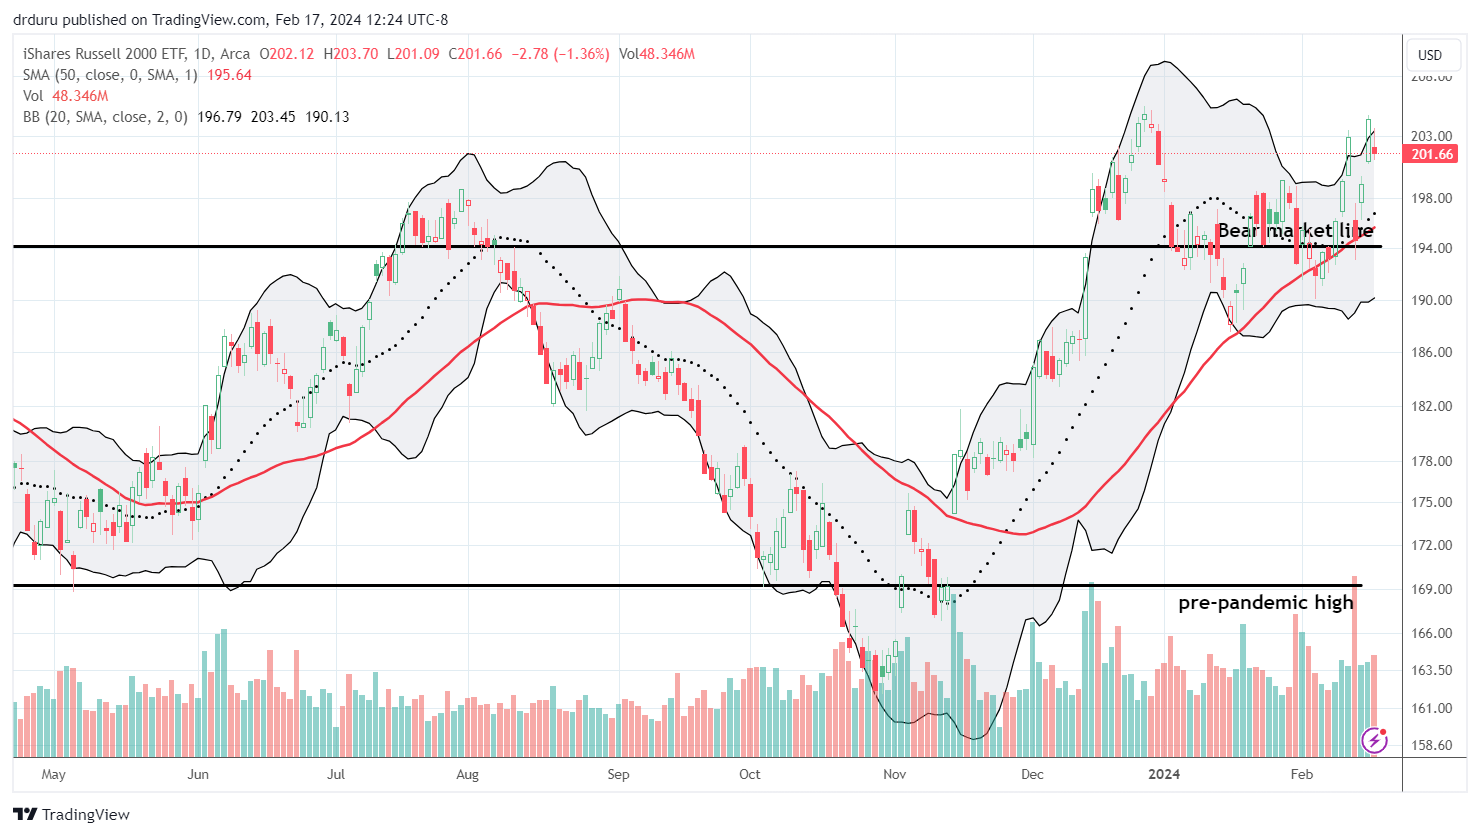
The iShares Russell 2000 ETF (IWM) gapped down on Friday with a 1.4% loss. That setback stopped IWM short of testing the high from 2023. Thus, I wave yet one more red flag. Overall, IWM has moved in large chunks while holding its 50DMA (red line), then 20DMA, and now the bear market line as sources of support. Behind the veneer of resilience sits signs of instability that leave me wary.
Despite my wariness, my latest IWM profits came from a bullish position. My residual IWM put expired harmless while my IWM calendar call spread hit its initial profit target. The ability to profit despite a down day is one of the key features I love about weekly calendar call spreads.
The Short-Term Trading Call With Chunks and Red Flags
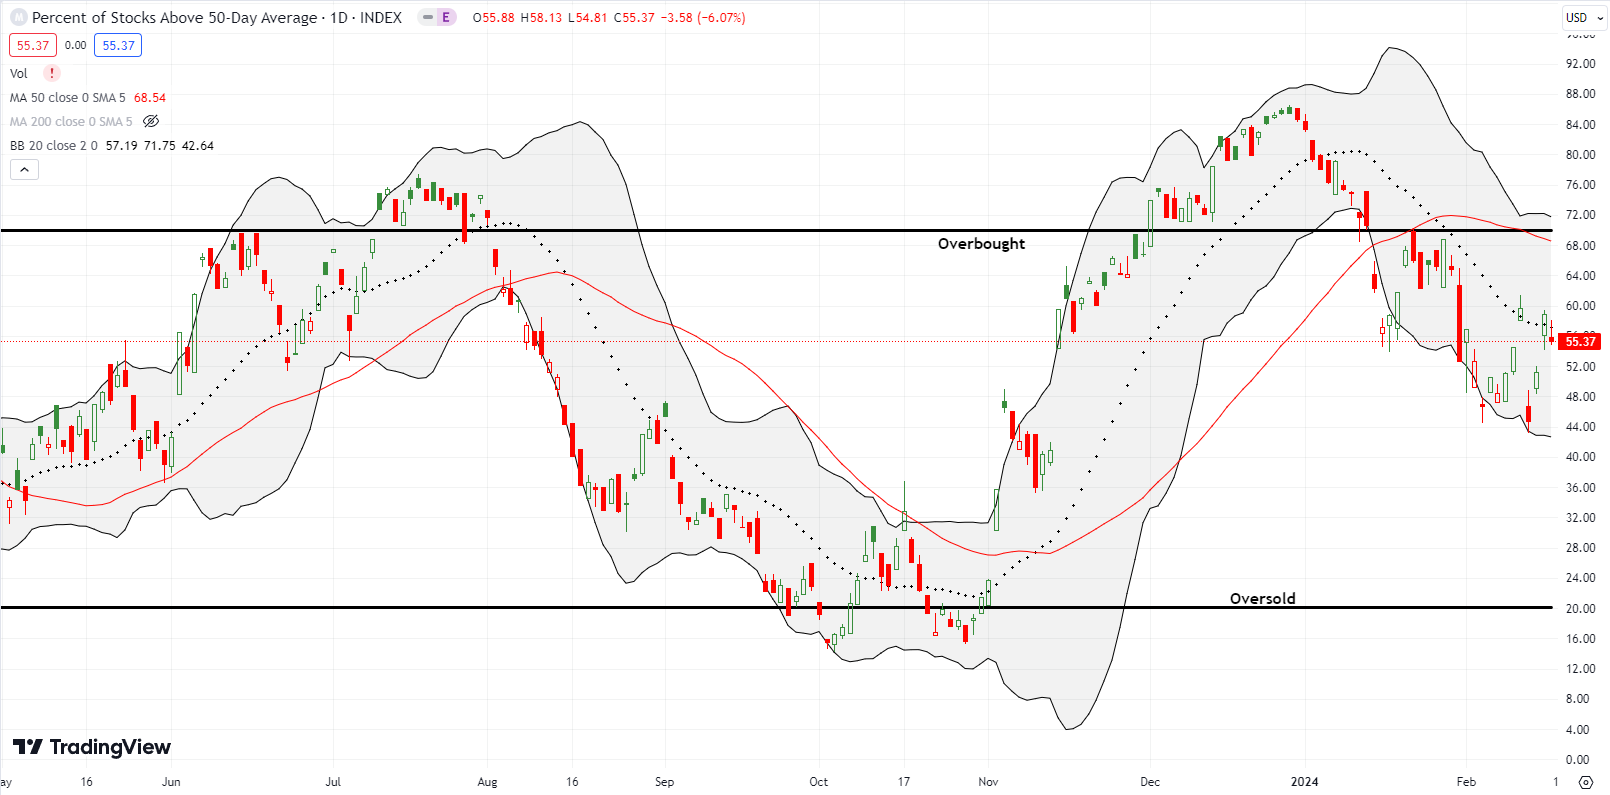
- AT50 (MMFI) = 55.4% of stocks are trading above their respective 50-day moving averages
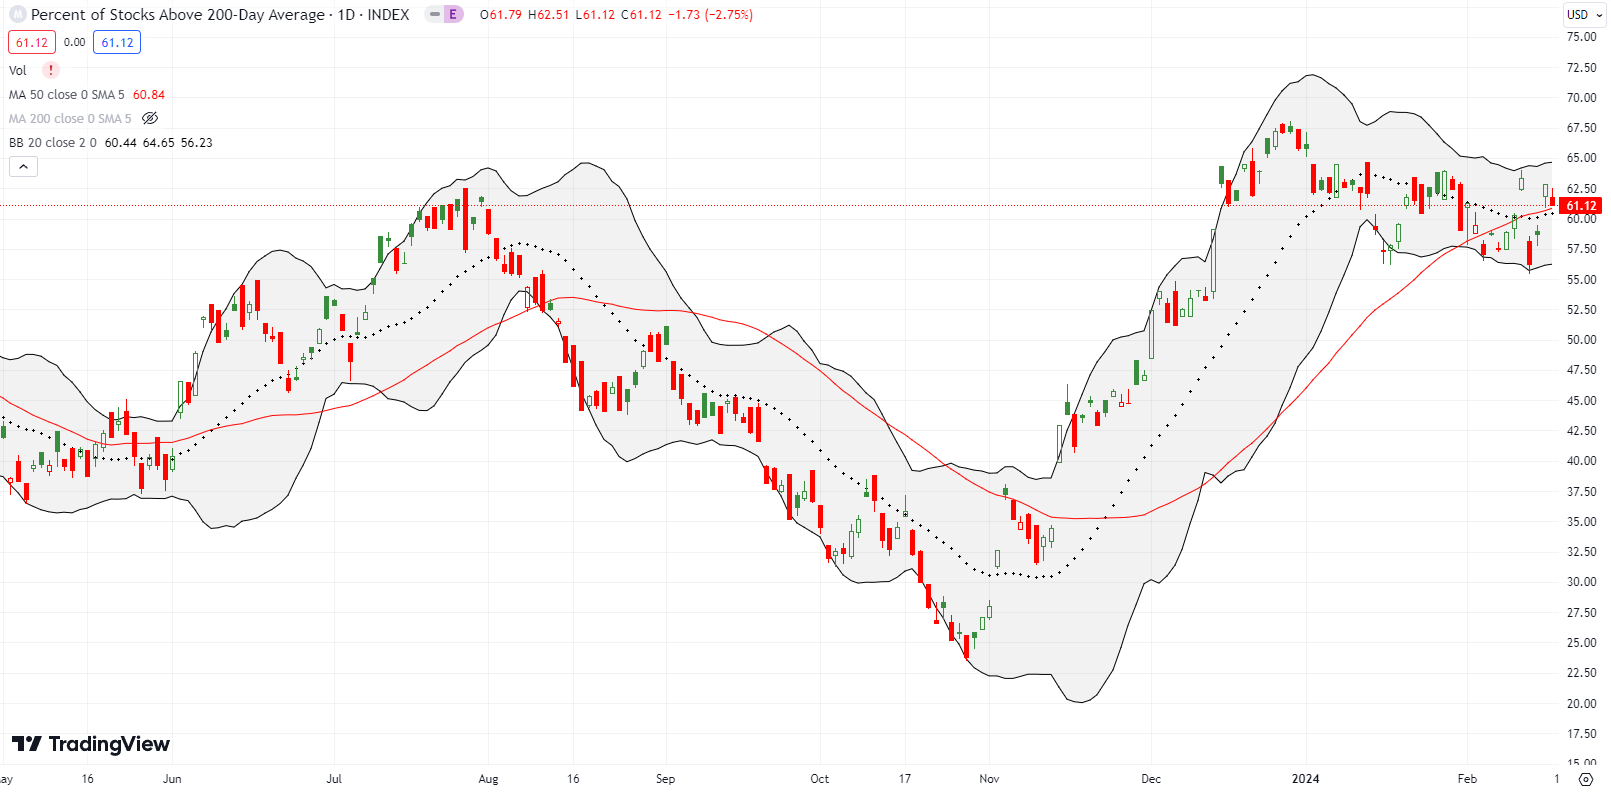
- AT200 (MMTH) = 61.1% of stocks are trading above their respective 200-day moving averages
- Short-term Trading Call: bearish
AT50 (MMFI), the percentage of stocks trading above their respective 50DMAs, closed at 55.4%. Its path the last two weeks has closely followed IWM’s path. However, my favorite technical indicator remains in a downtrend. Last week AT50 failed twice to end the downtrend so market breadth is still waving red flags at the market. With this downtrend in place, the price moves in chunks for individual stocks has me worried about market instability (beyond the largest, most liquid stocks of course). So the stock charts below show some of the big chunks that raised my red flags higher (in addition to The Children’s Place (PLCE) and Nano-X Imaging (NANO) that I presented in a short video).
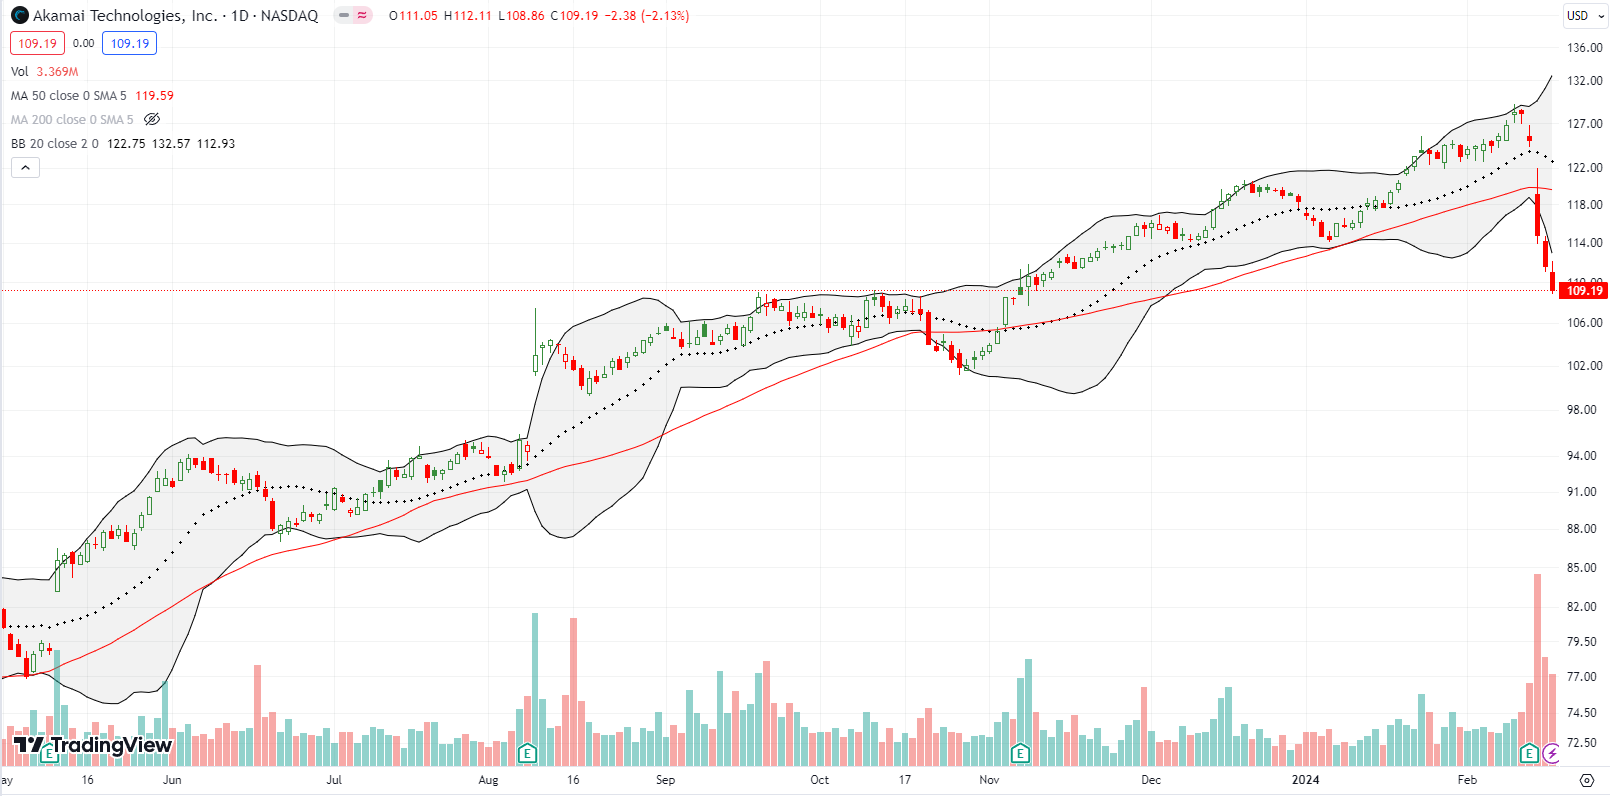
Content Delivery Network (CDN) provider Akami Technologies, Inc (AKAM) must have delivered poor content in its earnings report. The stock plunged below 50DMA support for the first time in 4 months with an 8.2% post-earnings loss. Sellers kept up the pressure for the next two trading days, taking more chunks out of the stock. AKAM closed the week at a 3-month low. I am targeting AKAM for a fade on a rally toward 50DMA resistance.
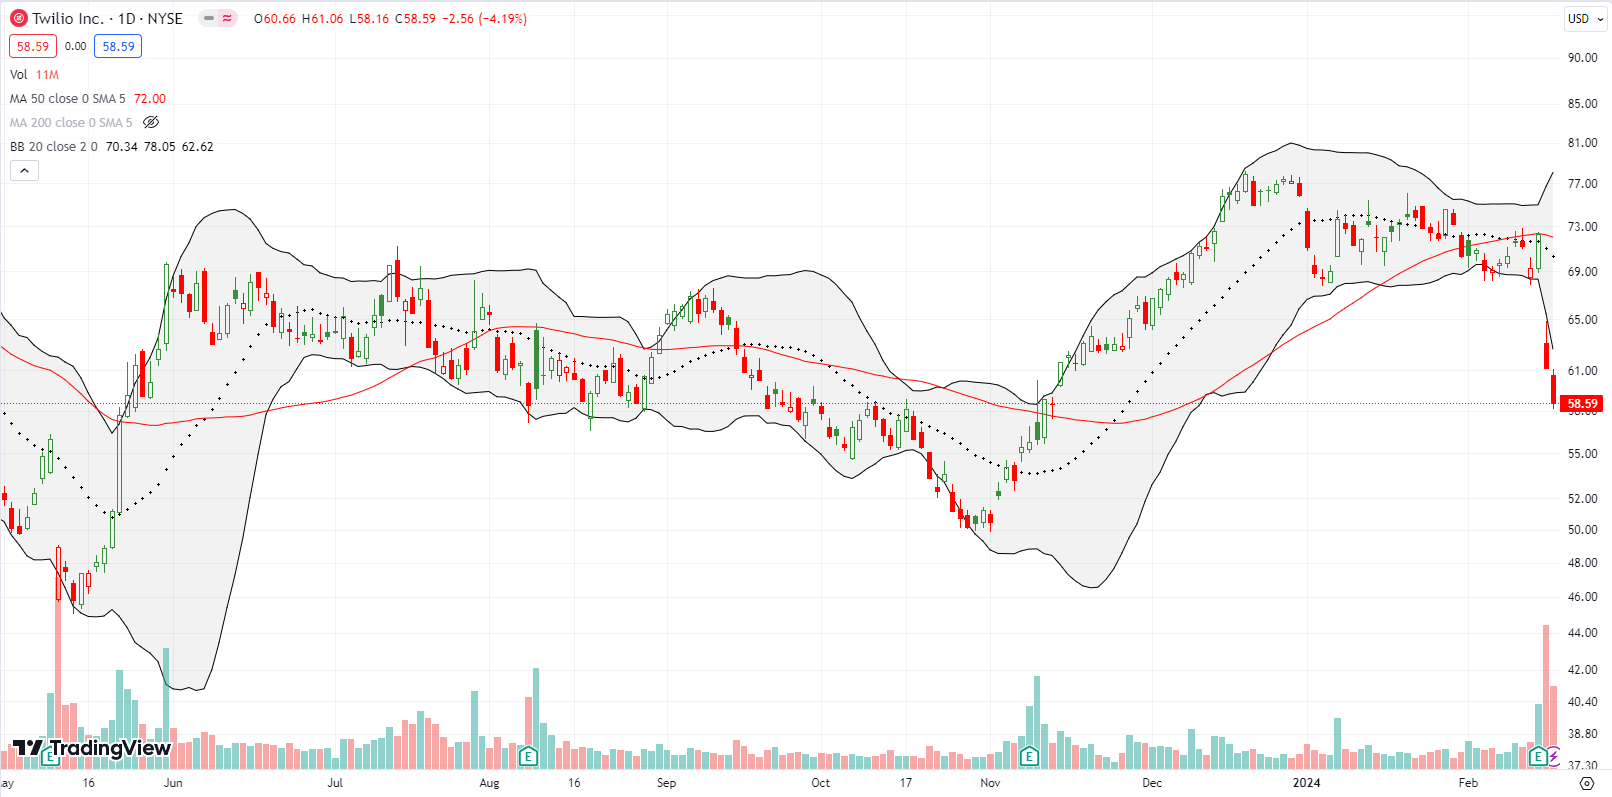
Looks like I had good reason for suspicion about Twilio Inc (TWLO)! The provider of mobile messaging services went from pleasing the market with Q4 guidance to disappointing the market with 2024 guidance. TWLO lost 15.4% post-earnings and closed at a 3-month low. The chunks continued with a 4.2% loss the next day. November’s breakout is now history. I am firmly back to being a TWLO skeptic (the stock) and will be looking for the next opportunity to fade the stock.
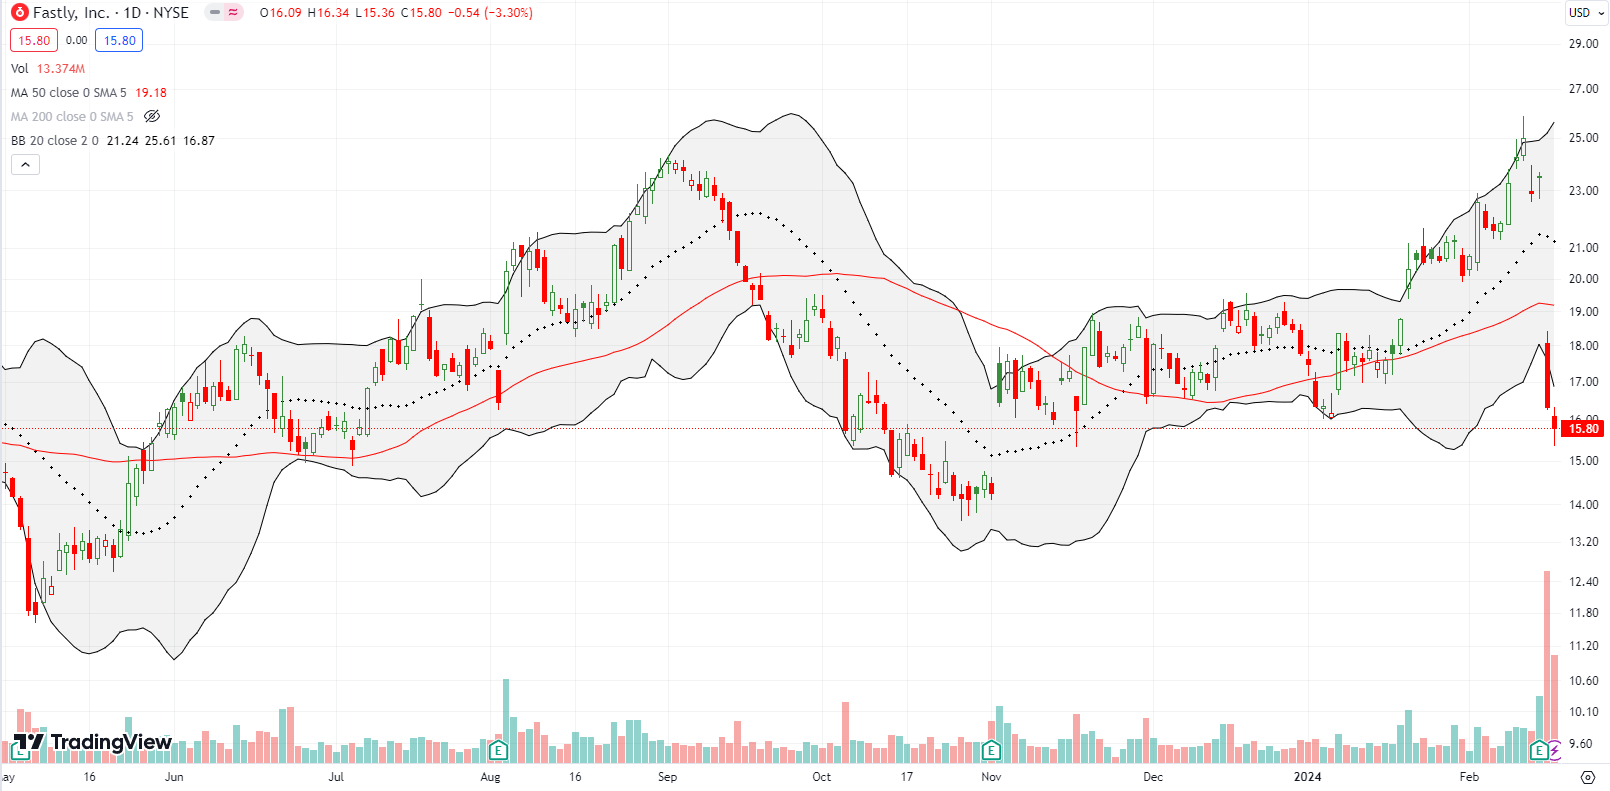
Fastly, Inc (FSLY) also reversed a breakout in a post-earnings plunge. FSLY lost 30% post-earnings with sellers adding a punctuation mark the next day. The plunge was one of those chunks that leaves me wondering what pre-earnings buyers were thinking or expecting. I traded pre-earnings put options on this one. FSLY closed at a 3+ month low and now sits in the middle of its gap up from last earnings.
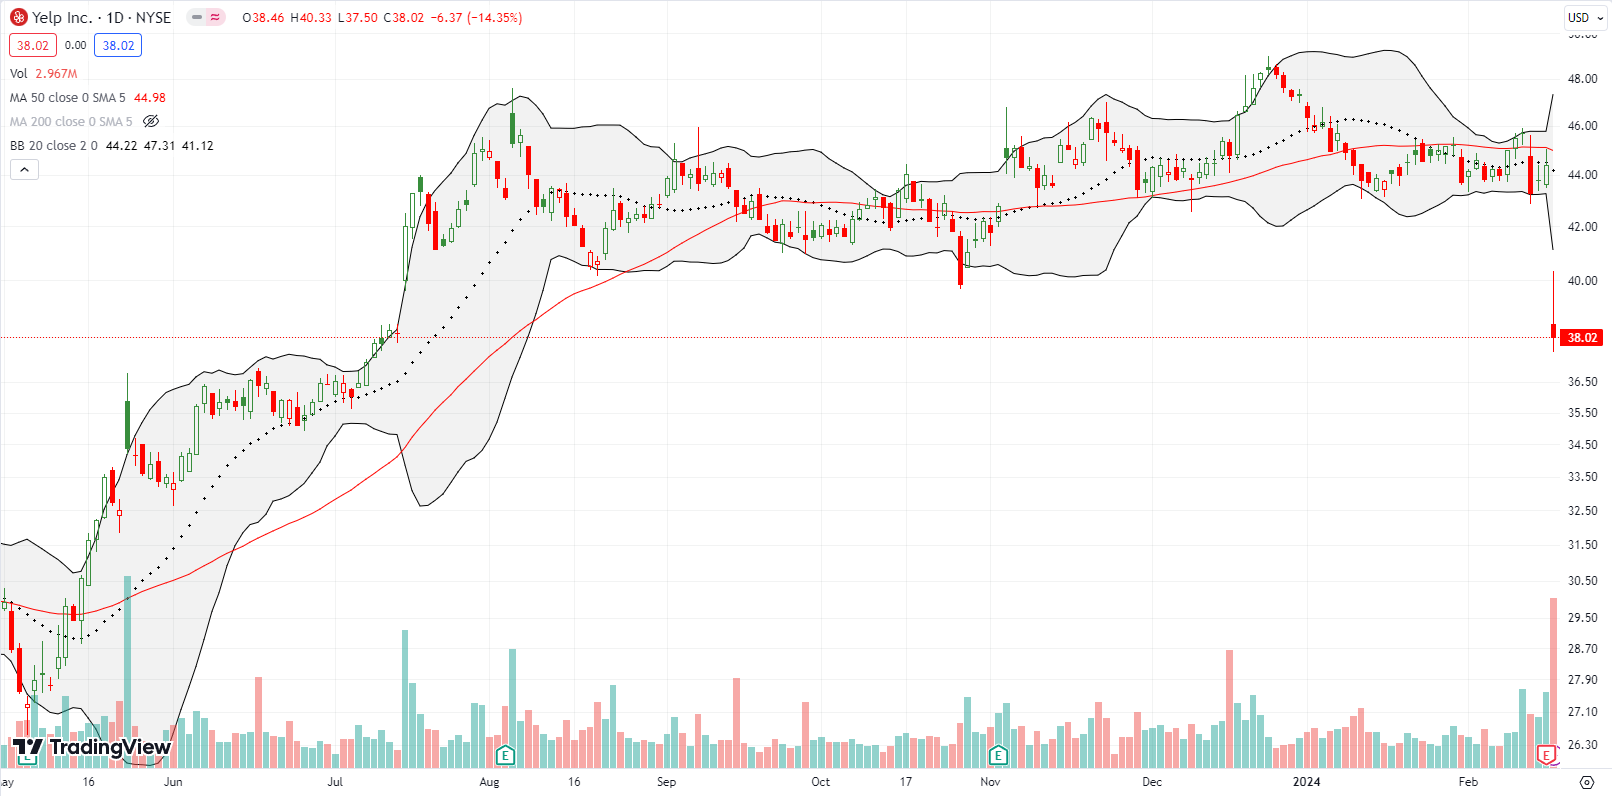
Yelp Inc (YELP) suffered a big chunk move to the downside. A 14% post-earnings loss took YELP to a 7-month low. The close finished reversing the post-earnings gap up from July, 2023. YELP’s plunge also brought an end to an 8-month trading range. I failed on a pre-earnings YELP call option. Still, I thought YELP was over-extended enough post-earnings to warrant a buy, but sellers continued. I am a big fan of YELP, so I was more prone to pull the trigger early. I will be looking for signs of seller’s exhaustion before I add to my position.
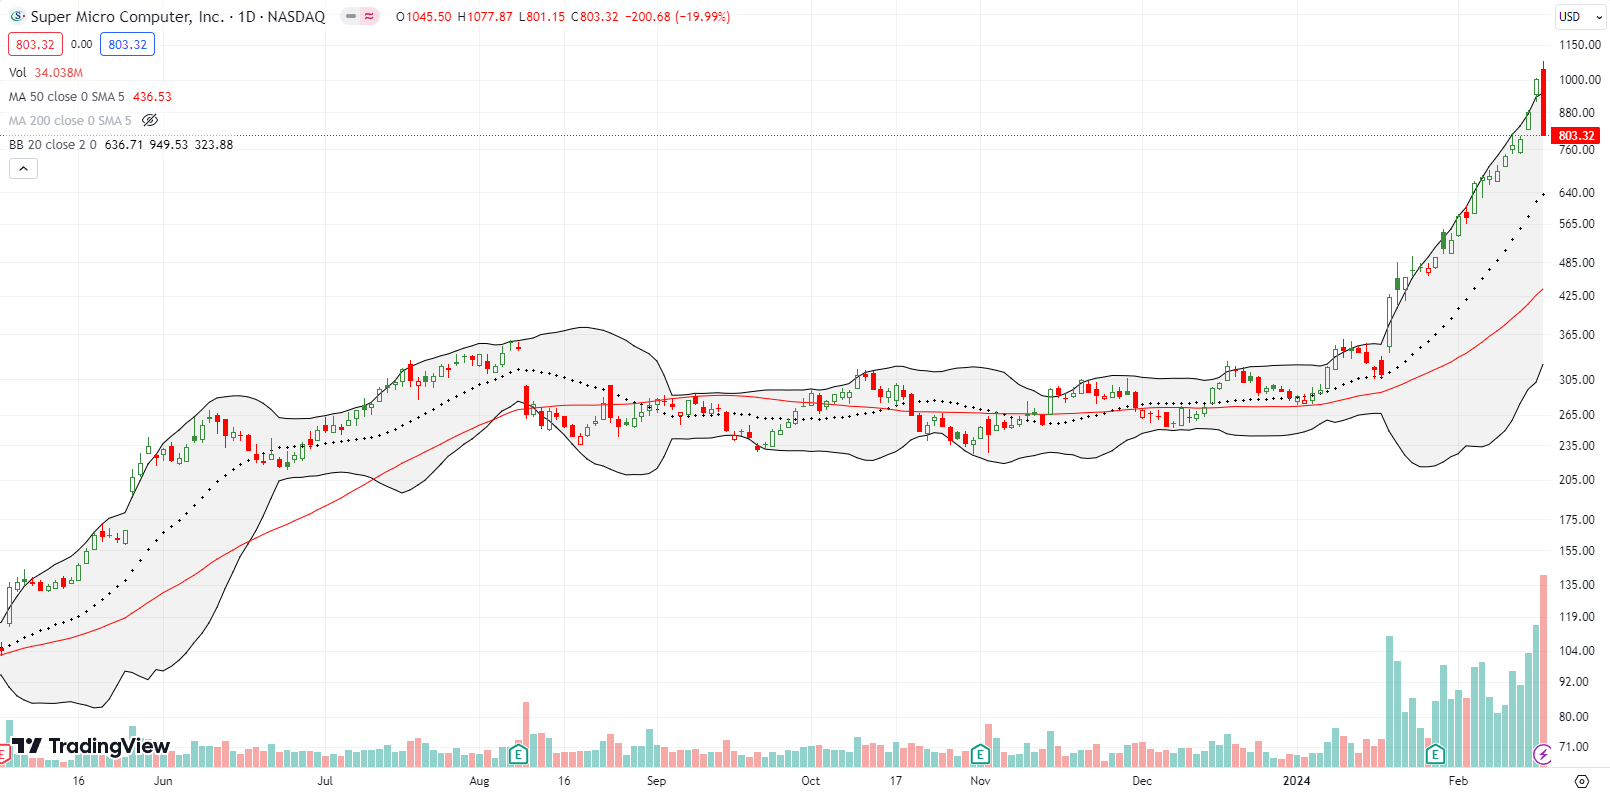
On January 19, Super Micro Computer (SMCI) broke out from a very long trading range with a 35.9% gain after issuing positive earnings guidance. That chunk move was followed by an earnings release that further supported the new momentum. SMCI steadily crept higher until the next chunk move took the stock down 20.0% on Friday. The resulting bearish engulfing pattern waved a very visual red flag over the stock. Needless to say, SMCI is even more dangerous, but I am sure the speculators will not give up easily on this one. Note the tremendous surge in trading volume since the breakout. The stock has a lot of (new?) believers…but these latecomers are also a source of tremendous supply if momentum sours.
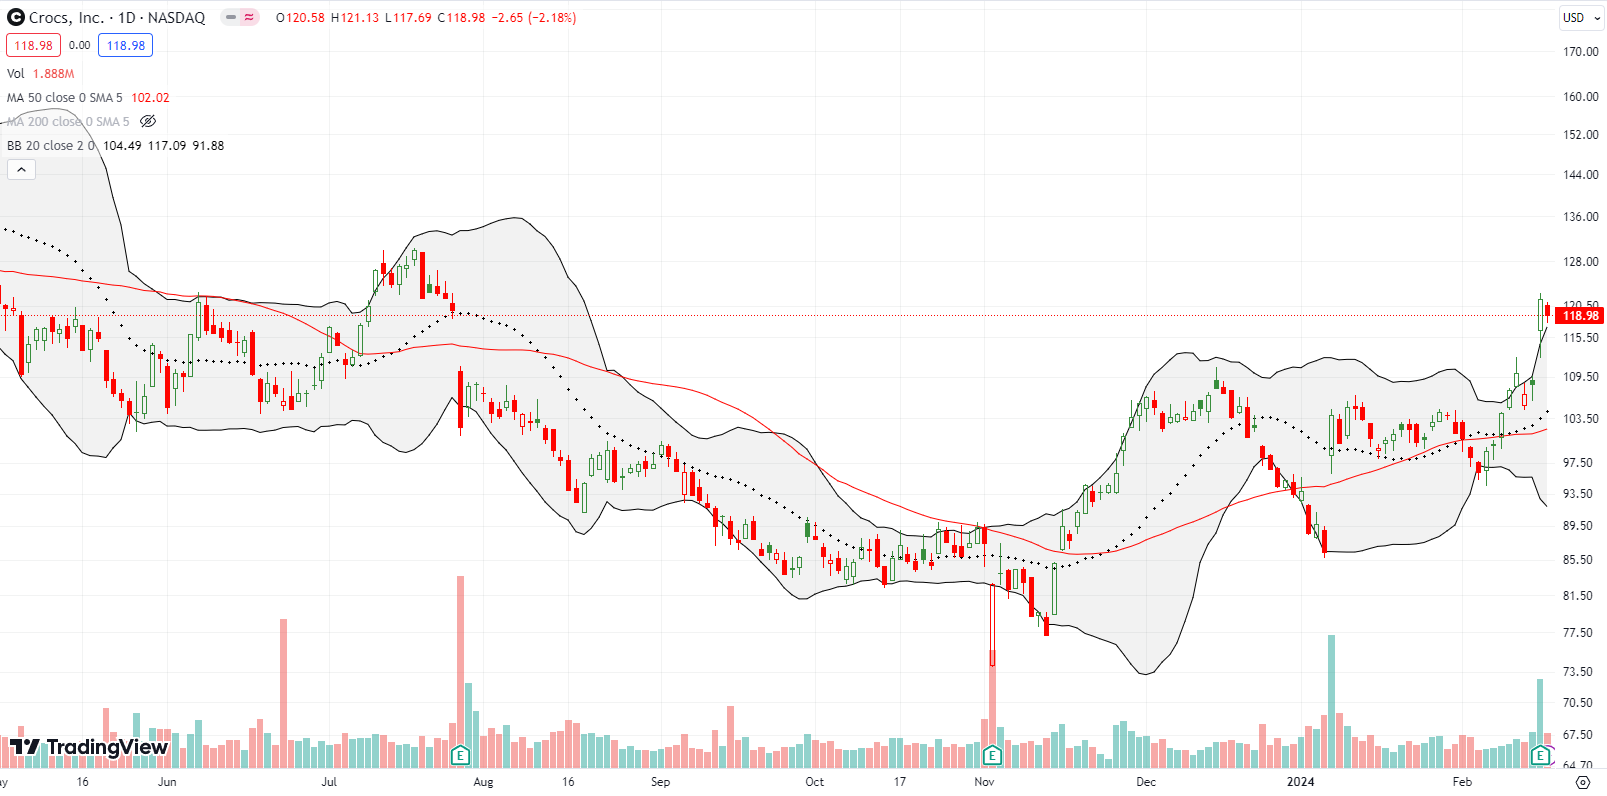
Shoe maker Crocs, Inc (CROX) is an amazing story of resilience in the face of passing fads and stubborn fakes. On January 8, CROX soared 20.4% in the wake of positive earnings guidance. It took another month for CROX to break out. That move ahead of earnings was a positive reinforcement (contrast this post-guidance price action with TWLO above). I happened to notice the constructive technicals and placed a pre-earnings trade with a call spread. The 12.2% post-earnings surge validated and rewarded my collective observations. CROX has now perfectly filled its post-earnings gap down from last July. The story stays bullish if CROX leaves behind that gap down.
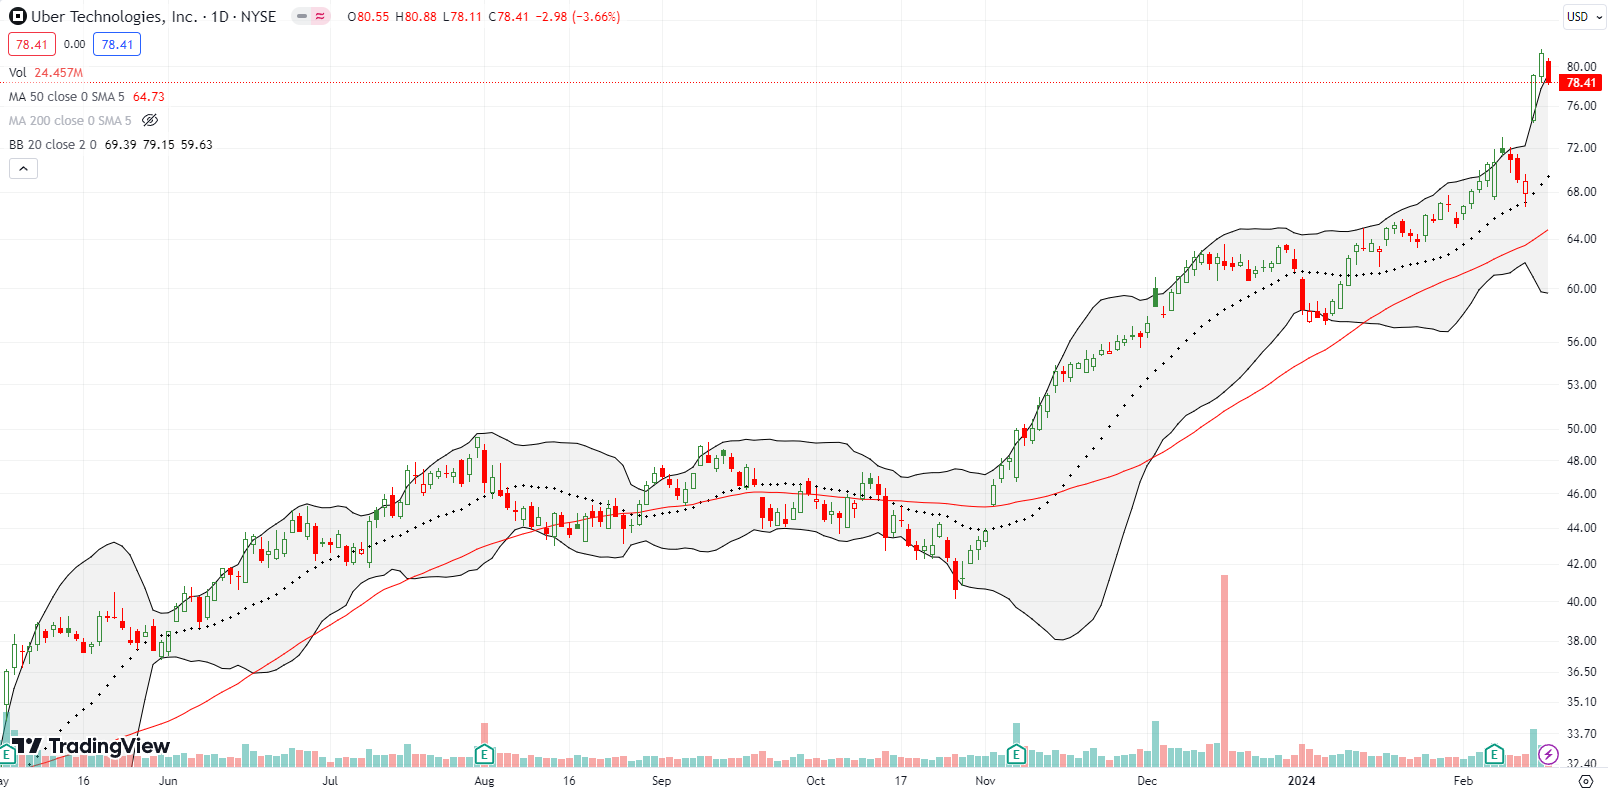
If I had not finally dropped my skepticism about Uber Technologies, Inc (UBER) last month, last week’s news and price action would have forced the issue! UBER surged 14.7% in the wake of surprising news about a massive share repurchase authorization. This bold move signals a lot of confidence especially given UBER is trading at all-time highs. I generally dislike companies buying their shares while they are “expensive.” I will watch the price action from here. A reversal of this chunk move will wave a yellow flag on the stock. Otherwise, it is all systems go for UBER. Note how UBER delivered a picture-perfect test of 20DMA support ahead of the news.
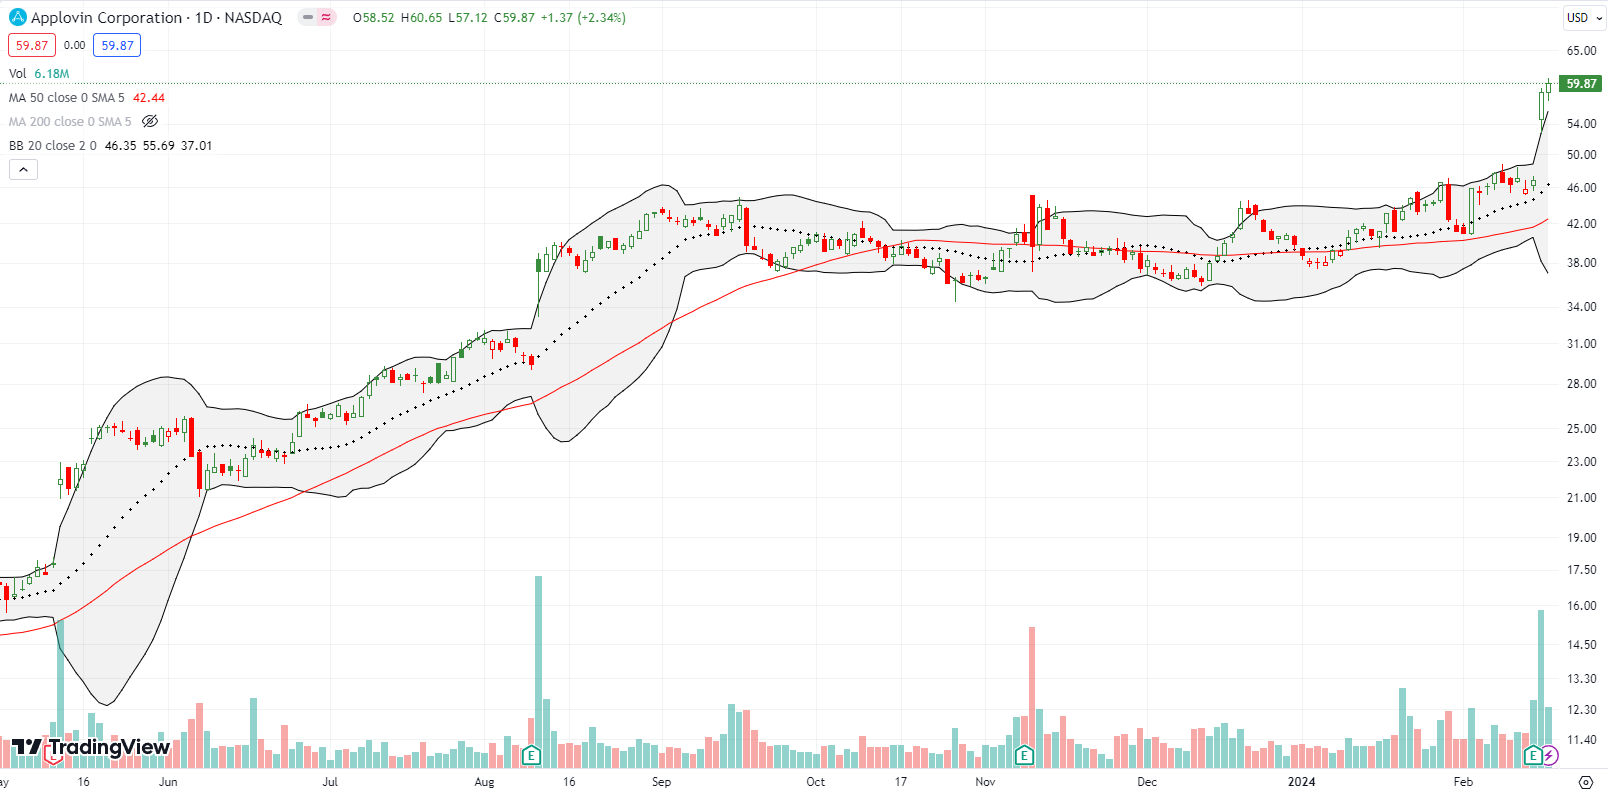
I have had my eye on mobile app digital marketing platform Applovin Corp (APP) since the stock surprisingly faded after a strong November earnings report. At the time I bet on a breakout and only scraped out pennies from the trade. I reloaded ahead of last week’s earnings and was rewarded with a 24.8% post-earnings breakout. Of course, this kind of validation runs counter to my general bearishness on the market. Still, I am going to take these opportunities as long as the market continues to offer them.
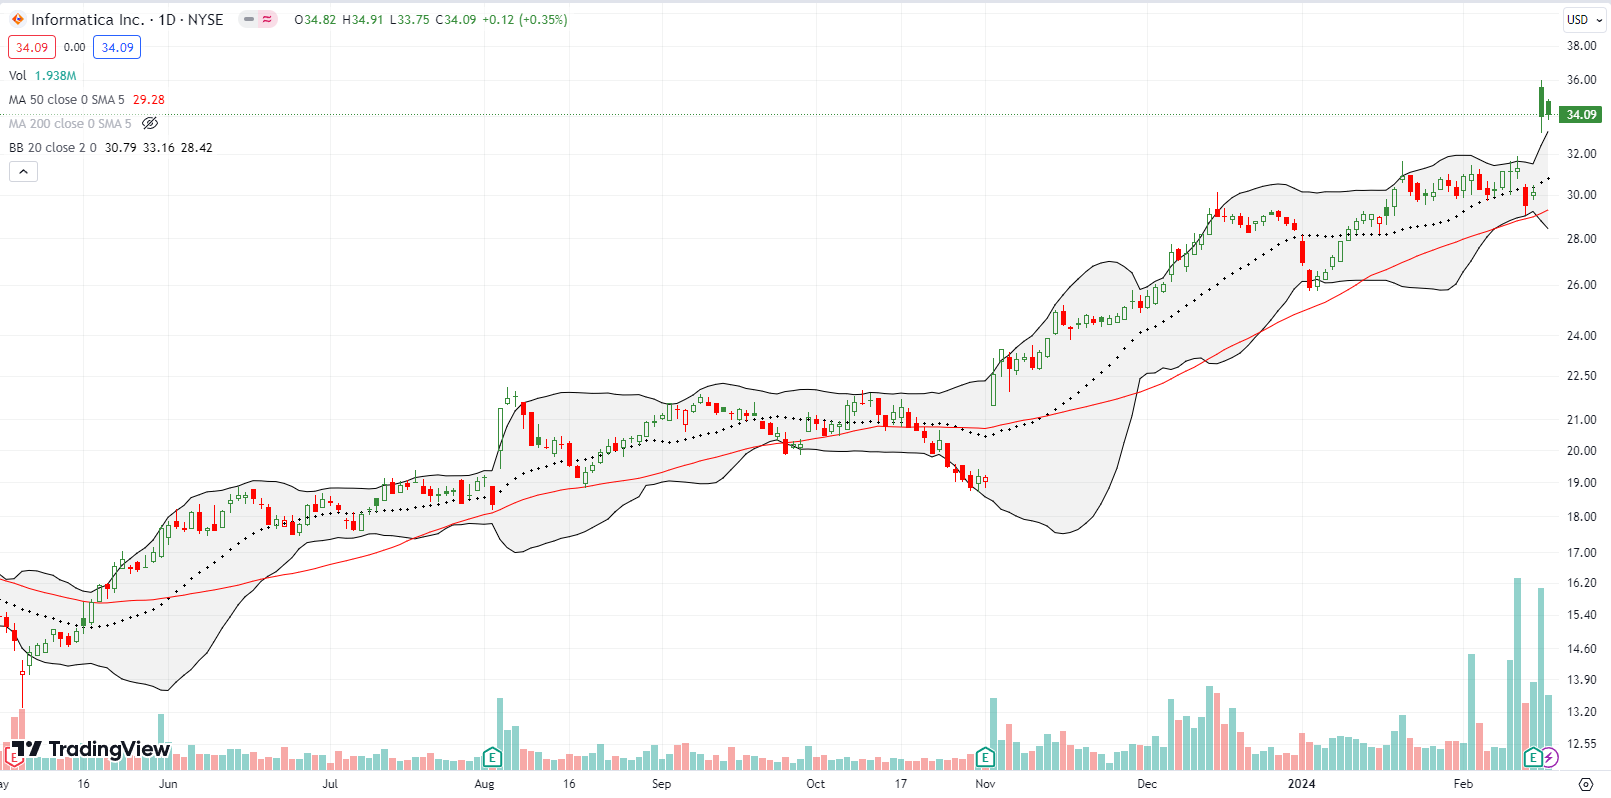
I made the case for Informatica Inc (INFA) back in November. Yet somehow I missed buying shares and building a position. I even missed the dip at the beginning of the year because it did not quite test 50DMA support. So when INFA dipped just ahead of earnings to its 50DMA, I took a page out of a cousin’s playbook and sold two put options; I was definitely ready to buy the stock at lower prices after missing the rally. INFA popped 12.7% post-earnings and sent the put options to zero. I am of course not complaining about the profits, but now I need to keep monitoring INFA for the next entry point.
Be careful out there!
Footnotes
Subscribe for free to get email notifications of future posts!
“Above the 50” (AT50) uses the percentage of stocks trading above their respective 50-day moving averages (DMAs) to measure breadth in the stock market. Breadth defines the distribution of participation in a rally or sell-off. As a result, AT50 identifies extremes in market sentiment that are likely to reverse. Above the 50 is my alternative name for “MMFI” which is a symbol TradingView.com and other chart vendors use for this breadth indicator. Learn more about AT50 on my Market Breadth Resource Page. AT200, or MMTH, measures the percentage of stocks trading above their respective 200DMAs.
Active AT50 (MMFI) periods: Day #59 over 20%, Day #57 over 30%, Day #55 over 40%, Day #3 over 50% (overperiod), Day #15 under 60%, Day #26 under 70%
Source for charts unless otherwise noted: TradingView.com
Full disclosure: long YELP
FOLLOW Dr. Duru’s commentary on financial markets via StockTwits, Twitter, and even Instagram!
*Charting notes: Stock prices are not adjusted for dividends. Candlestick charts use hollow bodies: open candles indicate a close higher than the open, filled candles indicate an open higher than the close.


