Stock Market Commentary
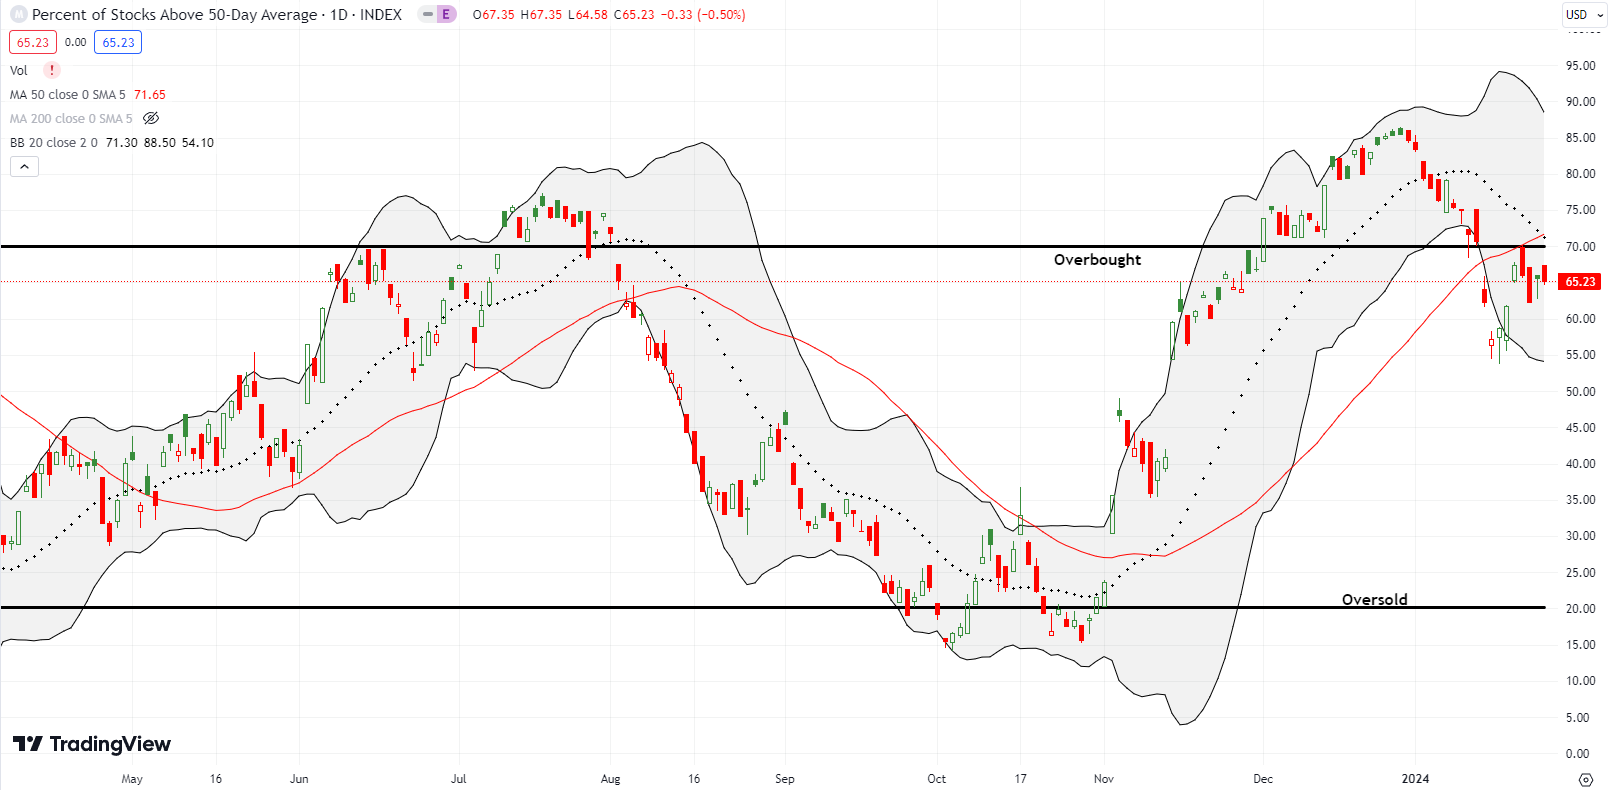
A bearish divergence is well underway in the stock market. While the S&P 500 and NASDAQ rally, a key bearish trading signal persists in market breadth. The previous week, market breadth created a strong bearish signal by slicing below the overbought threshold. This key bearish trading signal was reinforced by last week’s failure to overcome the 70% threshold. This divergence causes a kind of cognitive dissonance as well. My market breadth trading rules and experience tell my rational side to stick to the bearish side of the market’s two truths. The plentitude of bullish stock patterns tell my emotional side to ride the bull as far as possible! Thus, I have a motto for this year to anchor me: “be ready so I don’t have to get ready.”
The Stock Market Indices
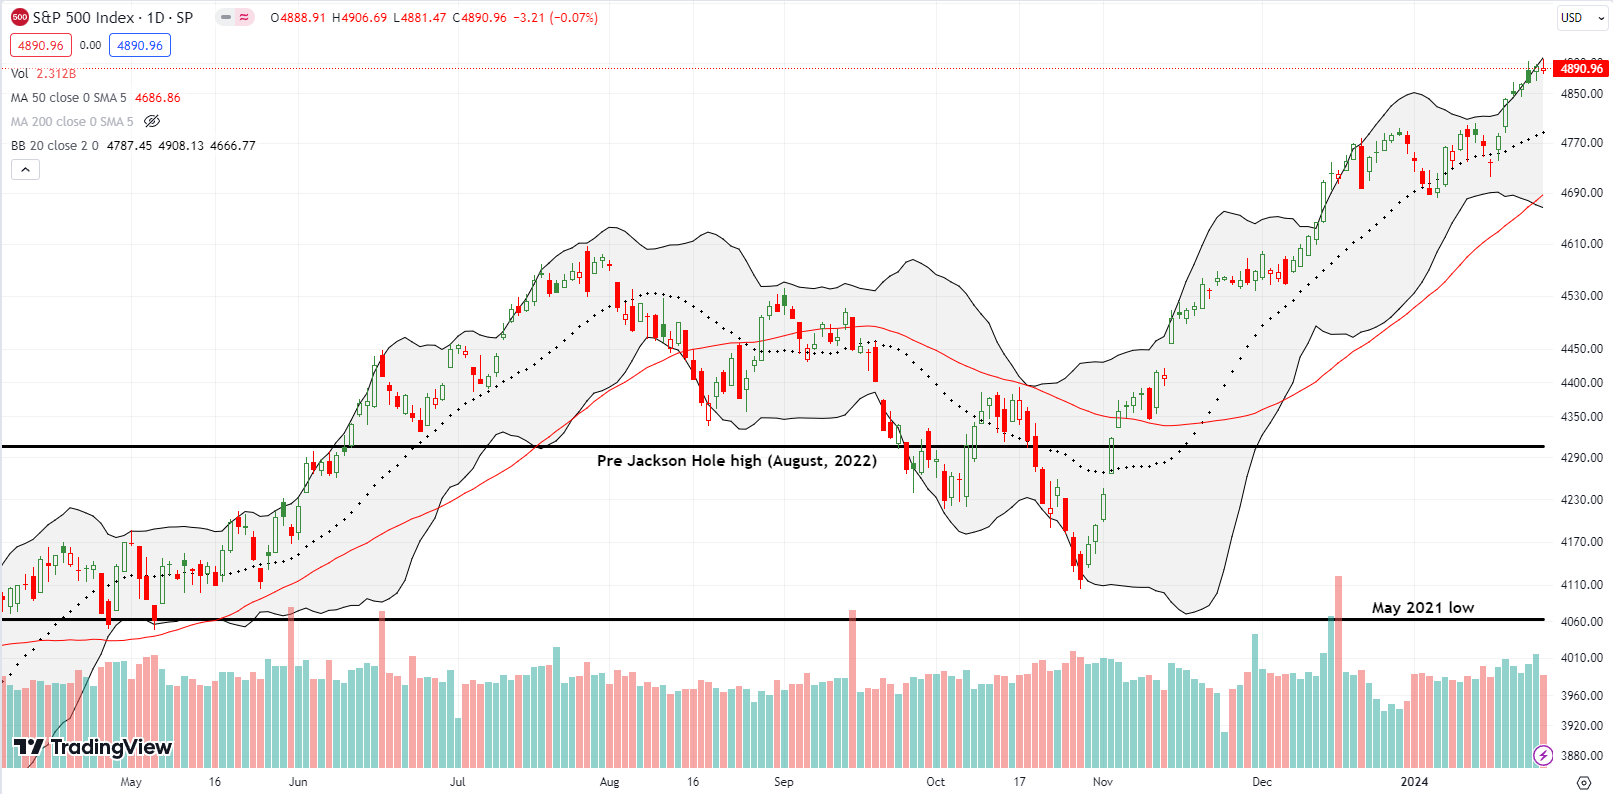
The S&P 500 (SPY) stepped steadily higher the first 4 days of last week and set all-time highs each time. Friday’s flat close provided the slightest hint of exhaustion. The blip by itself is not a key bearish trading signal.
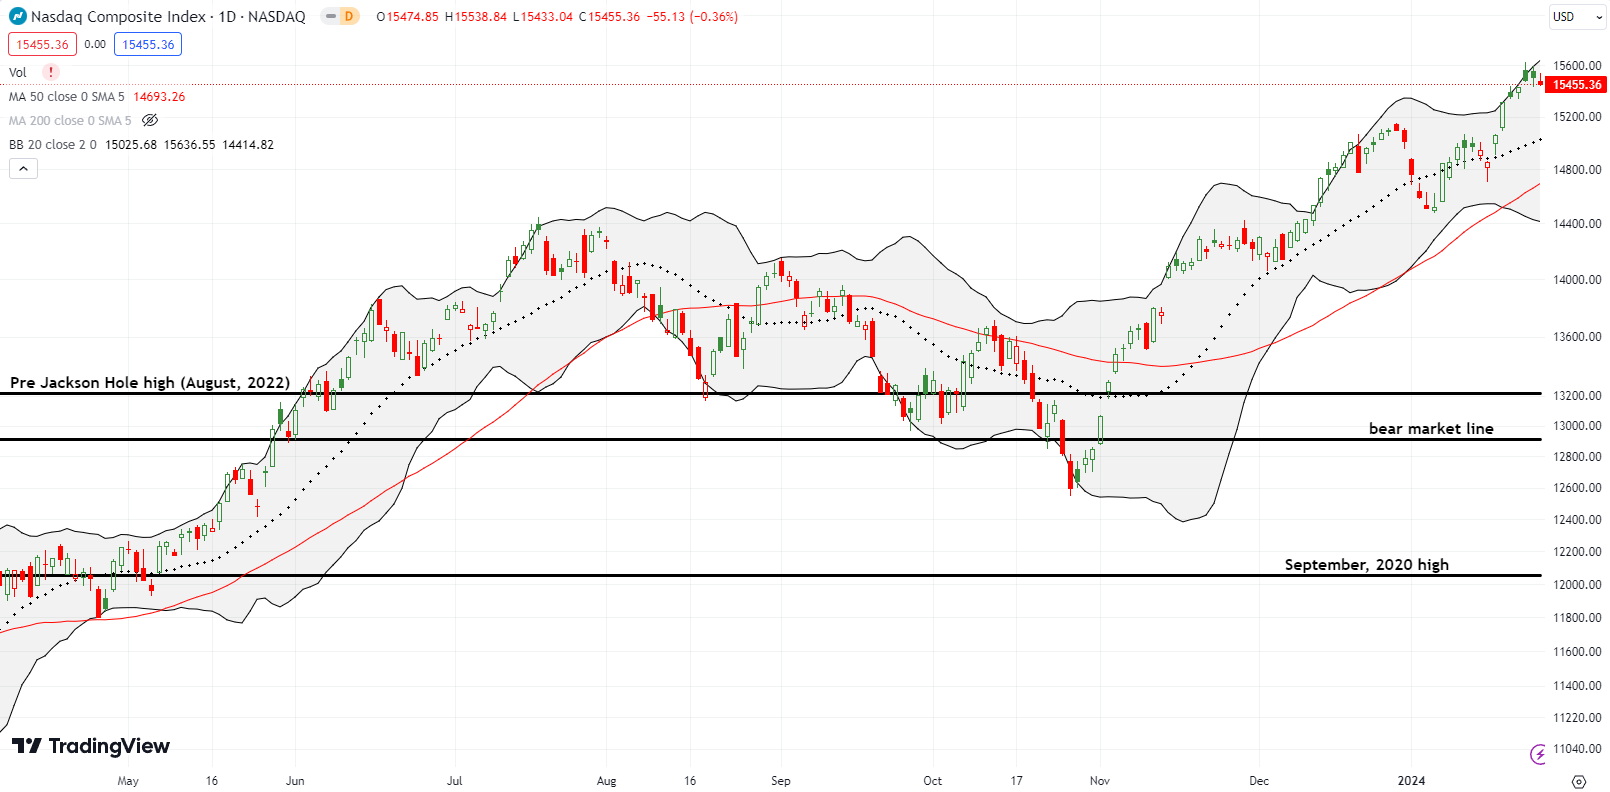
The NASDAQ (COMPQ) had a Friday weak enough to suggest that tech buyers are finally a little exhausted. The pattern is not quite a key bearish trading signal, but it is a step in the right direction. The tech laden index lost 0.4% after two days of struggling to deliver for buyers. Sellers need to follow-through to create momentum for a test of 20DMA support or more.
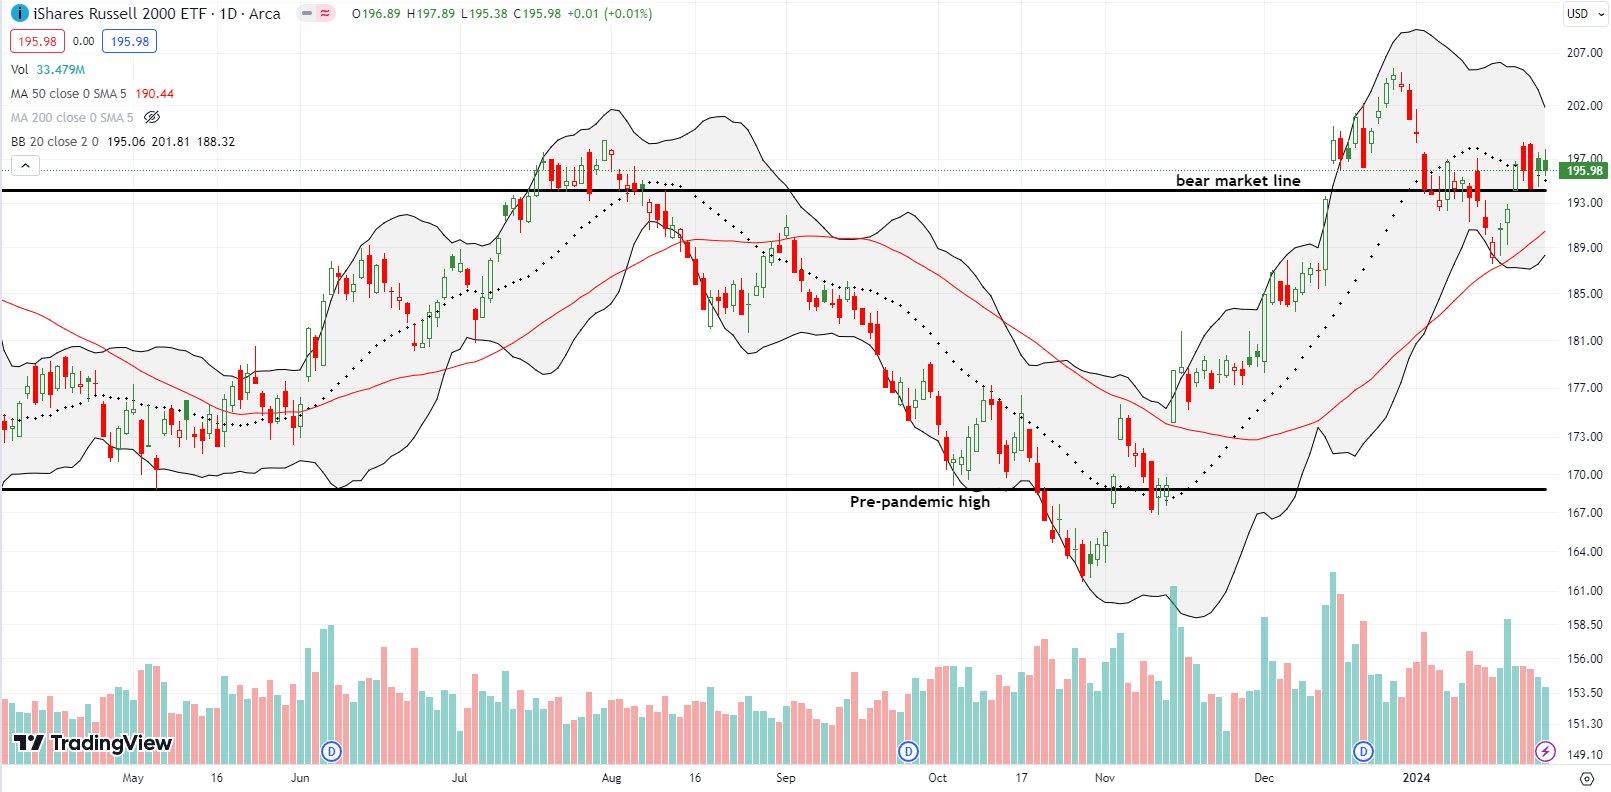
The iShares Russell 2000 ETF (IWM) churned after starting the week with a 2.1% gain and breakout above its bear market line. I thought this line would hold as resistance. Instead, the ETF of small caps is making an effort to hold the line as support. I went ahead and added a put option to my bet against IWM. Having said that, subsequent selling could enjoy a fresh show of support from an uptrending 50DMA.
The Short-Term Trading Call With A Key Bearish Trading Signal
- AT50 (MMFI) = 65.2% of stocks are trading above their respective 50-day moving averages
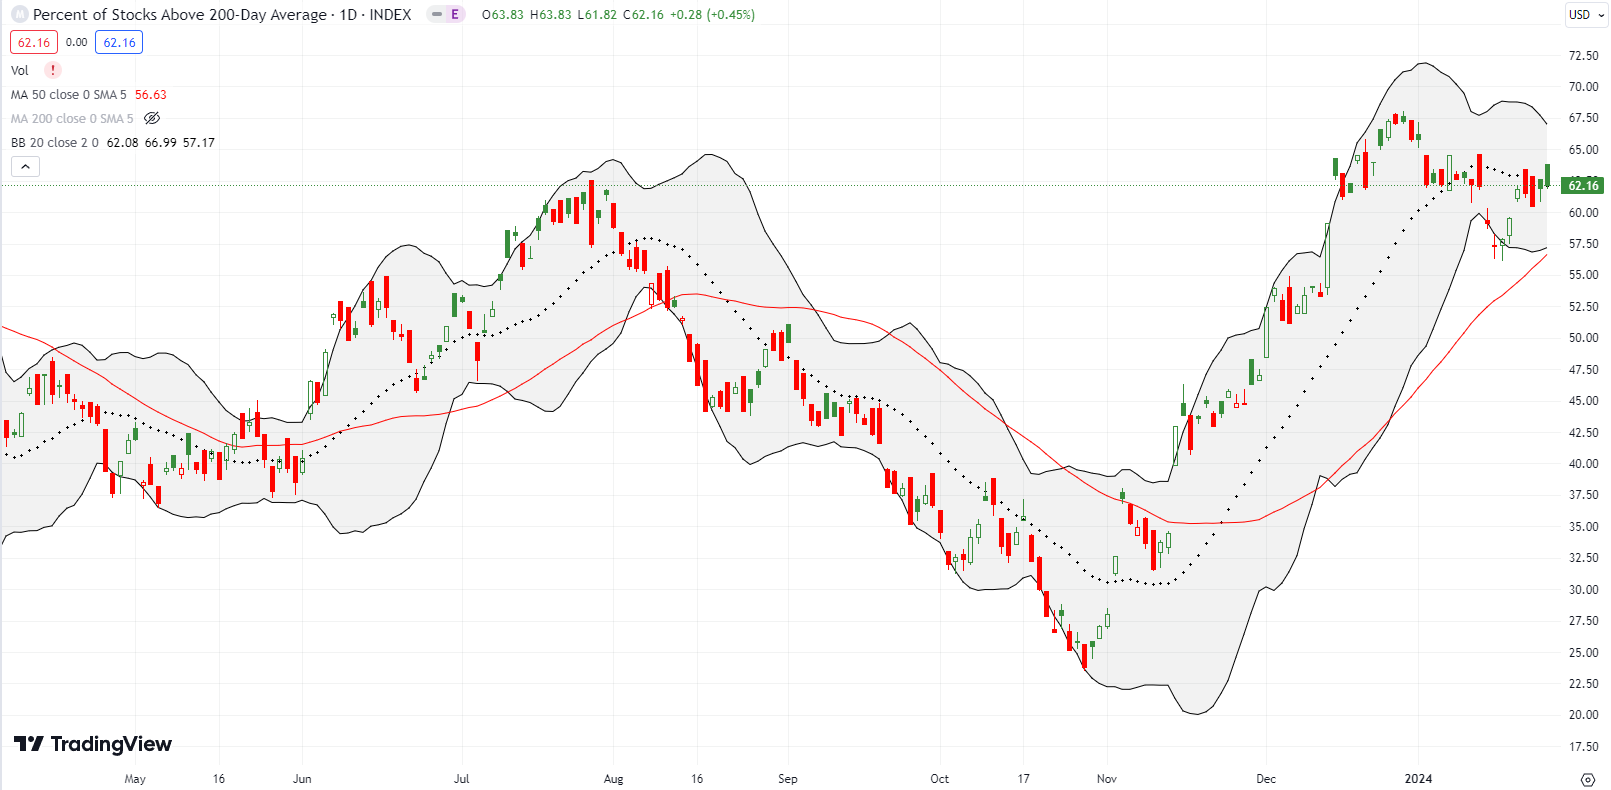
- AT200 (MMTH) = 62.2% of stocks are trading above their respective 200-day moving averages
- Short-term Trading Call: bearish
AT50 (MMFI), the percentage of stocks trading above their respective 50DMAs, closed at 65.2%. Importantly, on Tuesday, my favorite technical indicator jumped right to the overbought threshold of 70% and reversed direction. Sellers confirmed this bearish rejection the following day. According to my AT50 trading rules, this behavior is a key bearish trading signal. Thus, I dropped “cautiously” from the short-term trading call. It is a difficult call to make given all the impressive corners of bullishness in the market. Sectors like semiconductors and financials are experiencing strong breakouts. Per rule, I will flip to neutral if AT50 returns to overbought trading.
Most of the following charts help me confirm my bearish bias…
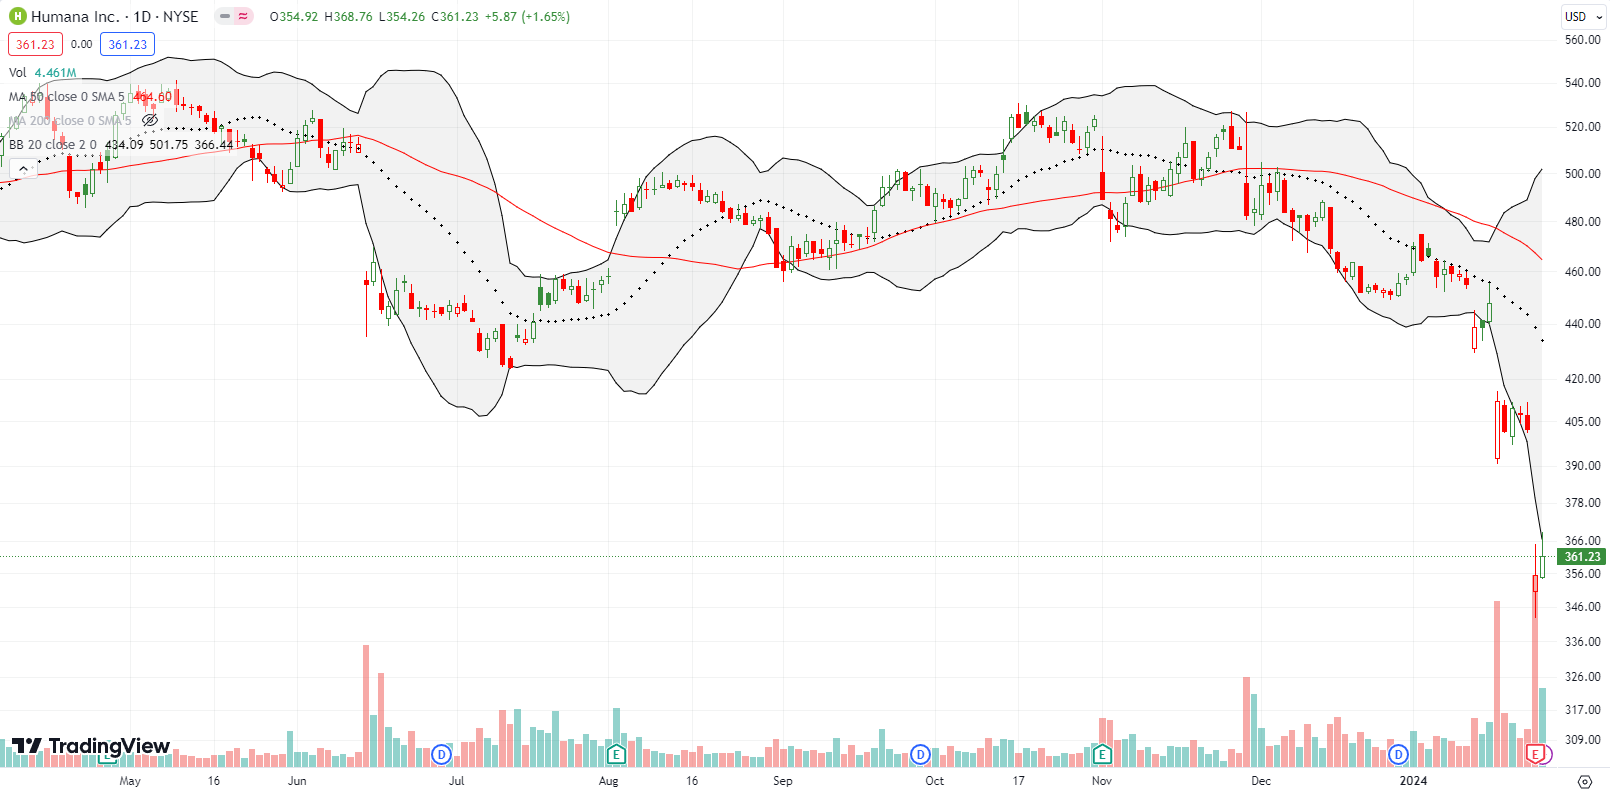
The pain did not end for Humana Inc (HUM) with its pre-earnings warning. Apparently, the company managed to deliver even more bad news for its earnings report. The health insurer shocked analysts with full-year guidance well under expectations (I do not know whether analysts reduced expectations after the earnings warning). HUM lost 11.7% on Thursday and dropped to a 3-year closing low. In a market of two truths, Humana is trapped deep in a bearish truth.
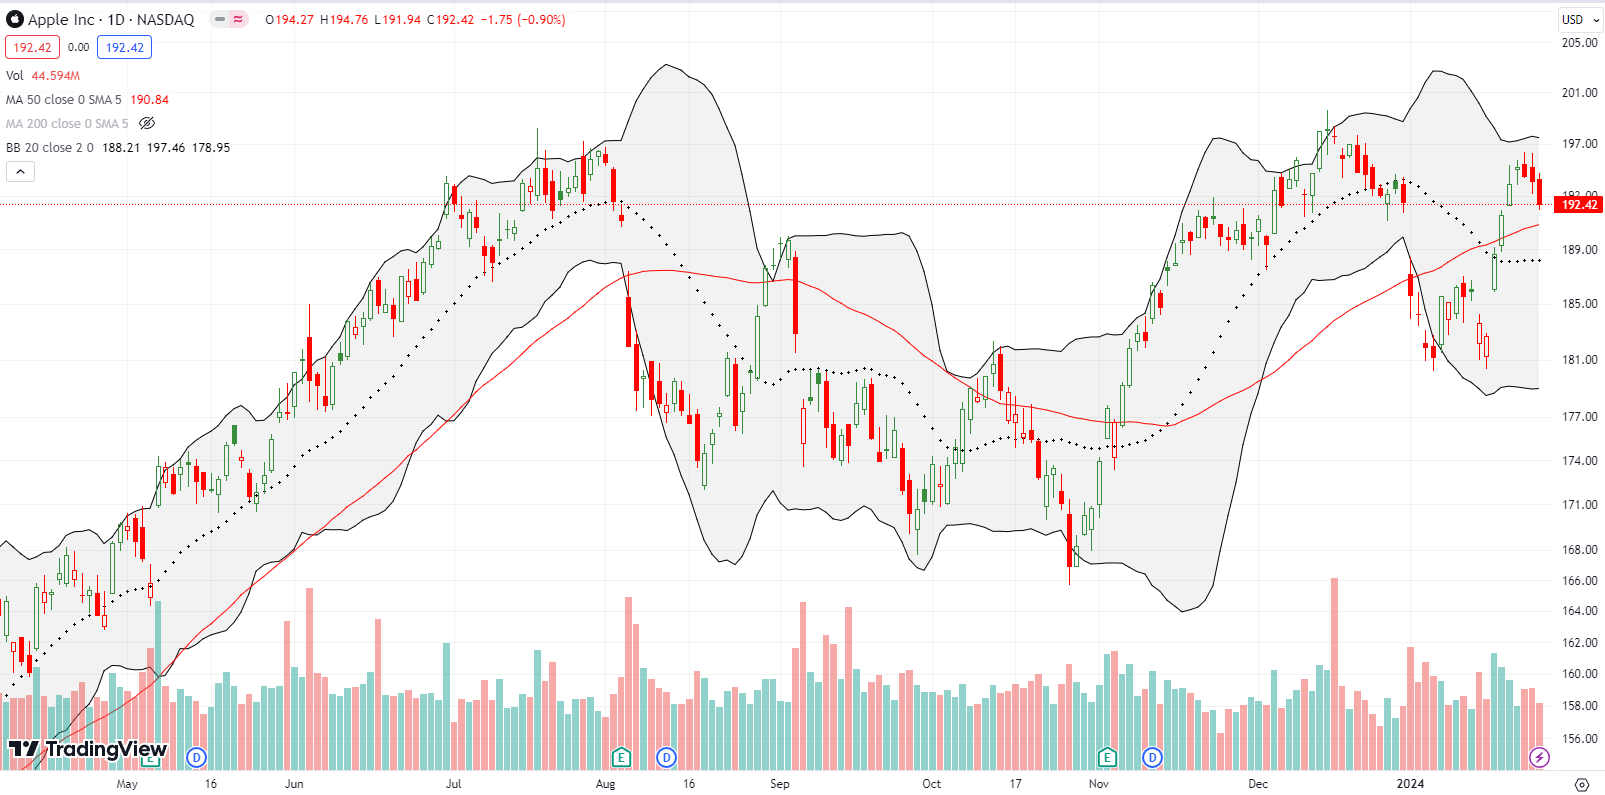
Apple Inc (AAPL) is in a different kind of bearish position. While the stock remains above an uptrending 50-day moving average (DMA) (the red line below), its recovery rally fell short of challenging the all-time high. The subsequent 3 days of selling looks like exhaustion ahead of disappointing earnings news. I did not activate the Apple Trading Model (ATM) as my target call spread did not quite hit my preferred entry price.
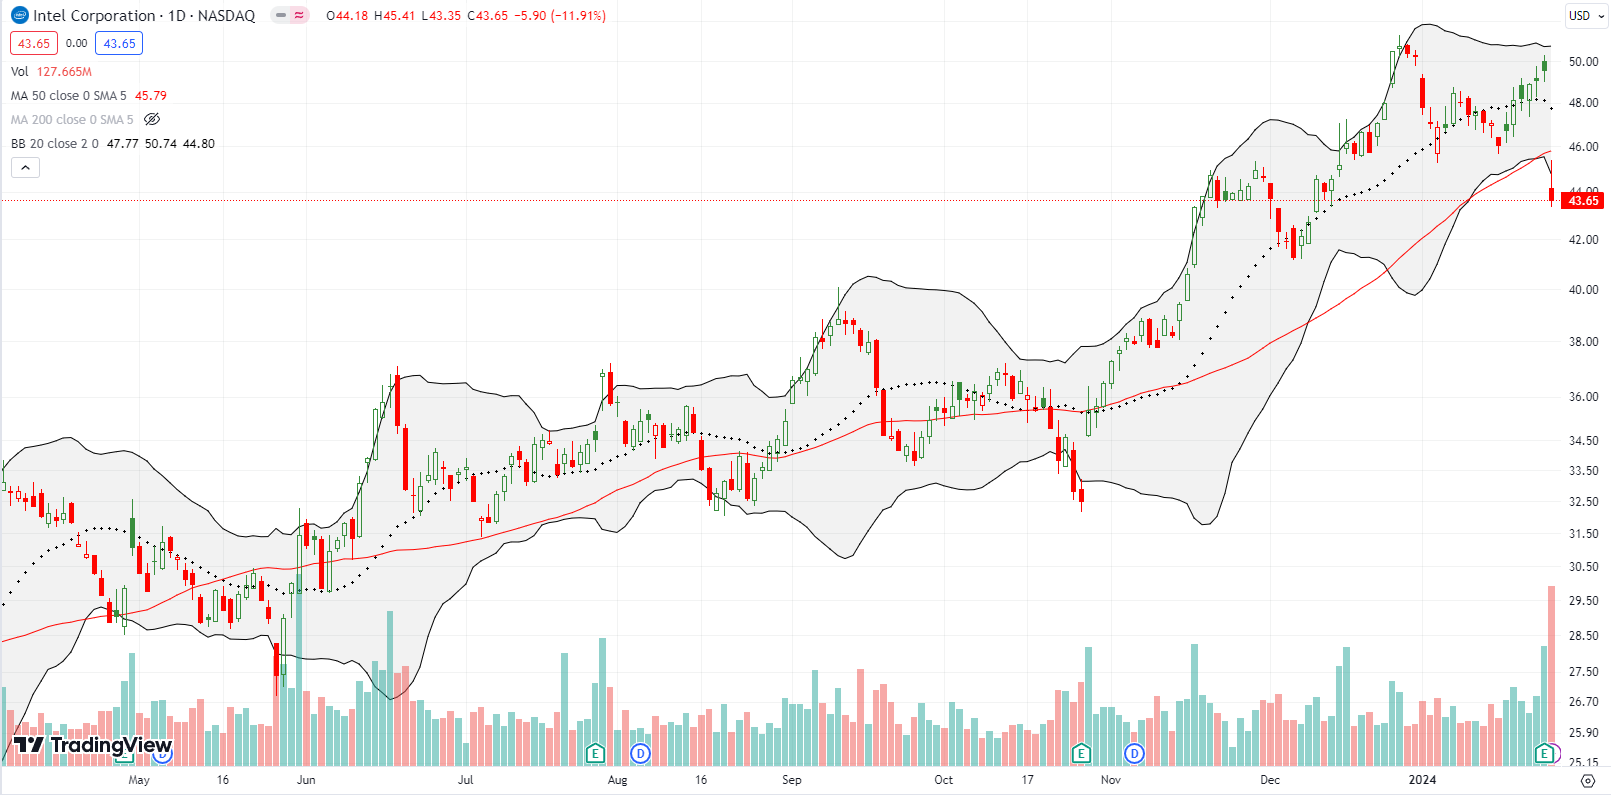
So much for Intel Corporation (INTC) riding the coattails of the bullish rally in semiconductor stocks. An 11.9% post-earnings plunge and 50DMA breakdown left behind what looks like a double-top. INTC’s crime was providing revenue and earnings guidance well below analyst expectations. I am now looking to buy between earnings call options on INTC. I am waiting for either 1) a close above the 50DMA, or 2) a much lower close, like a retest of the December lows.
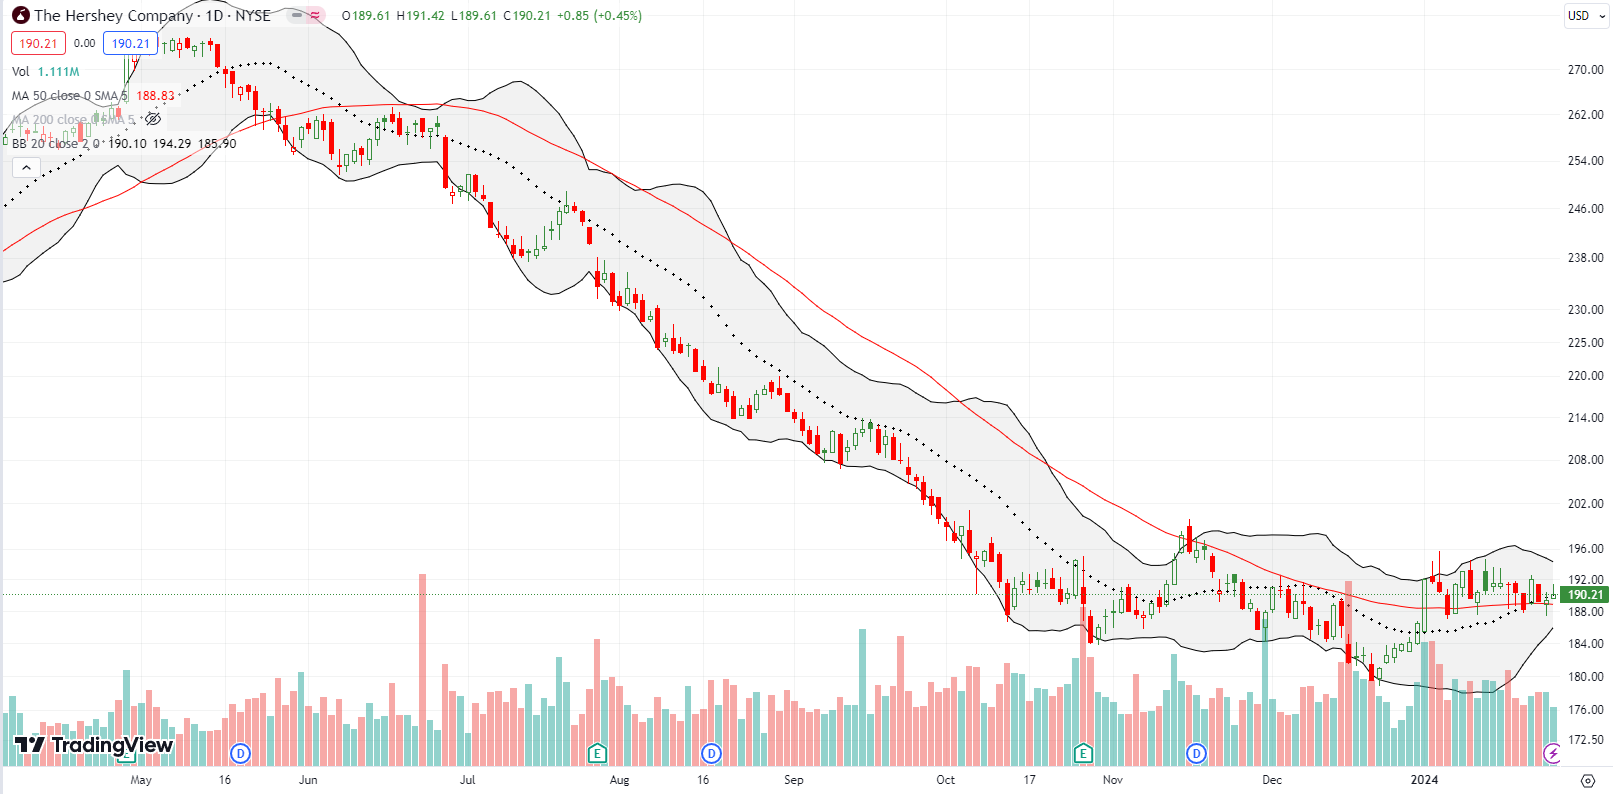
The Hershey Company (HSY) completely missed the stock market rally off the October lows. The chocolate company even managed to set a new 2-year low last month. HSY has churned and pivoted around its 50DMA since starting the year with a 3.0% pop. The 20DMA (the dashed line) joined the fun last week. I bought some long-terms shares assuming HSY is slowly carving out a bottom with the price consolidation and basing.
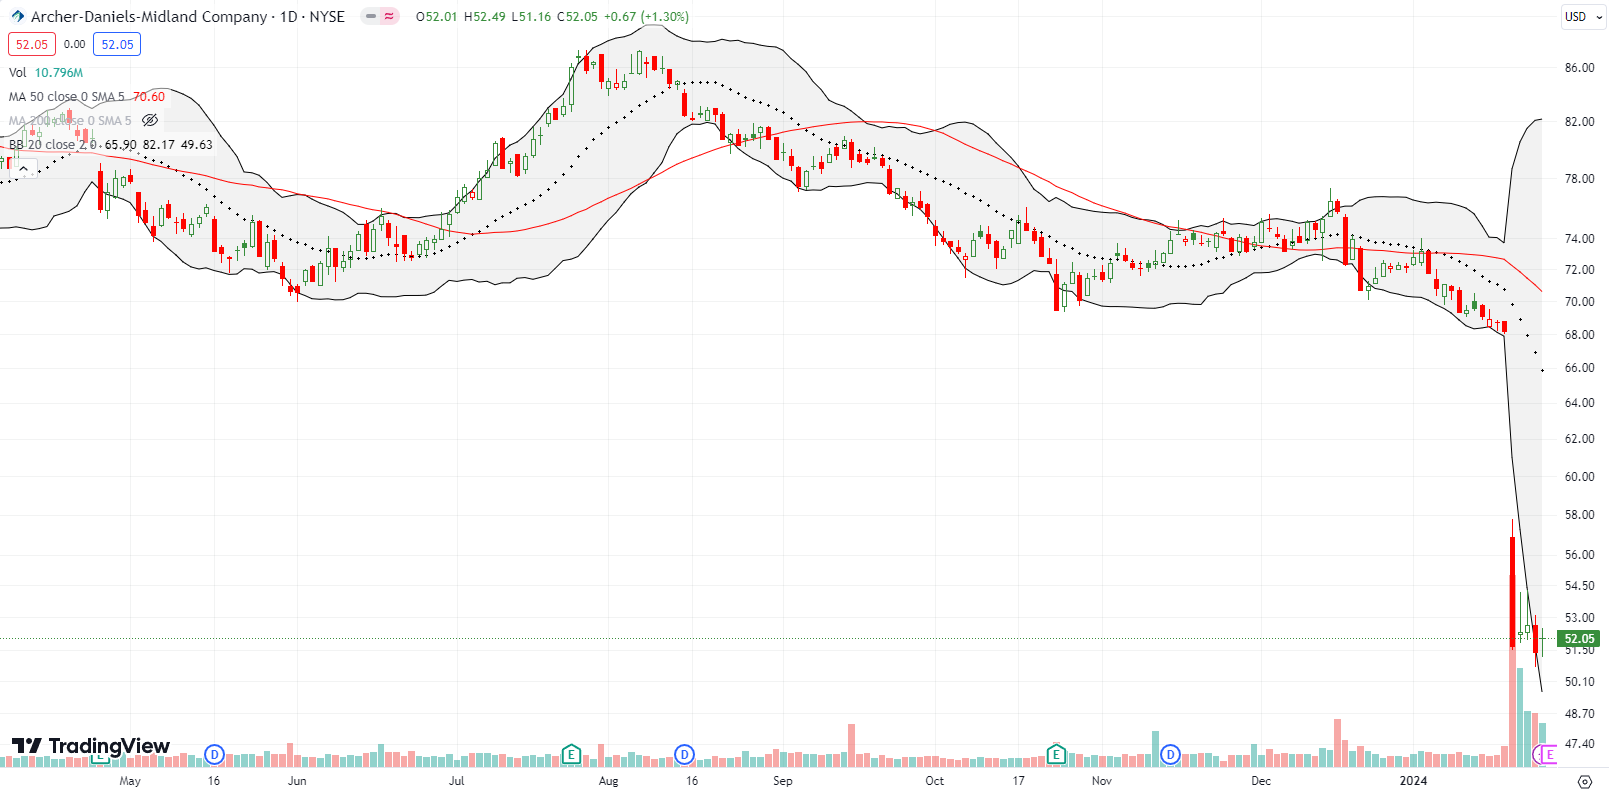
Archer-Daniels-Midland Co (ADM) got hit with an accounting scandal. The agricultural products company put its CFO on administrative leave “pending an ongoing investigation being conducted by outside counsel for ADM and the Board’s Audit Committee regarding certain accounting practices and procedures with respect to ADM’s Nutrition reporting segment, including as related to certain intersegment transactions.” The investigation was triggered by an SEC inquiry. The subsequent 24.2% loss took ADM to a near 3-year low. Perhaps spending the year diverging from the market underneath a downtrending 50DMA was an early warning sign. Having said that, this failure looks like an opportunity to start accumulating ADM on the cheap. I bought a small number of shares after buyers showed a little interest. Earnings this coming week will be a true test.
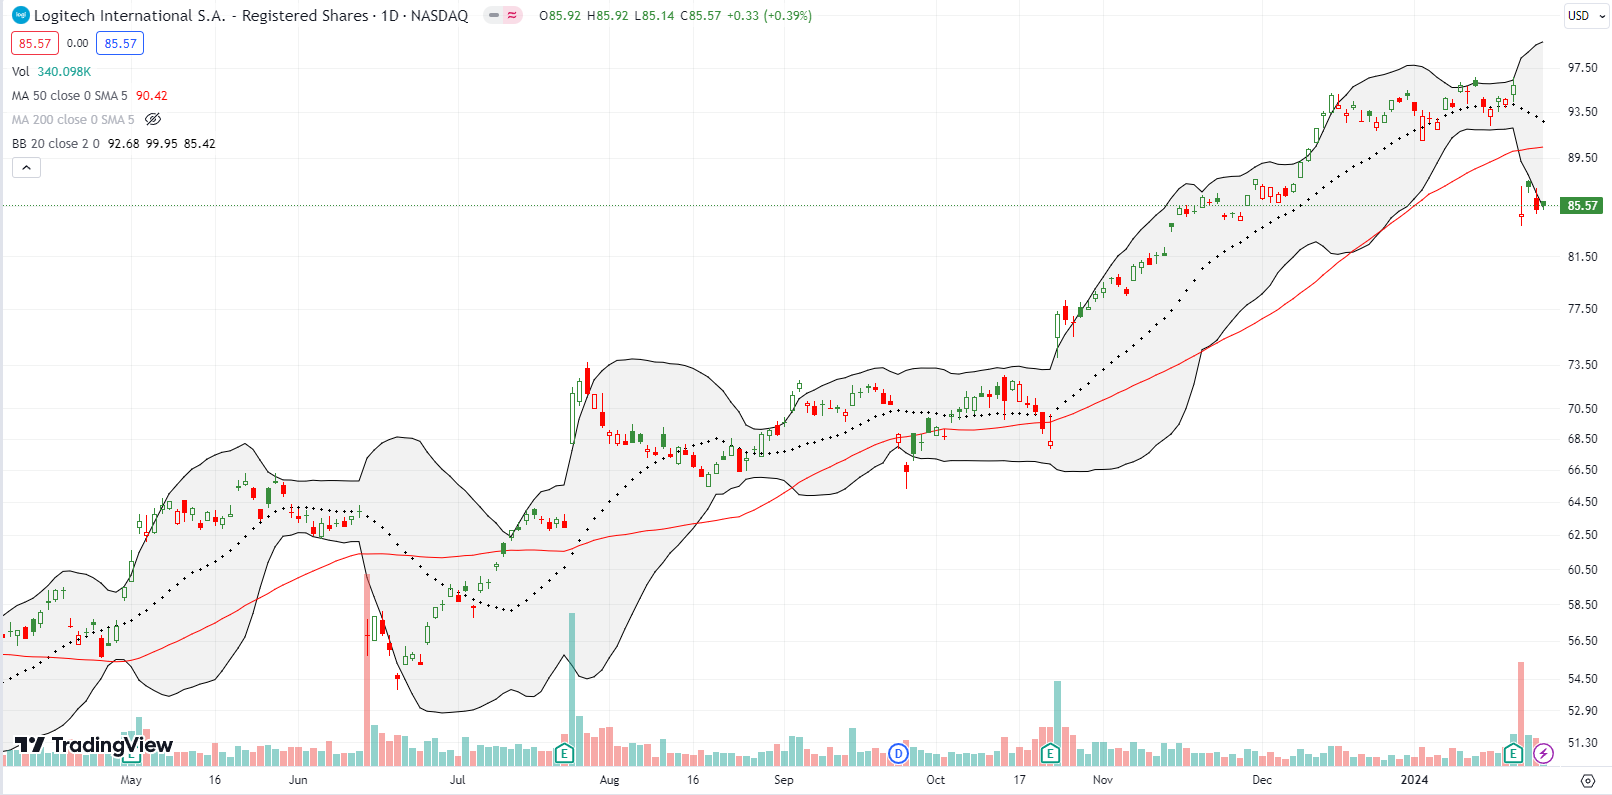
Logitech International S.A. (LOGI) had a good run trying to recover from an awful 2021 and 2022. The PC accessories company looked poised to break out when earnings took the stock in the opposite direction. LOGI lost 11.5% post-earnings and closed below its 50DMA for the first time since October. Interestingly, LOGI raised its 2024 full-year guidance. Thus this bearish move may not last long. I am content to wait.
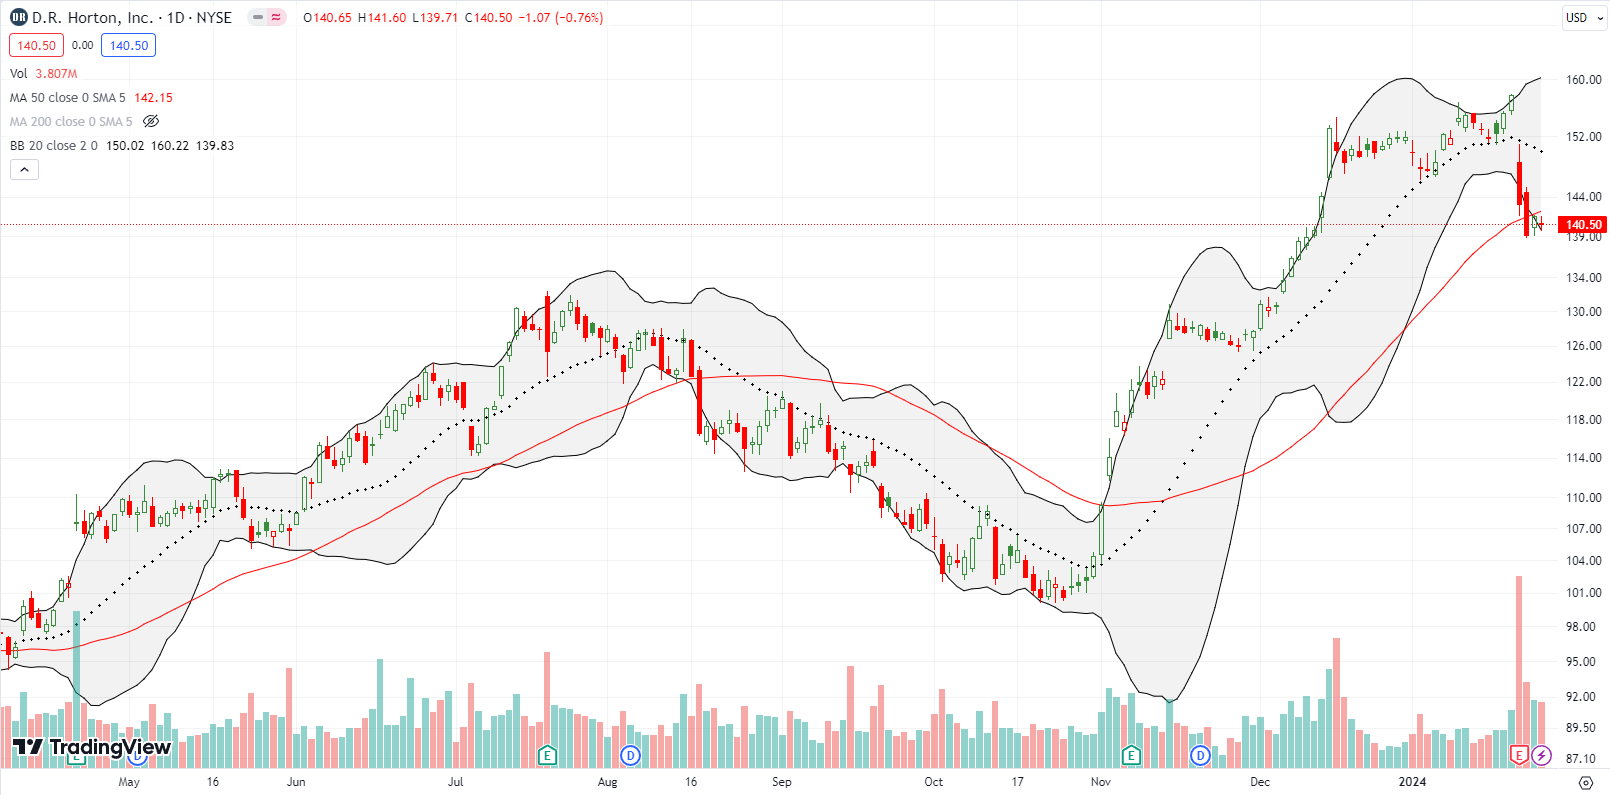
D.R. Horton (DHI) brought a dose of harsh reality to the tremendous run-up in home builder stocks. DHI lost 9.2% after reporting earnings. Sellers promptly took DHI below its 50DMA the next day. The company took a margin hit on its rate hedges when mortgage rates dropped in the last two months. DHI will also continue to incentivize sales using rate locks. If DHI was not trading well above 2.0 price/book, the resulting decline may not have been so dramatic. As it is, DHI looks like it printed a top in the home builder market for this cycle of seasonal strength. Thus DHI slipped from the bullish truths in the market to the edge of the market’s bearish truths.
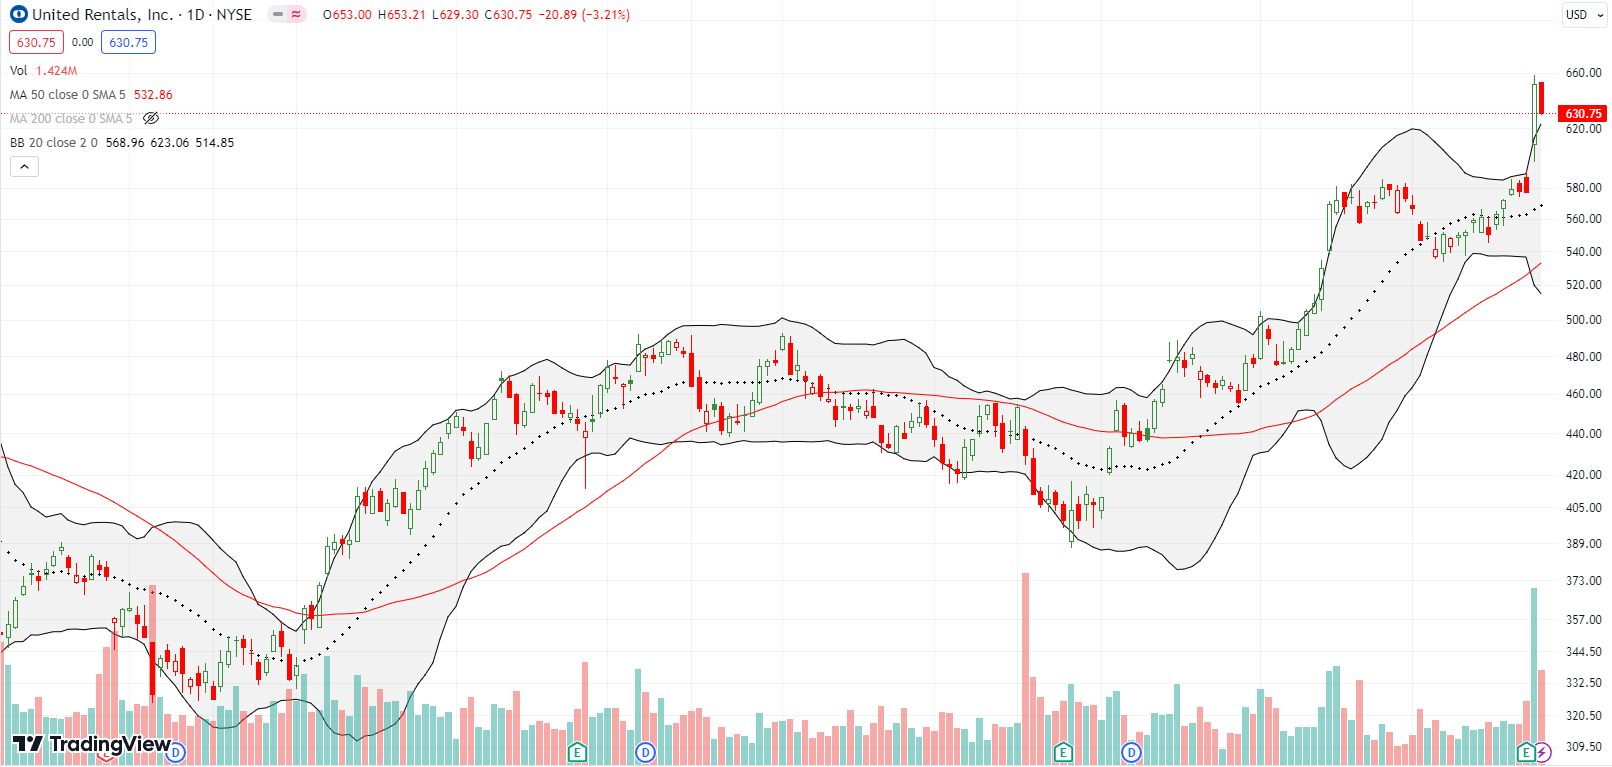
United Rentals, Inc (URI) is on the side of the bullish truths in the market. URI surged to an all-time high with a 13.0% surge. The move left the stock over-extended above its upper Bollinger Band (BB) and sellers happily stepped in to take advantage. Still, the breakout looks bullish and makes URI a buy-on-the-dip.
Be careful out there!
Footnotes
Subscribe for free to get email notifications of future posts!
“Above the 50” (AT50) uses the percentage of stocks trading above their respective 50-day moving averages (DMAs) to measure breadth in the stock market. Breadth defines the distribution of participation in a rally or sell-off. As a result, AT50 identifies extremes in market sentiment that are likely to reverse. Above the 50 is my alternative name for “MMFI” which is a symbol TradingView.com and other chart vendors use for this breadth indicator. Learn more about AT50 on my Market Breadth Resource Page. AT200, or MMTH, measures the percentage of stocks trading above their respective 200DMAs.
Active AT50 (MMFI) periods: Day #54 over 20%, Day #52 over 30%, Day #50 over 40%, Day #49 over 50%, Day #46 over 60%, Day #8 under 70% (underperiod)
Source for charts unless otherwise noted: TradingView.com
Full disclosure: long ADM, long IWM put spread and put, long HSY
FOLLOW Dr. Duru’s commentary on financial markets via StockTwits, Twitter, and even Instagram!
*Charting notes: Stock prices are not adjusted for dividends. Candlestick charts use hollow bodies: open candles indicate a close higher than the open, filled candles indicate an open higher than the close.


