Stock Market Commentary
A decisive end to the extended overbought period signaled the arrival of bearish conditions last week. Bears boldly sold for one more day before a “stock bulls taunt” forced suddenly hesitant bears into a partial retreat. A sharp market divergence is now taking hold. While the major indices rallied off support and broke out, on-going selling in certain sectors and stocks muted the rebound in market breadth. In other words, a number of stocks are getting left behind, and the stock market now holds two truths. If the history of market breadth is any guide, the taunt of the stock bulls is on borrowed time. Yet, breakouts should always get the benefit of the doubt from traders, so bears are rightfully hesitant given the perils of trying to predict an end to a strong run-up.
The two truths extend beyond the stocks market. Consumer sentiment hit a 2 1/2 year high, likely thanks to easing inflationary pressures. While often correlated with the stock market, strong sentiment is a boost for stocks as well. Running in parallel to the happy truths of American consumers is an increasingly gloomier picture of escalating geopolitical tensions and domestic political rancor. So far, the stock market has shrugged it all off largely thanks to happy feelings about monetary policy. However, at some unknowable point, the on-going expansion of what I call a “shadow” World War 3 will catch the attention of the bulls. Be ready so you don’t have to get ready.
The Stock Market Indices
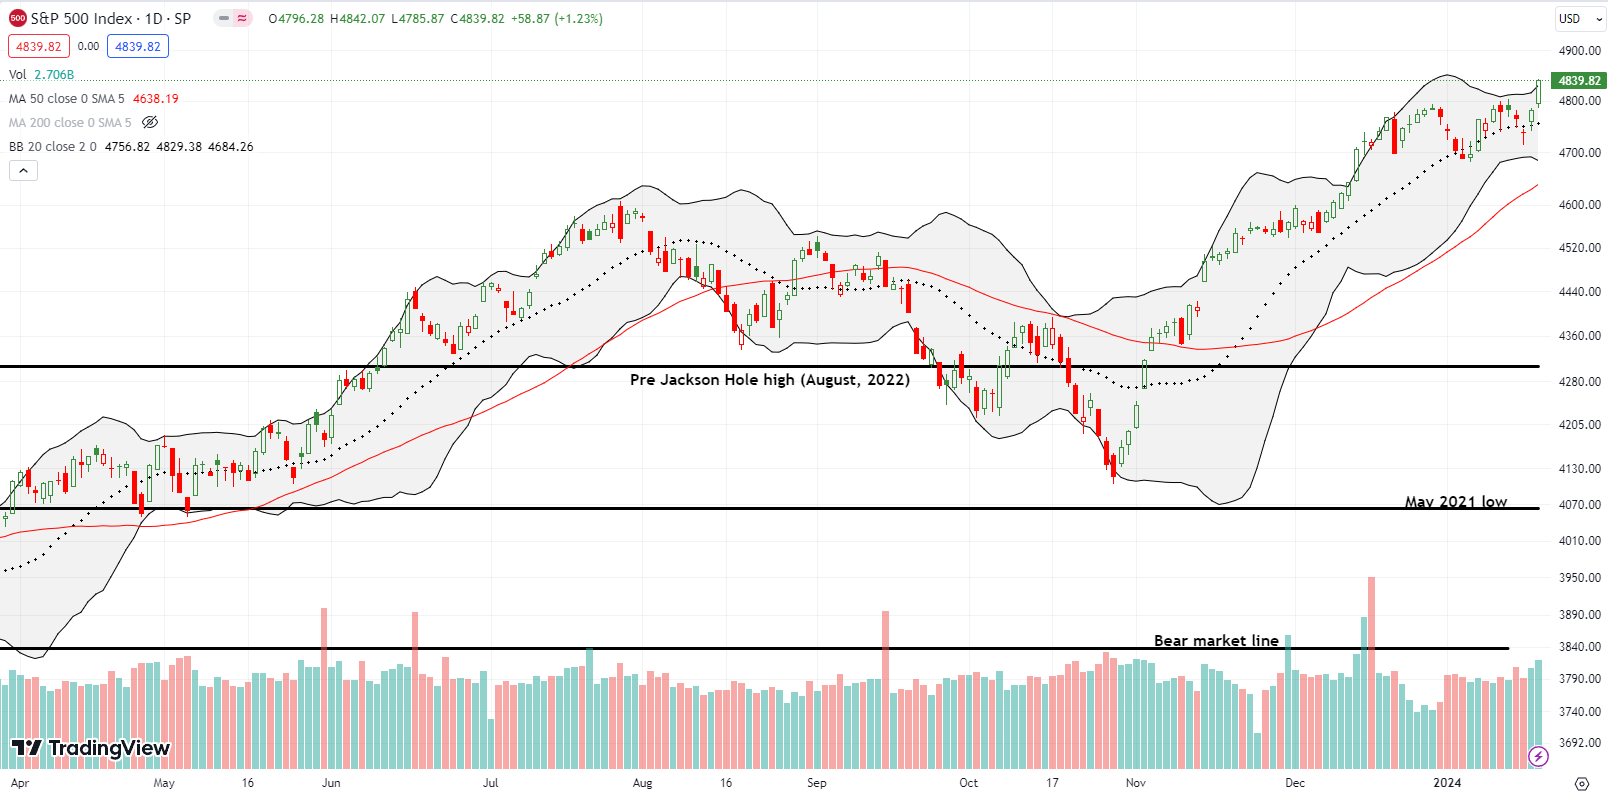
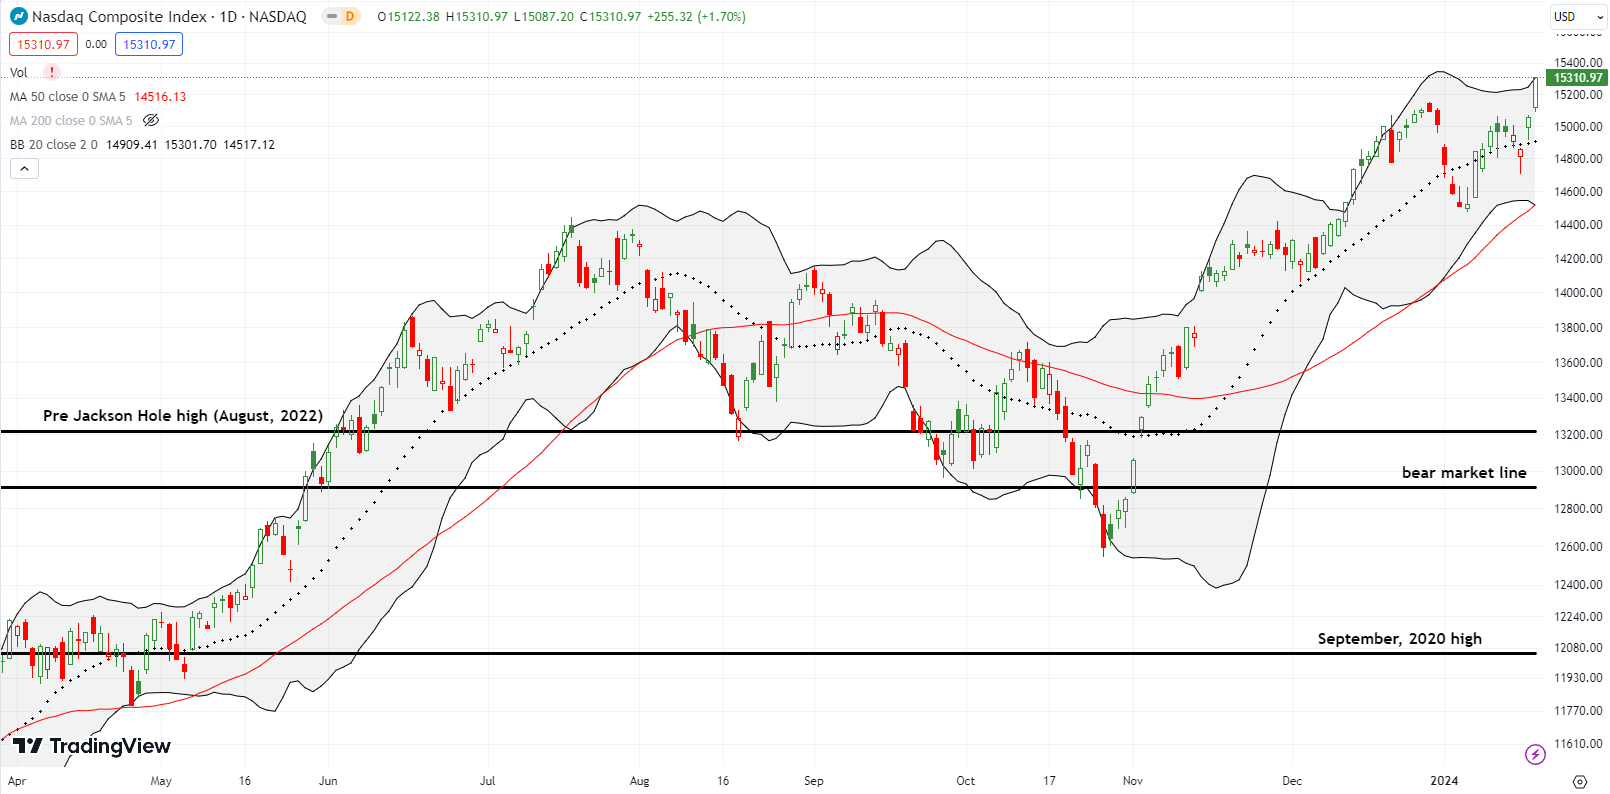
The S&P 500 (SPY) broke down below its uptrending 20-day moving average (DMA) (the dashed line below) for just one day after overbought conditions ended. A rally off intraday lows formed enough of a launching pad to send the index to a fresh 20DMA breakout one day and an all-time high the next. Importantly, while the S&P 500 is a bit stretched with a close above its upper Bollinger Band (BB), the all-time high invalidates the minor double top that formed thanks to the prior breakdown. Now, the next test of 50DMA support is on target to conveniently coincide with the 2023 low.
The NASDAQ (COMPQ) is out-performing the S&P 500 with a sharper rebound off the lows of the year. The tech laden index formed a clearer hammer pattern ahead of the two day rally that closed the week. The NASDAQ closed right at its upper-BB and reached a near 2-year high.
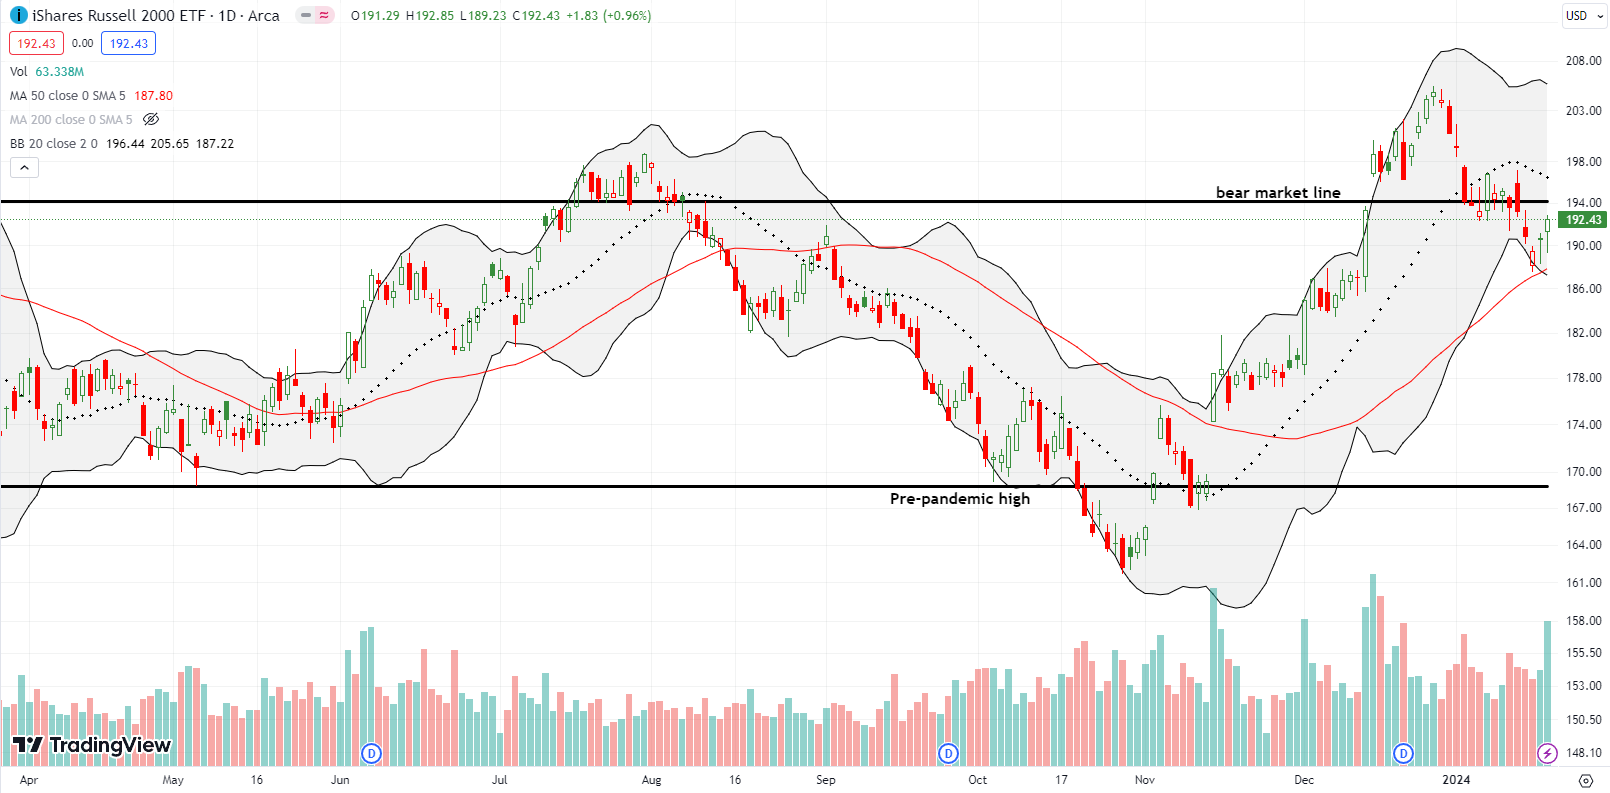
I anticipated a test of 50DMA support for the iShares Russell 2000 ETF (IWM). However, I did not expect it to happen so fast or for the ETF of small caps to recover so quickly from the test. In the middle, my calendar put spread sold at my initial profit target (another demonstration of why I love calendar spreads for these situations). I am now anticipating IWM to fail at resistance from its bear market line; also note the now declining 20DMA. Accordingly, I bought a put spread expiring two weeks. I am betting on a 50DMA breakdown on the next trip downward.
The Short-Term Trading Call When Stock Bulls Taunt
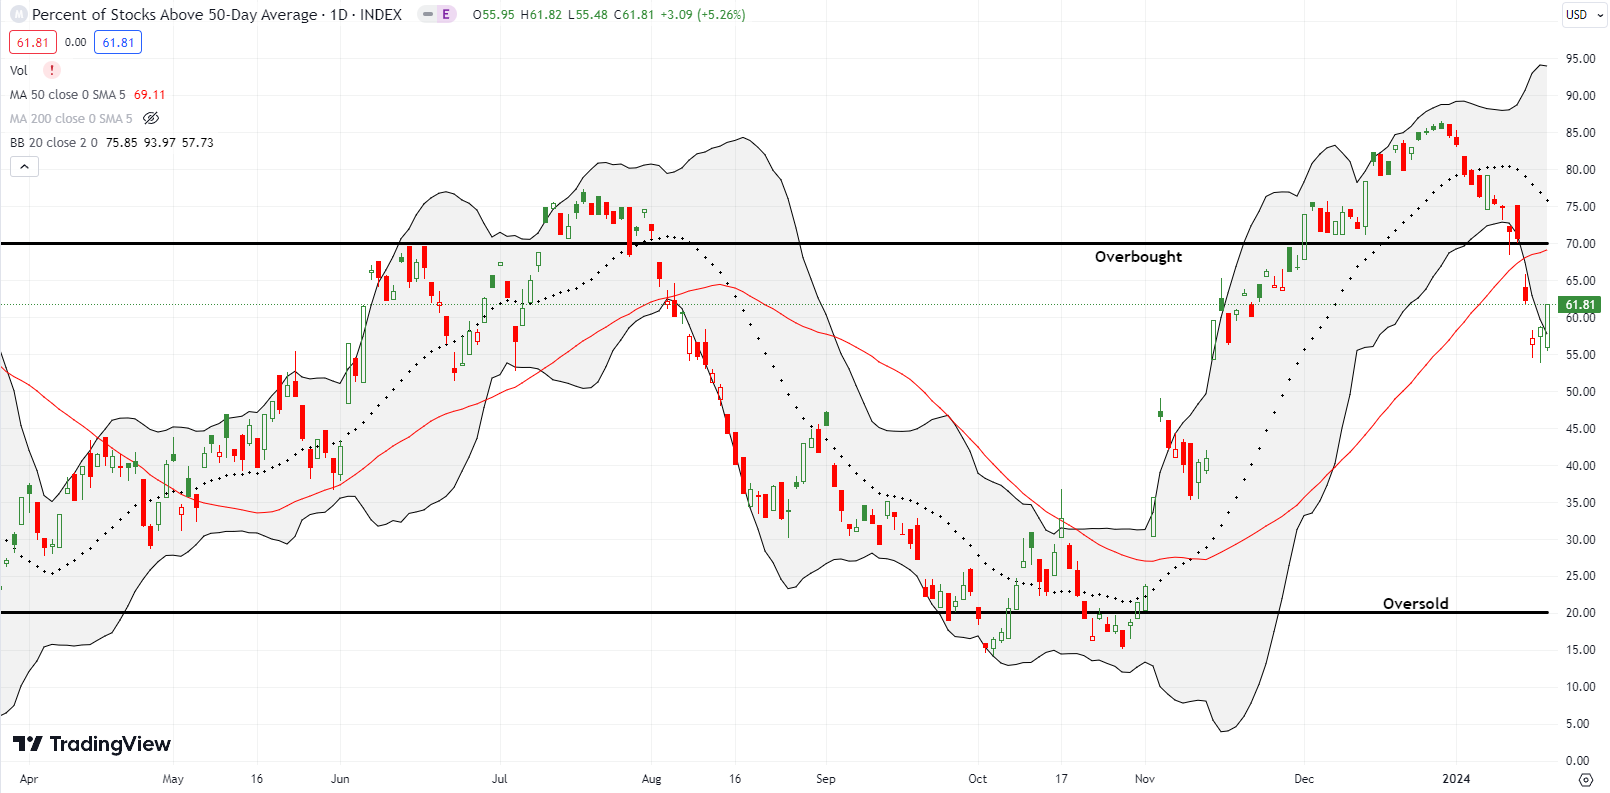
- AT50 (MMFI) = 61.8% of stocks are trading above their respective 50-day moving averages
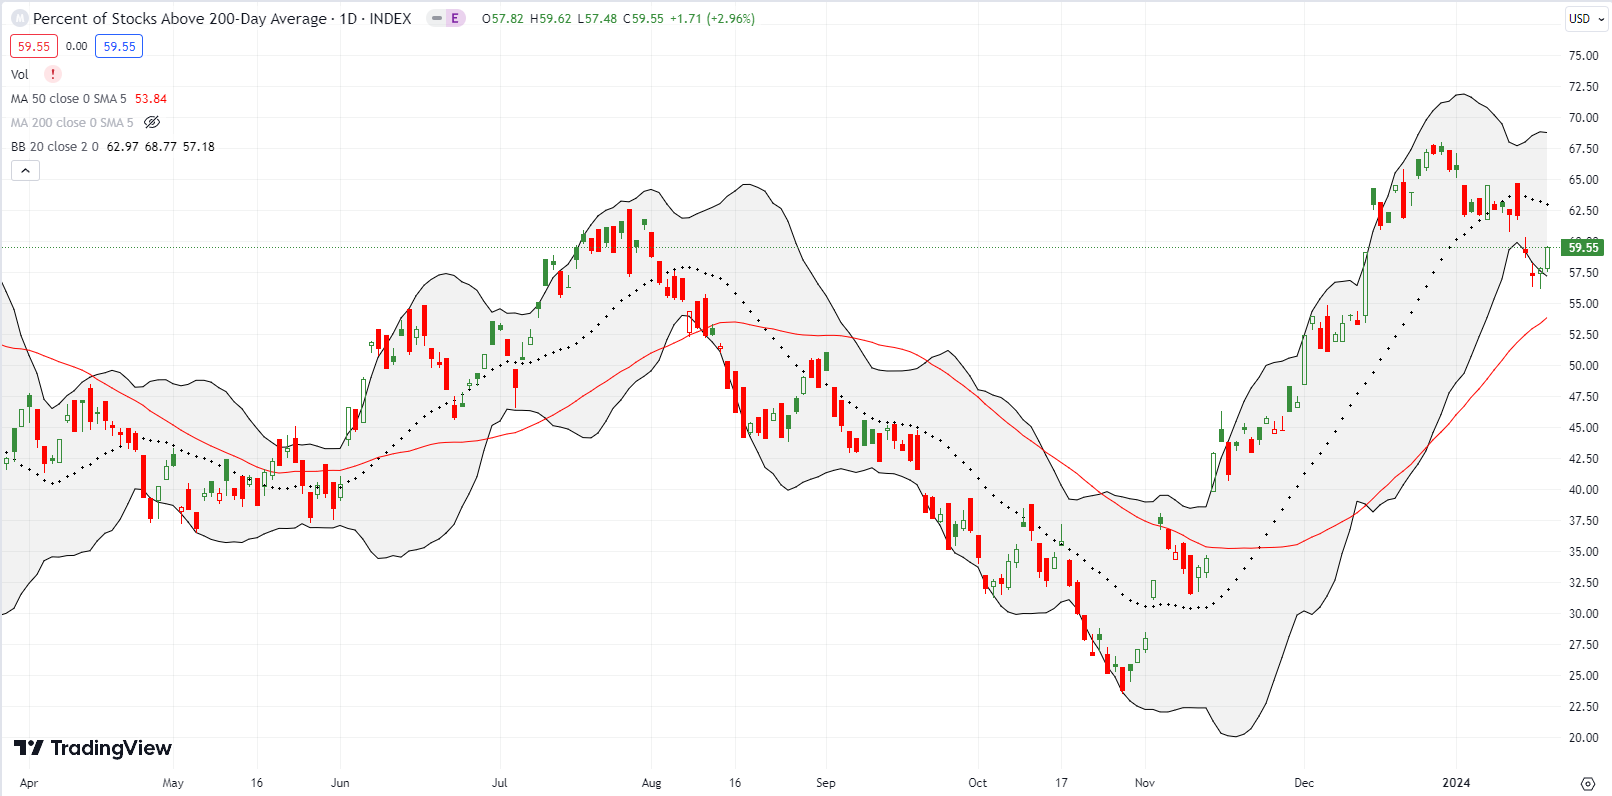
- AT200 (MMTH) = 59.6% of stocks are trading above their respective 200-day moving averages
- Short-term Trading Call: cautiously bearish
AT50 (MMFI), the percentage of stocks trading above their respective 50DMAs, closed Friday at 61.8% after a volatile week. My favorite technical indicator started the week with a strong breakdown below the overbought threshold. The next day’s follow-up plunge looked like a confirmation of control for the bears. Instead, the stock bulls taunt froze the now tentative bears at the edge of the water. The bears do not and cannot dive in here.
I left the short-term trading call at cautiously bearish because AT50 remains below the overbought threshold (at 70%) after the recent breakdown. I will flip to neutral if market breadth returns to overbought. In the meantime, I have to respect the bullish strength in the S&P 500 and the NASDAQ and be even more selective than usual in picking candidates for bearish trades. These candidates would be stocks suffering 50DMA breakdowns and/or confirming overhead resistance. The charts below show the fascinating divergence in fortunes facing traders where two market truths live in parallel.
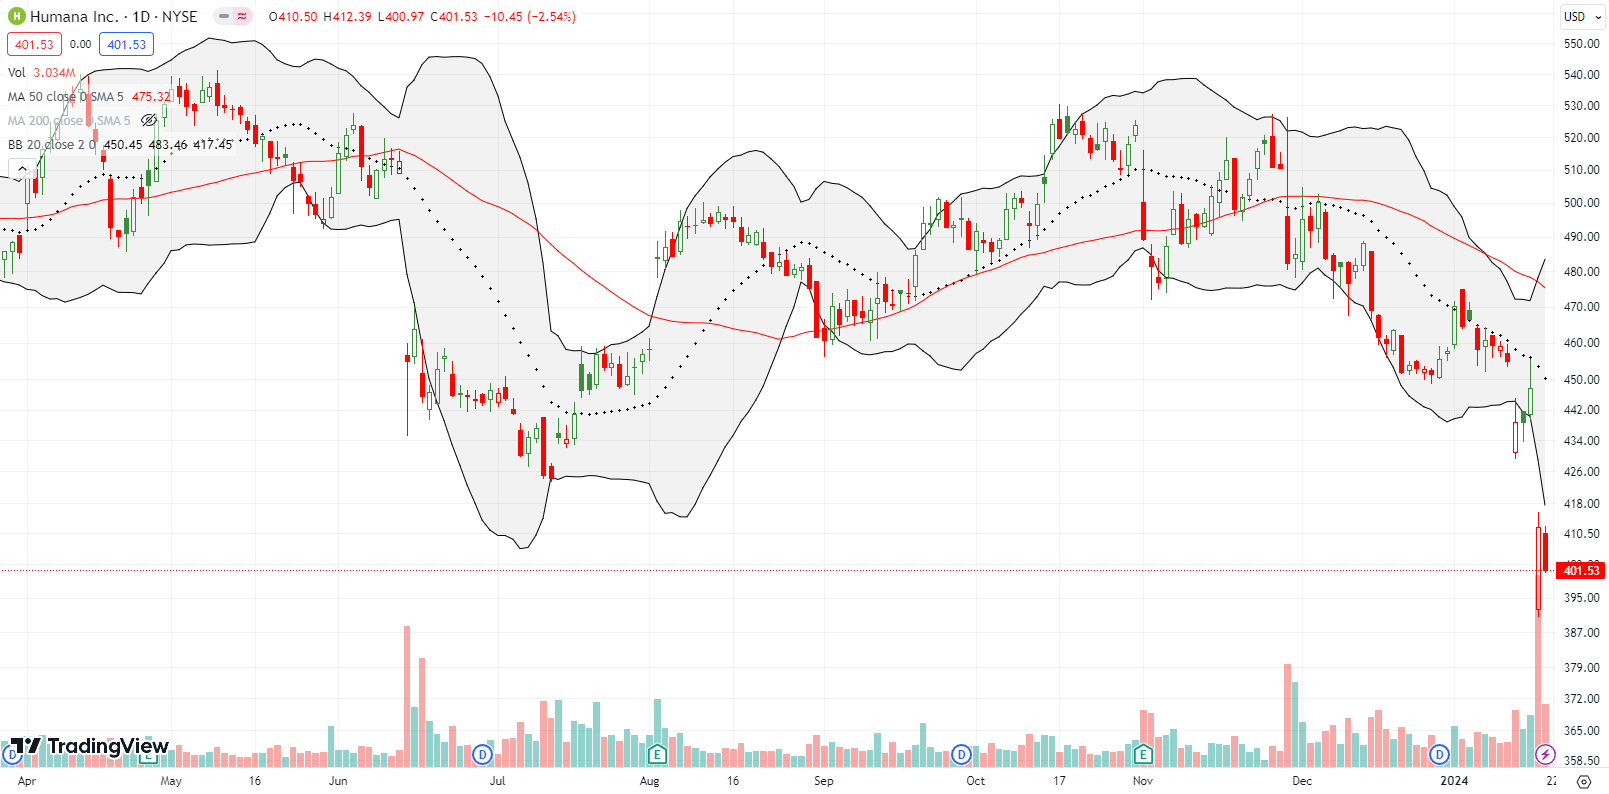
So much for thinking healthcare would be the place to be in 2024. Insurer Humana Inc (HUM) released poor guidance and promptly fell 8% in response. Buyers attempted a spirited rebound but sellers returned the very next day. HUM now trades at a 2-year low and carries a flag for the bearish truths in the market.
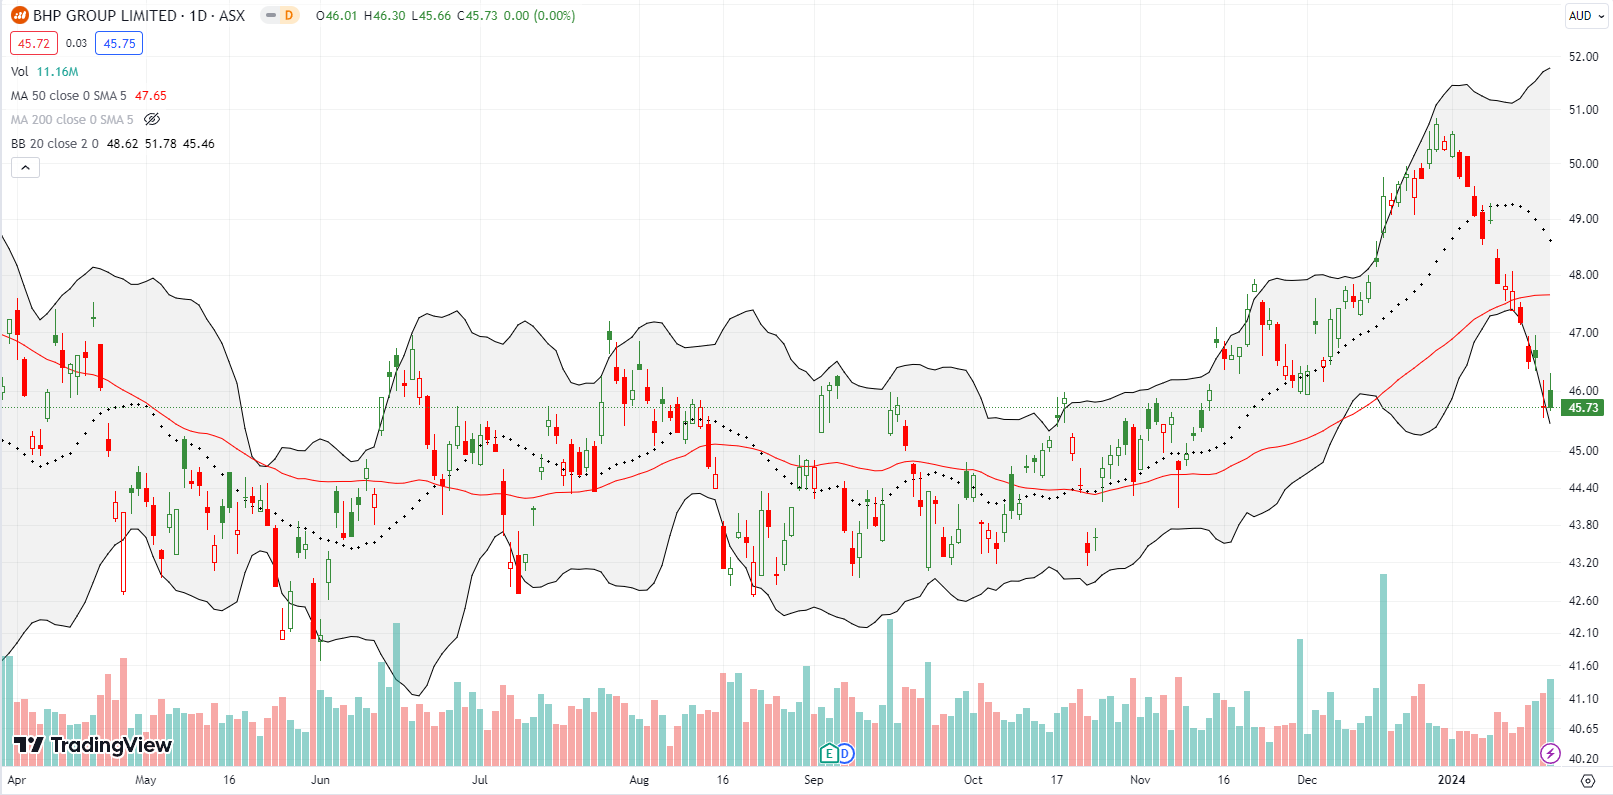
Commodities are also carrying a flag for the bearish truths in the stock market. Diversified commodities and premiere iron ore company BHP Group Limited (BHP) has yet to stem the losses all year. After a promising breakout in December to an all-time high, BHP now finds itself right back in the middle of the prior trading range. I am very tempted to just buy BHP, but I almost never buy anything under the 50DMA unless the market is oversold, and/or I am driven by some clear and defined catalyst that I find worth the risk.
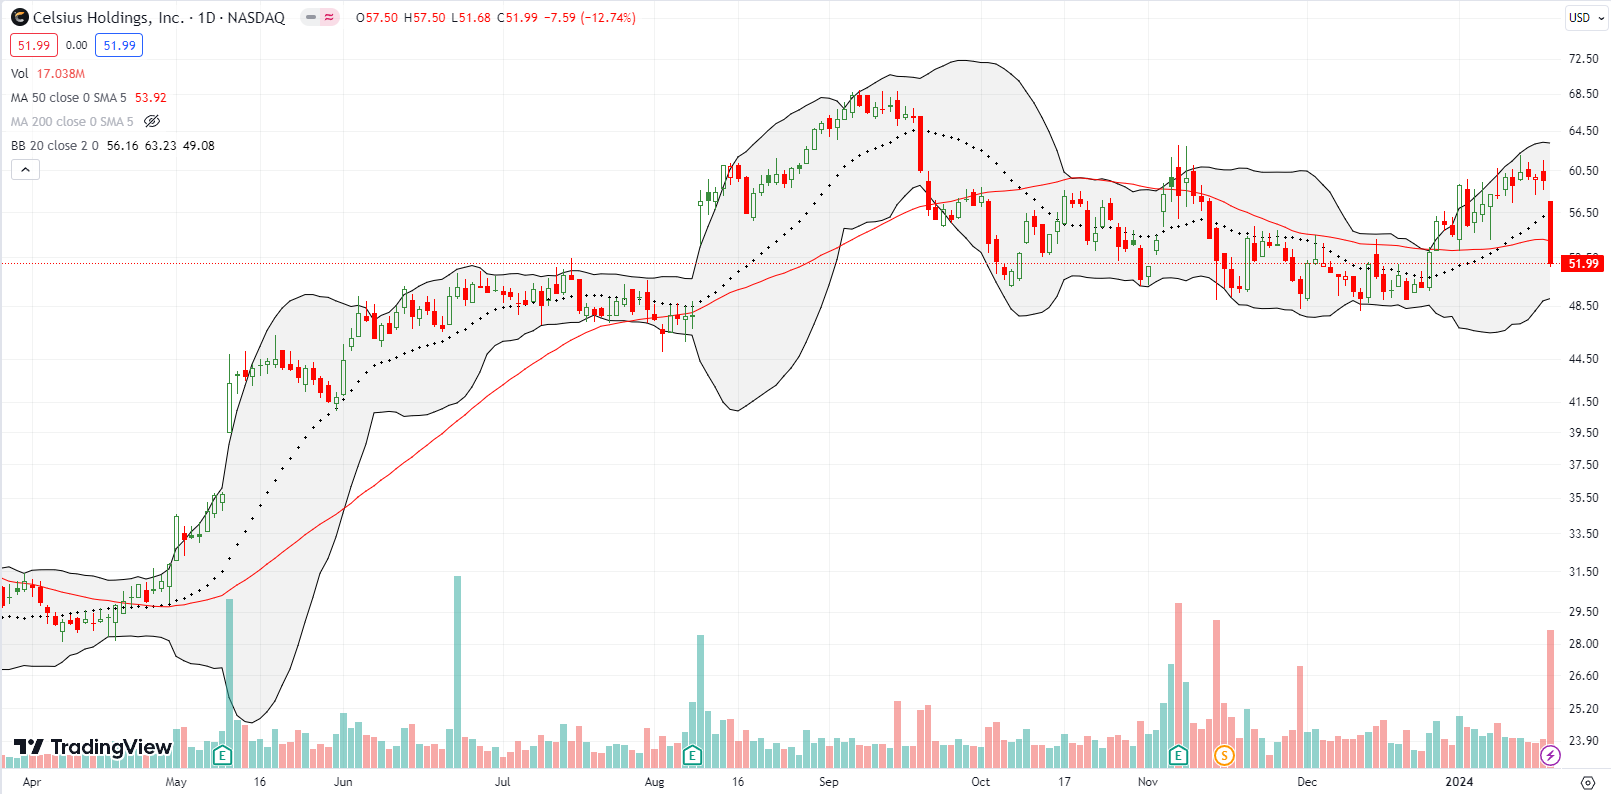
So far this year (anecdotally), analysts have wielded strong headline power over stocks with upgrades and downgrades. Beverage company Celsius Holdings, Inc (CELH) was struggling to overcome resistance from the November highs when an analyst downgrade knocked it off the ledge and under its 50DMA. CELH lost 12.7% on the day.
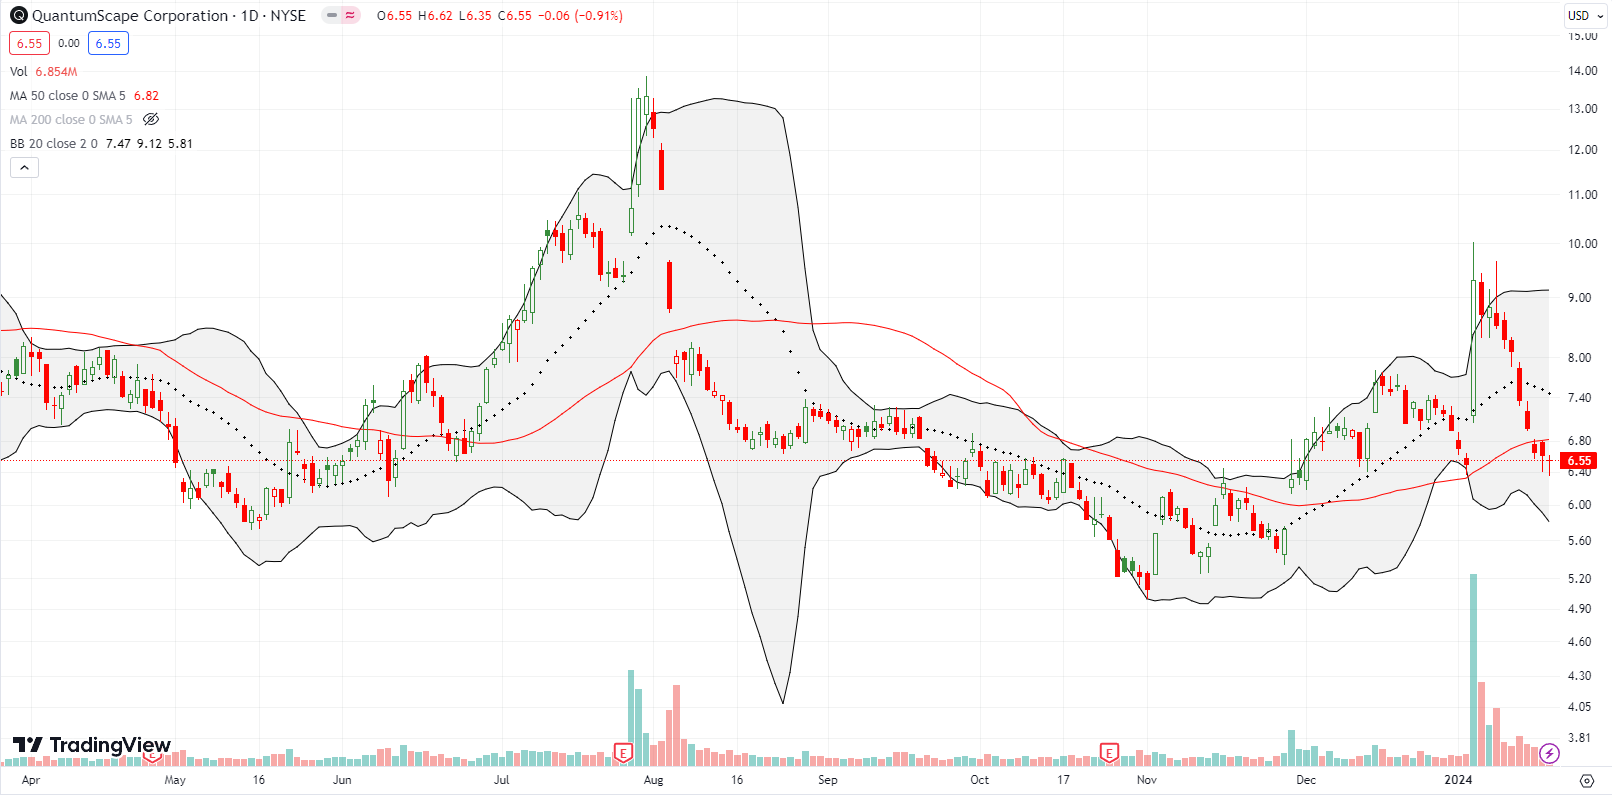
On January 3rd, news arrived that Quantumscape Corporation (QS) had passed its first endurance test for its solid-state cell. QS promptly surged 43% in the wake of the news. I felt some regret for having given up on QS a while ago (I took the loss), especially since this news seemed fundamental and game-changing. Thus, I put QS on the radar to buy on a dip.
Boy did a dip ever come. QS ended up reversing the entire surge with sellers dumping stock all but one day since the news. So much for my understanding of the fundamentals here! I bought some shares at the 20DMA and had planned to add at the 50DMA. However, QS gapped below its 50DMA before I could add more shares. Now I wait for the stock to “prove” itself with a confirmed 50DMA breakout.
Put QS in the bucket of bearish truths about the current market.
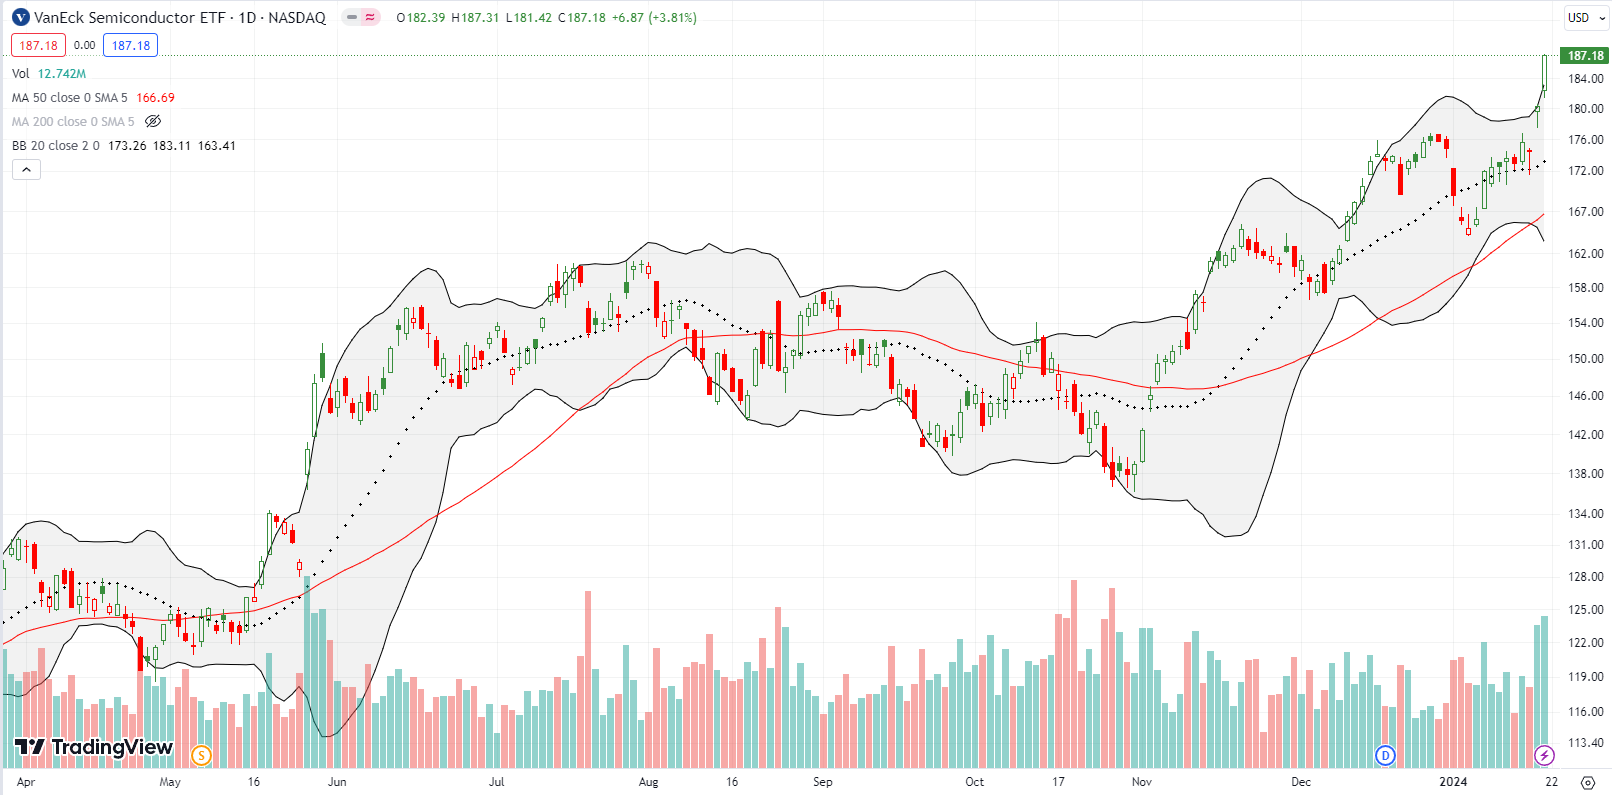
The VanEck Semiconductor ETF (SMH) solidified its position in the bullish truths in the stock market. A convergence of good news lifted the sector last week. Taiwan Semiconductor Company (TSMC) received a bullish response to earnings and enjoyed a flurry of upgrades for Advanced Micro Devices (AMD) and Nvidia (NVDA). I probably missed a host of other positive news in the sector. While SMH is over-stretched above its upper Bollinger Band, the bulls are making a clear statement in SMH!
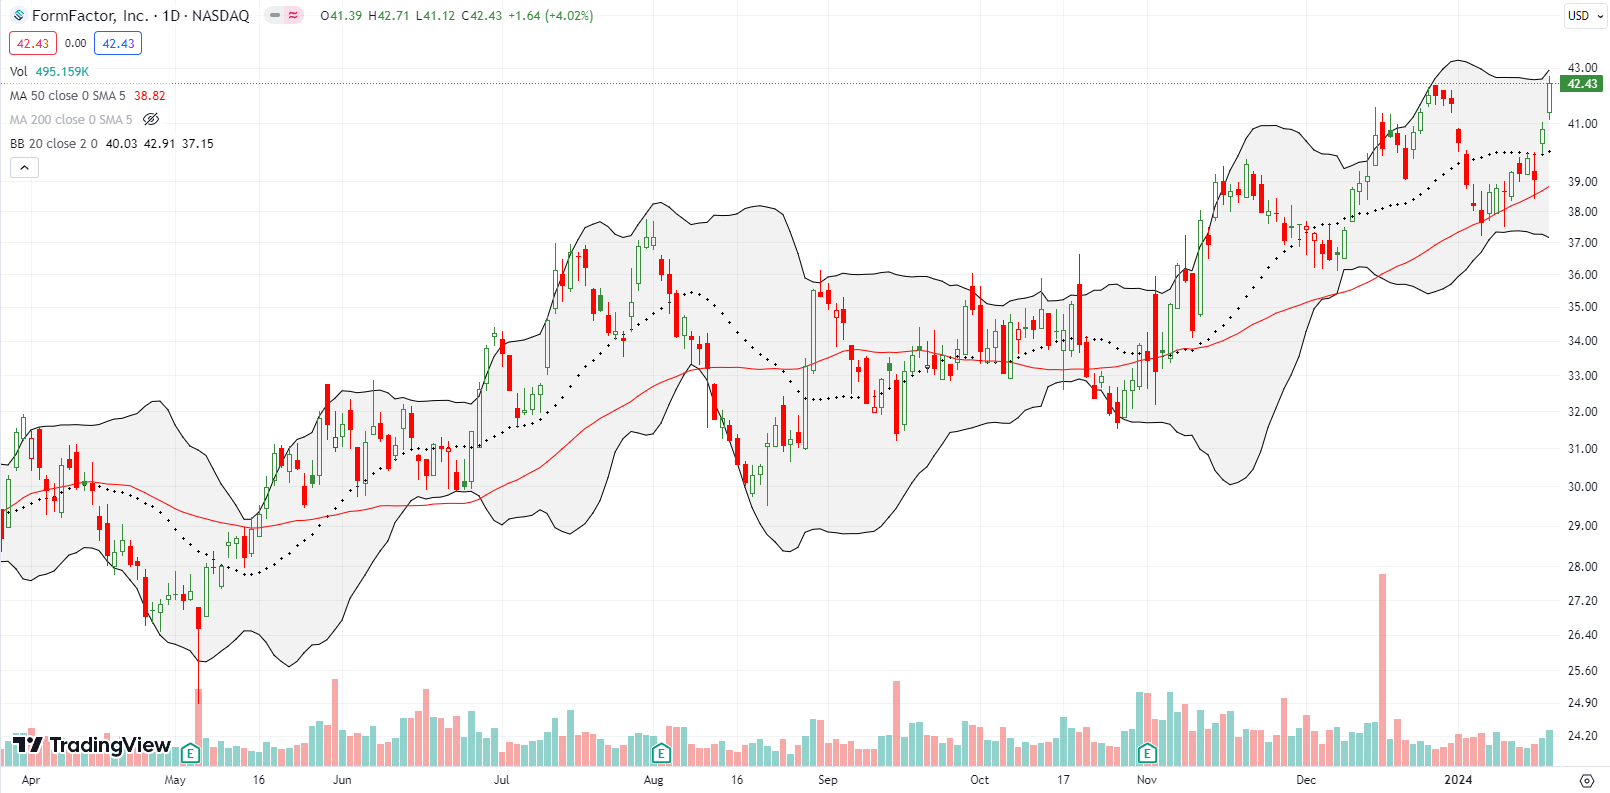
During the overbought period, I continued to look for bullish setups to buy. FormFactor, Inc (FORM) created a classic test of 50DMA support. FORM took a few days but survived the test beautifully. On Friday it surged along with the rest of the semiconductor industry and notched a (marginal) new two-year high.
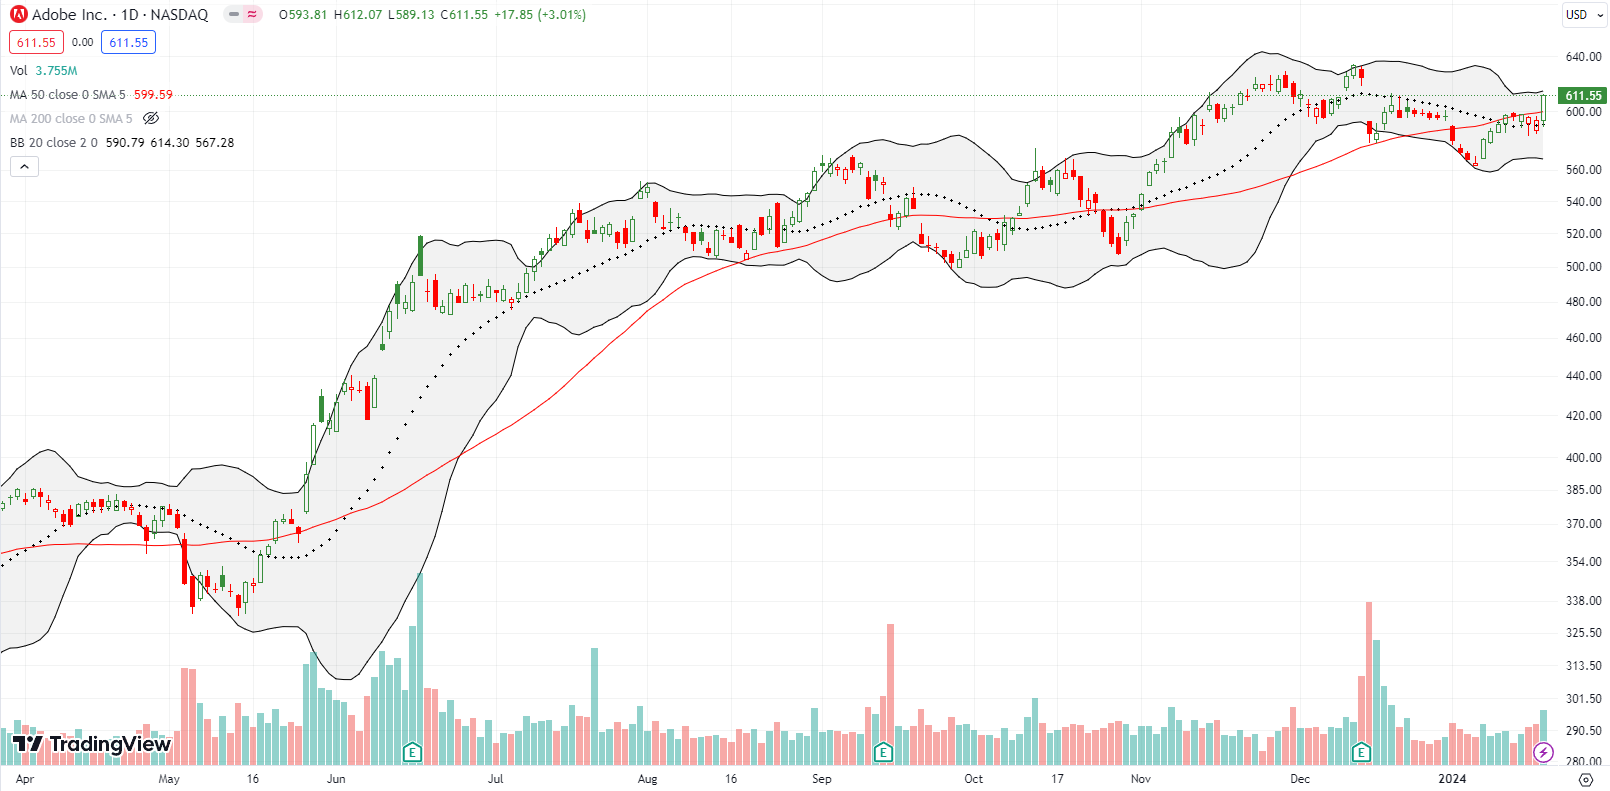
My chase for the bearish setup in Adobe Inc (ADBE) came to a decisive end on Friday. ADBE jumped 3.0% and broke out above its 50DMA. The stock now looks bullish and ready to fill its post-earnings gap down from last month. On Tuesday, my last put spread showed a small profit at the lows. I let that image stick with me too long and failed to even salvage residual value from the position. Another lesson learned! Count ADBE in the bucket of bullish truths in the stock market.
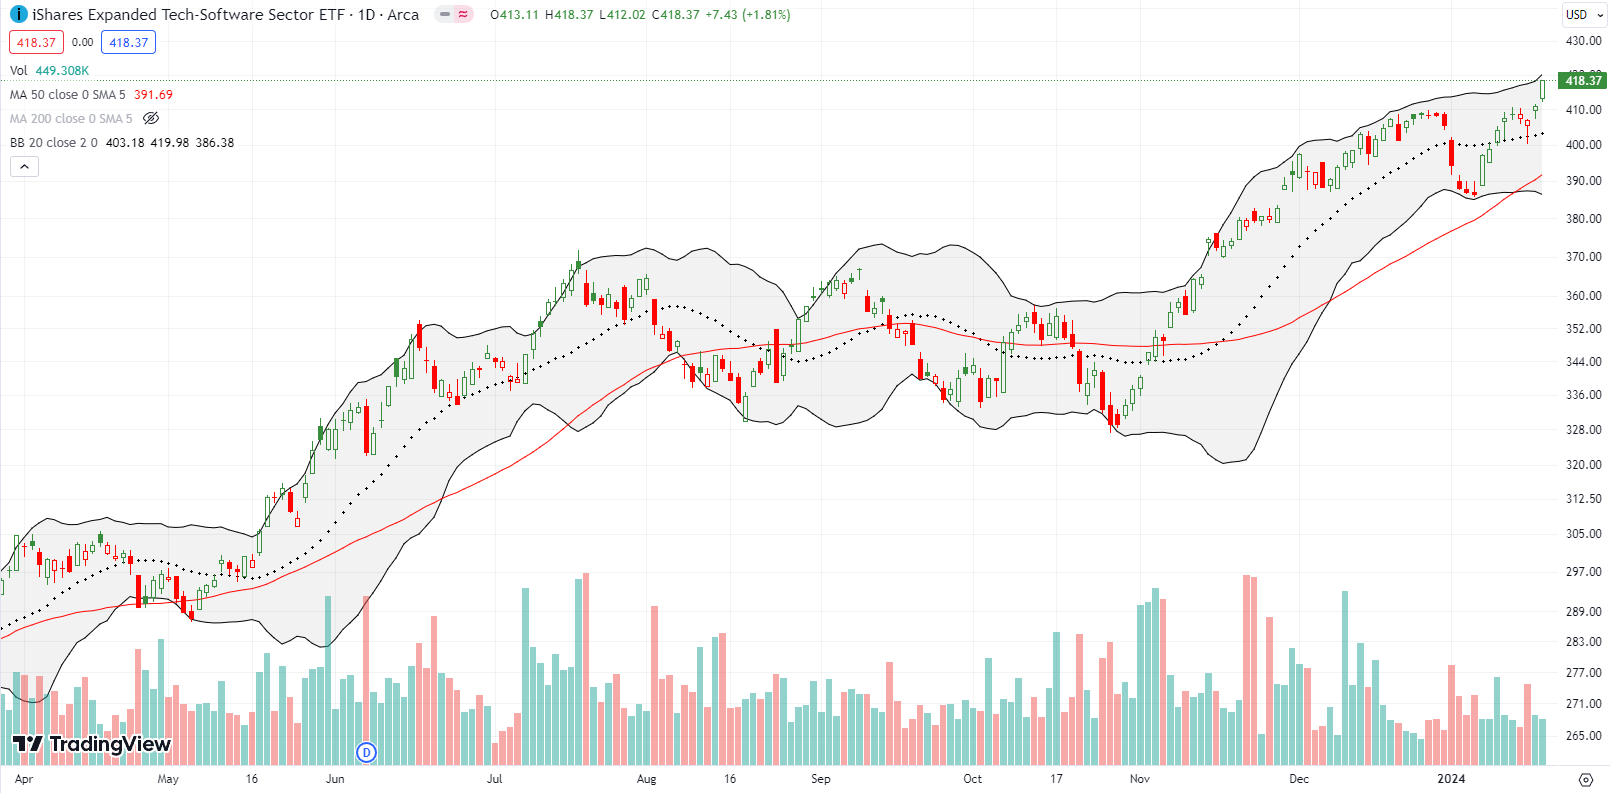
ADBE is a top three component of the iShares Expanded Tech-Software Sector ETF (IGV). IGV as a whole took its cues from the bullish truths. During the sell-off that started the year, IGV avoided testing its 50DMA. So it looked prime for an overdue test. Instead, IGV ended last week at a near 2-year high. Add a whole host of software companies to the stock bulls taunt.
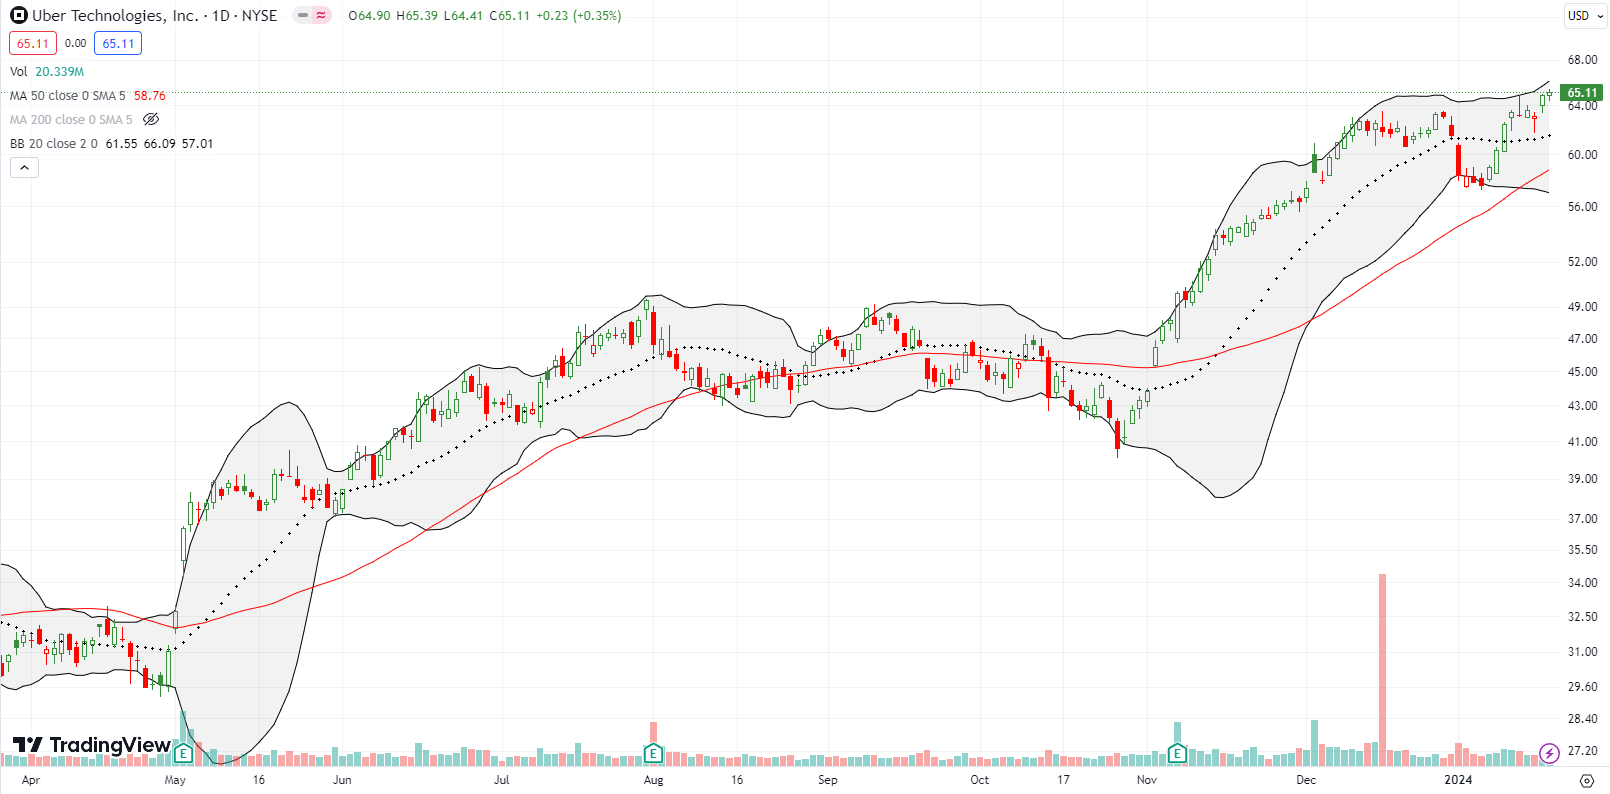
At the beginning of the year, I identified Uber Technologies, Inc (UBER) as a stock to bet on a top. As soon as I saw UBER make a potential blow-off top, I chased the setup with put options. For a hot minute on Wednesday, I thought I was on the path of validation. Instead, buyers promptly defended 20DMA support and closed the week with UBER at an all-time high. Needless to say I will soon take a loss on the UBER puts and lick my wounds. While I cannot fathom it, UBER is solidly on the bullish side of the river. The stock has been on quite a journey since its 2019 IPO!
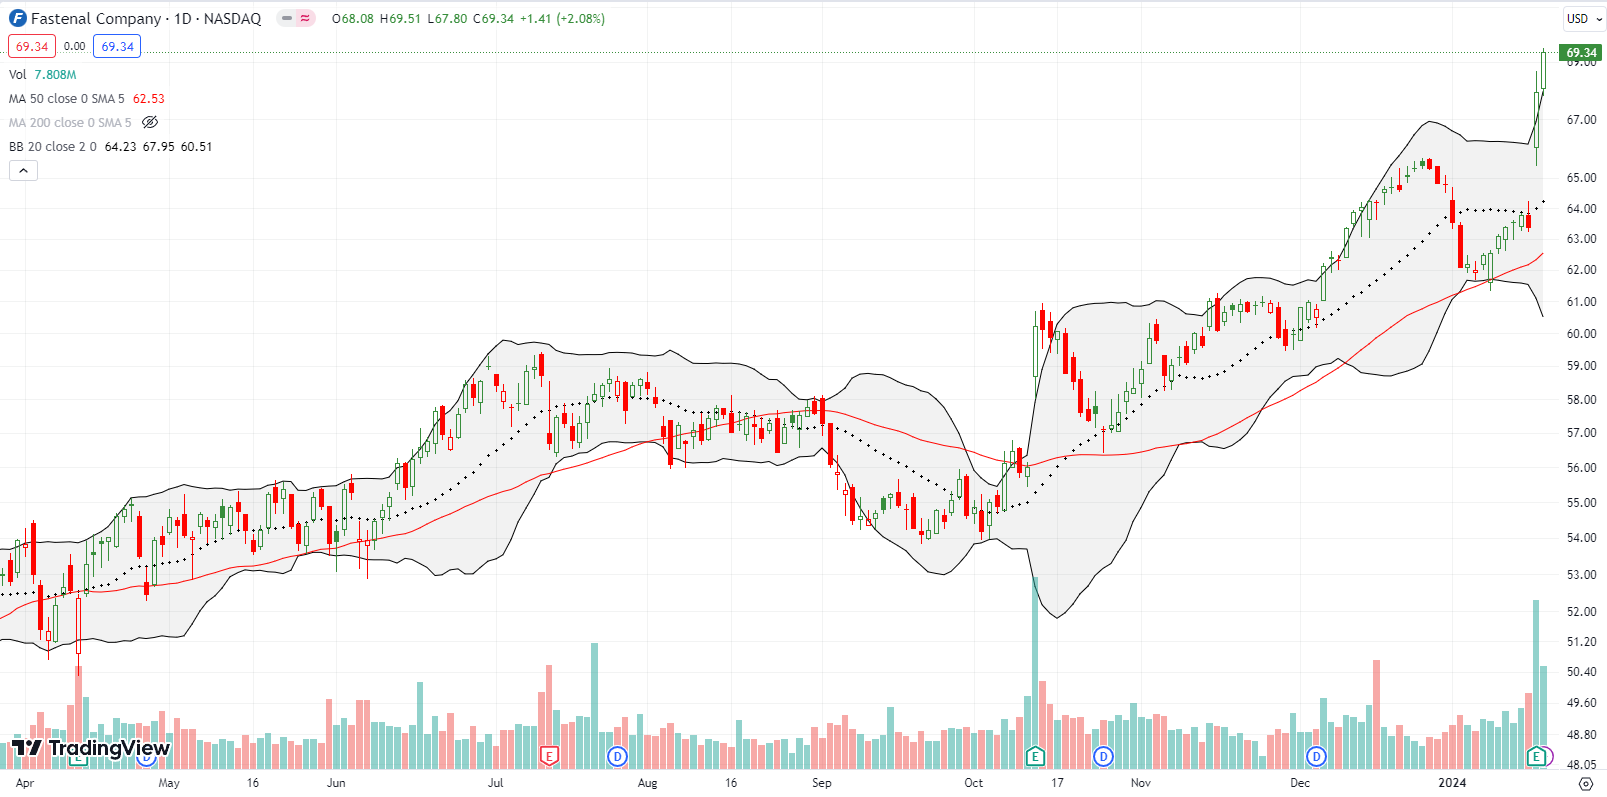
Industrial parts firm Fastenal Company (FAST) used a post-earnings 7.2% surge to achieve an all-time high. I passed on the perfect test of 50DMA support because of the proximity of earnings. Ooops! Note how well the 50DMA supported FAST after it nearly reversed all its October post-earnings gains (the “E” at the bottom of the chart marks earnings dates). FAST is a standout long-term buy-on-the-dip opportunity.
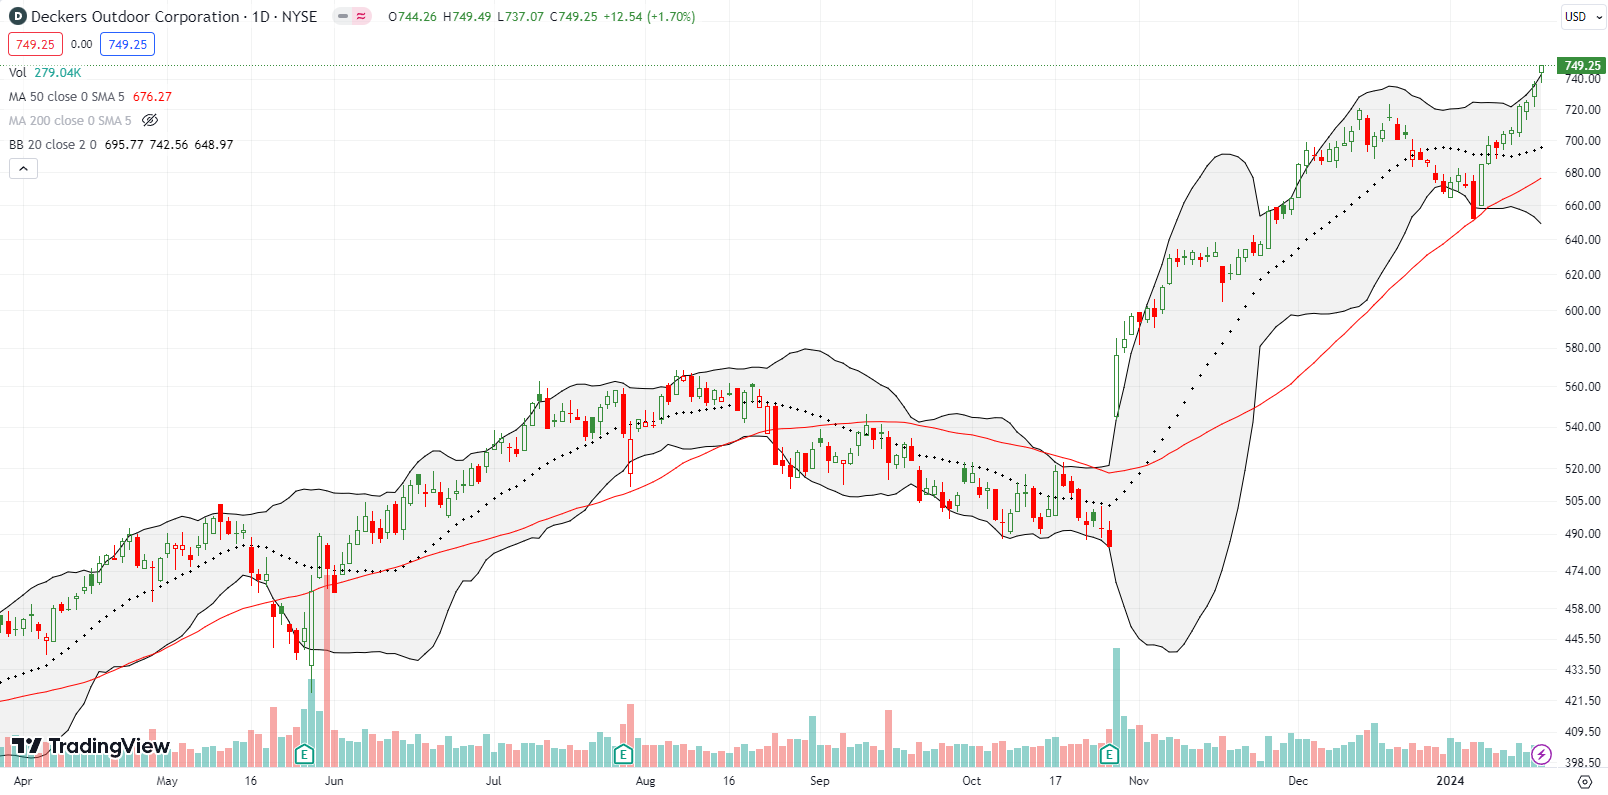
Technology and certain industrials are not the only stocks taunting the hesitant bears. Recreational retailer Deckers Outdoor Corporation (DECK) perfectly tested its 50DMA support at the beginning of the year and has not looked back since. DECK closed the week at an all-time high.
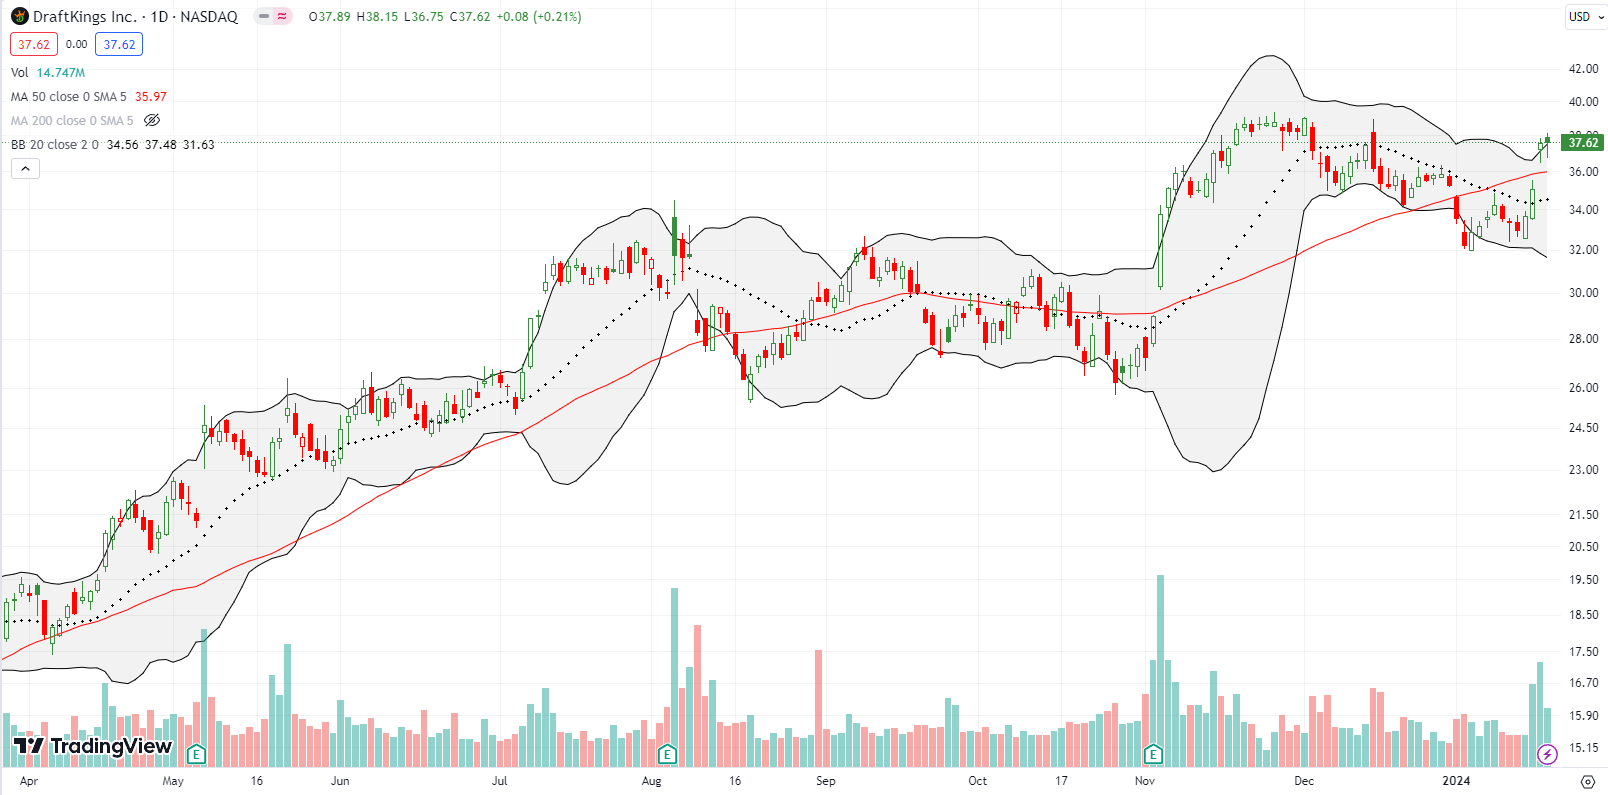
Sports betting company DraftKings, Inc (DKNG) was on my buy list in December. DKNG was surprisingly left out of December’s run-up in the general stock market, so I was wary enough to wait for a test of 50DMA support. DKNG started the year gapping below support, and I took it off the shopping list. DKNG churned and churned until last week’s 50DMA breakout. DKNG benefited from good news in the sector and an analyst upgrade. Perhaps DKNG would be even higher if not for a concurrent analyst downgrade. DKNG is back on my buy list despite my short-term bearish trading call on the stock market.
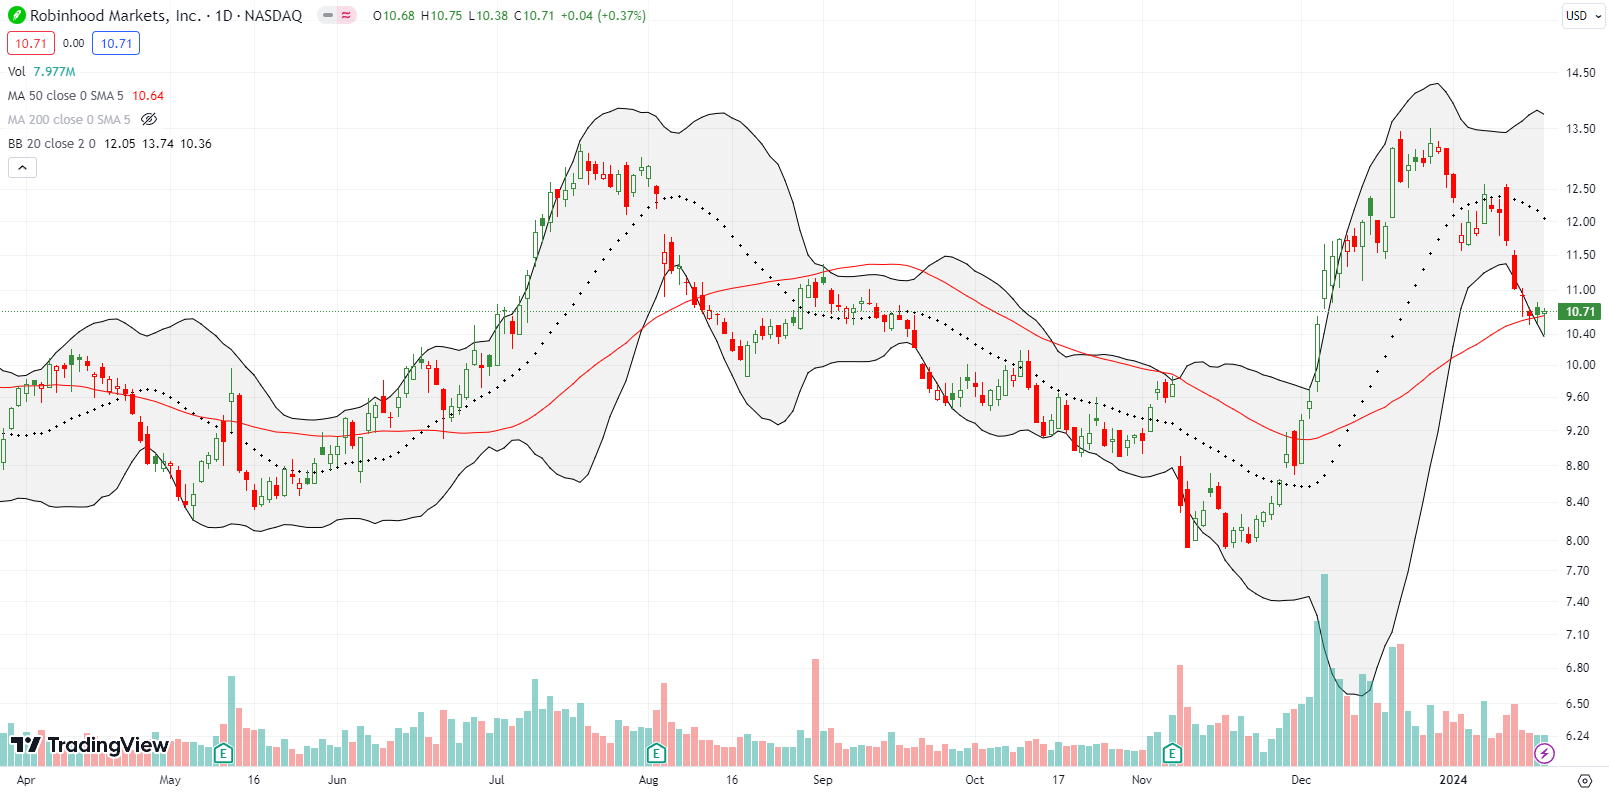
Robinhood Markets, Inc (HOOD) intrigues me as it clings to 50DMA support. If I were bullish on the market, I would just buy it here. Instead, I am waiting for a higher close. Even then, I assume the upside is limited to a new downtrending 20DMA. If support gives way, HOOD would be setup to reverse its entire 50DMA breakout and likely more. And of course, I will look for put options in the bearish scenario.
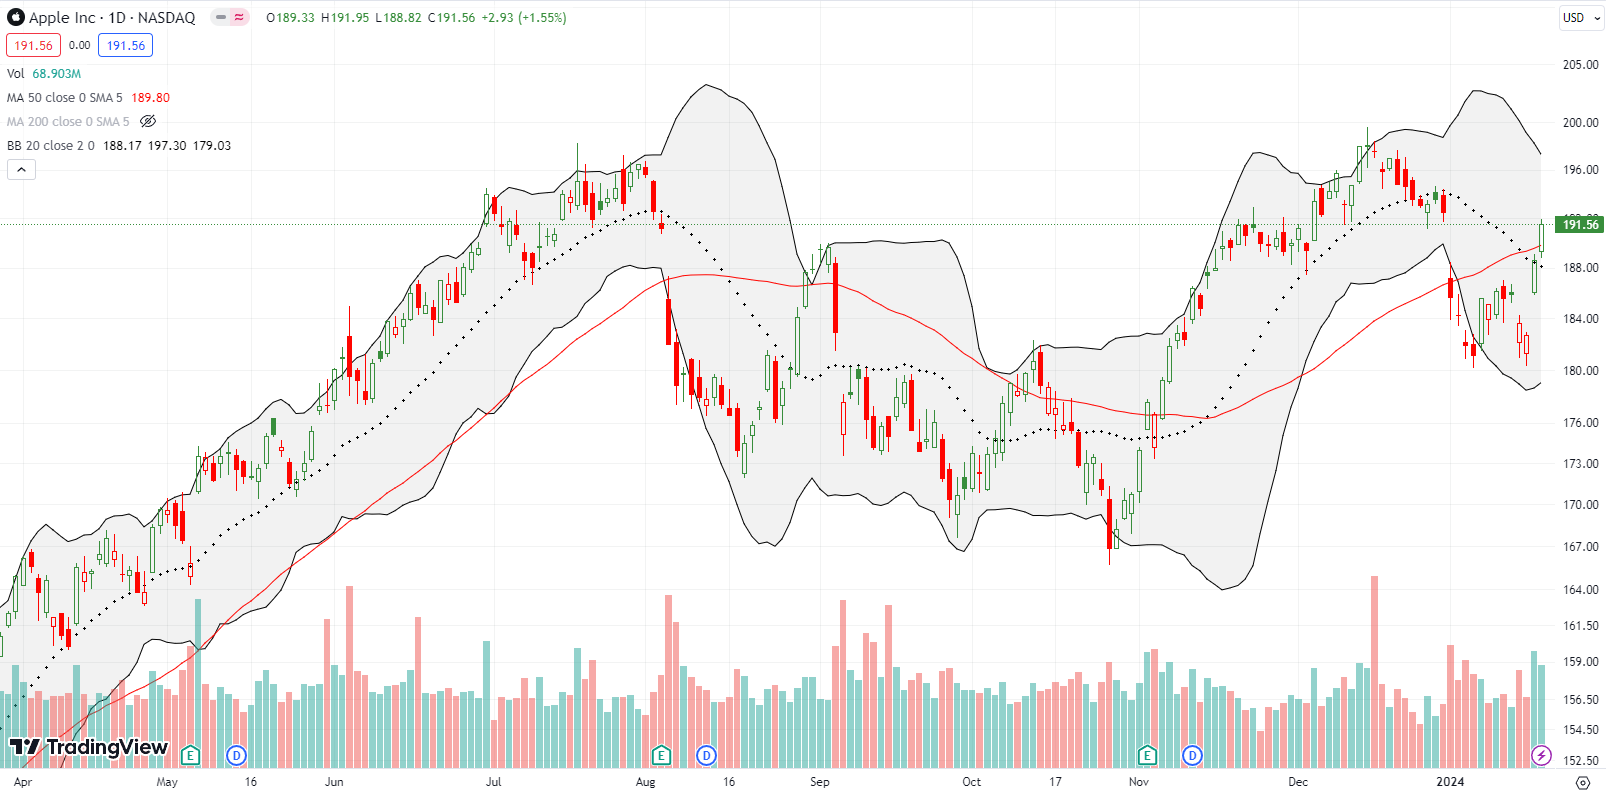
I round out the two truths in the market with Apple Inc (AAPL). AAPL symbolizes a surprising transformation from confirming bearish undertones to supporting bullish overtones, well-supported by analyst chatter. AAPL struggled mightily at the beginning of the year with a 3.6% gap down. That bearish truth got a fresh dose of gloom when AAPL started last week with a retest of its 2024 low. Enter a BofA Securities upgrade from neutral to buy to get people excited all over again, and they forgot all about their earlier concerns. Amazing how that works.
On Thursday, AAPL surged 3.3% and used a 1.6% gain to breakout above its 50DMA. Just like that, AAPL has essentially filled in the gap down from the first trading day of the year.
Be careful out there!
Footnotes
Subscribe for free to get email notifications of future posts!
“Above the 50” (AT50) uses the percentage of stocks trading above their respective 50-day moving averages (DMAs) to measure breadth in the stock market. Breadth defines the distribution of participation in a rally or sell-off. As a result, AT50 identifies extremes in market sentiment that are likely to reverse. Above the 50 is my alternative name for “MMFI” which is a symbol TradingView.com and other chart vendors use for this breadth indicator. Learn more about AT50 on my Market Breadth Resource Page. AT200, or MMTH, measures the percentage of stocks trading above their respective 200DMAs.
Active AT50 (MMFI) periods: Day #49 over 20%, Day #47 over 30%, Day #45 over 40%, Day #44 over 50%, Day #41 over 60%, Day #3 under 70% (underperiod)
Source for charts unless otherwise noted: TradingView.com
Full disclosure: long IWM put spread, long QS, long FORM, long UBER puts
FOLLOW Dr. Duru’s commentary on financial markets via StockTwits, Twitter, and even Instagram!
*Charting notes: Stock prices are not adjusted for dividends. Candlestick charts use hollow bodies: open candles indicate a close higher than the open, filled candles indicate an open higher than the close.


