

Stock Market Commentary
Just one day after stocks narrowly avoided bearish conditions, a looming end to this extended overbought rally brought the stock market right back to the edge. Market breadth is at its lowest point since the overbought period began over a month ago. This tension means that the market may become less willing to ignore any and all bad news. Suddenly, some bad news will matter and become an excuse for a sell-off.
Earnings season kicked off last week, but I cannot even remember the last earnings season the directly catalyzed a significant market move. Larger issues like monetary policy have loomed so large. Interestingly, this earnings season, companies may be dropping more bad news ahead of time than usual. FactSet reported that a greater number of S&P 500 companies have issued guidance, and a higher share of this guidance has been negative:
“Overall, 111 S&P 500 companies have issued quarterly EPS guidance for the fourth quarter, which is above the 5-year average of 97 and above the 10-year average of 98.
Of these 111 companies, 72 have issued negative EPS guidance and 39 have issued positive EPS guidance. The number of companies issuing negative EPS guidance is above the 5-year average of 57 and above the 10-year average of 62. On the other hand, the number of companies issuing positive EPS guidance is below the 5-year average of 40, but above the 10-year average of 36.”
My competing themes for 2024 are the Cathie Wood Market versus the Be Ready So You Don’t Have to Get Ready Market. With a looming end to overbought conditions….be ready.
The Stock Market Indices
The S&P 500 (SPY) teased the 2023 high for three straight days. The middle of the creep included another test of uptrending support at its 20-day moving average (DMA). This positioning sets up a tension between a potential breakout and a fakeout (with a double-top). The looming end of overbought conditions anchors the trading action toward the downside. Having said all that, I held on to a Jan/Feb calendar call spread; I will target taking whatever profits remain next week.
")
The NASDAQ (COMPQ) limited its teasing to uptrending 20DMA support. The tech laden index closed the week short of a test of the 2023 high. As a result, the NASDAQ looks more vulnerable to fresh selling than the S&P 500.
")
The tension just keeps building on the iShares Russell 2000 ETF (IWM). The ETF of small caps continues to pivot around its bear market line. IWM closed (marginally) twice below its bear market line for the first time since last August. I am done speculating on IWM call options until either a breakout above the 20DMA or a test of 50DMA support.
")
The Short-Term Trading Call With A Looming End to Overbought Conditions
- AT50 (MMFI) = 70.7% of stocks are trading above their respective 50-day moving averages (29th overbought day)
- AT200 (MMTH) = 62.1% of stocks are trading above their respective 200-day moving averages
- Short-term Trading Call: neutral
AT50 (MMFI), the percentage of stocks trading above their respective 50DMAs, closed at 70.7%. While the decline was just one percentage point, my favorite technical indicator is a rounding error away from tripping my rules for flipping bearish. The thin margin between here and the overbought threshold at 70% creates a looming end to overbought conditions. The positioning of all three major indices well above support makes it possible for me to aggressively chase after a bearish signal. However, I will still wait for a SECOND close below the overbought threshold before officially flipping bearish. In the meantime, I am preparing by focusing more on identifying bearish opportunities…post-earnings of course.
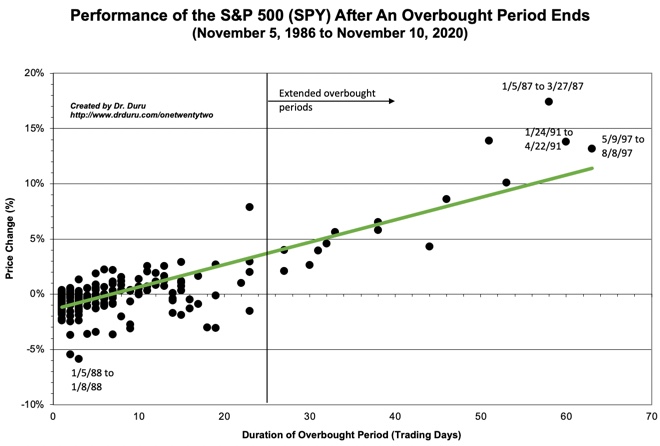
At 29 days long, this overbought period is very extended. Per the chart below, only 13 other overbought periods since 1986 have lasted longer. If overbought conditions ended today, the S&P 500 would have a 4.1% gain for the overbought period. This performance would be slightly above expectations (the green line in the chart below). Accordingly, I will not be surprised if the S&P 500 nudges higher even as the overbought period comes to an end (watch for sinking small caps). The scenario of the S&P 500 continuing higher even as AT50 declines and drops below the 70% threshold is one of the scenarios I described a week ago. The resulting bearish divergence will likely resolve to the downside (per my informal recollection of history).
The Schwab Trading Activity Index for December is interesting. While the stock market was raging higher, this proprietary index from Schwab’s investors indicates a surprising wariness. “For December 2023, the STAX score of 44.56 increased from 43.64 in November. The reading for the five-week period ended Dec. 29, 2023 ranked ‘moderate low’ compared with historical averages.” This hesitancy to buy into the rally suggests there is plenty of sideline money itching to buy into a pullback. Thus, I have every reason to believe the next sell-off in the stock market will be relatively shallow and well-supported by the 50DMAs (red lines in the charts).
The “sell the news” drama in cryptocurrencies continued right to the end of the week. I took profits in my Coinbase Global, Inc (COIN) put spread and marveled at how I whiffed on a fresh opportunity to fade the Valkyrie Bitcoin Miners ETF (WGMI). WGMI gapped higher Thursday morning and sellers took over from there. Unlike COIN, WGMI did not quite reach 50DMA support. As a reminder, WGMI is yet another classic example of the danger of parabolic run-ups in price.
")
Meanwhile, fresh volatility in Bitcoin (BTC/USD) and Ethereum (ETH/USD) have facilitated my old strategy of buying dips and selling the next rally. At the time of writing, BTC/USD is clinging precariously to 50DMA support. If BTC/USD breaks down below the range in place since December, I will increase the size of my purchases and target around 38,400 as the next buying point. BTC/USD broke out at that point in early December to new highs for the year. Having said all this, I am VERY wary of Bitcoin making another lasting top associated with a major market event. The all-time high for Bitcoin coincided with the IPO for COIN.
")
With a looming end to overbought conditions, I am more susceptible to bearish setups. At the beginning of the year, I identified Uber Technologies, Inc (UBER) as a stock to bet on a top. The moment may have arrived on Friday as UBER made a new all-time high only to fade. Typically, I would wait for a lower close before going short, but I decided to move aggressively on this one with put options expiring in early February.
")
Egg producer Cal-Maine Foods, Inc (CALM) is the kind of stock I will try to buy for a swing trade even with a looming end to overbought conditions. CALM reported earnings the prior week and rebounded from an initial gap down. So far, the stock is holding that low. I bought shares on Friday as the stock continued light momentum from its lower Bollinger Band (BB). I am assuming CALM has more consolidation to go before a sufficient amount of selling pressure shakes out of the stock.
")
On the other hand, Etsy, Inc (ETSY) is the kind of stock that I will actively target for shorts with a looming end to overbought conditions. ETSY confirmed a 50DMA breakdown a week after the stock fooled me with an apparent defense of 50DMA support. I paid the price with call options. Now I want to buy put options on the next bounce.
")
")
")
Be careful out there!
Footnotes
Subscribe for free to get email notifications of future posts!
“Above the 50” (AT50) uses the percentage of stocks trading above their respective 50-day moving averages (DMAs) to measure breadth in the stock market. Breadth defines the distribution of participation in a rally or sell-off. As a result, AT50 identifies extremes in market sentiment that are likely to reverse. Above the 50 is my alternative name for “MMFI” which is a symbol TradingView.com and other chart vendors use for this breadth indicator. Learn more about AT50 on my Market Breadth Resource Page. AT200, or MMTH, measures the percentage of stocks trading above their respective 200DMAs.
Active AT50 (MMFI) periods: Day #46 over 20%, Day #44 over 30%, Day #42 over 40%, Day #41 over 50%, Day #38 over 60%, Day #29 over 70% (29th day overbought)
Source for charts unless otherwise noted: TradingView.com
Full disclosure: long SPY call spread, long BTC/USD, long CALM, long UBER puts
FOLLOW Dr. Duru’s commentary on financial markets via StockTwits, Twitter, and even Instagram!
*Charting notes: Stock prices are not adjusted for dividends. Candlestick charts use hollow bodies: open candles indicate a close higher than the open, filled candles indicate an open higher than the close.