Stock Market Commentary
The economic numbers keep coming up roses for the stock market. Last week’s celebration was driven by a soft inflation report for October that further emboldened buyers. A fresh surge in bond prices (lower yield) led the way as small caps in particular rocketed higher. The relentless buying pressure also solidified the bullish sentiment in the stock market. This inflation celebration put overbought conditions within sight. At the current rate of buying, overbought conditions represent the most likely challenge left for a market that continues to look for any excuse to celebrate. To the downside, a large gap up beckons for a fill.
The Stock Market Indices
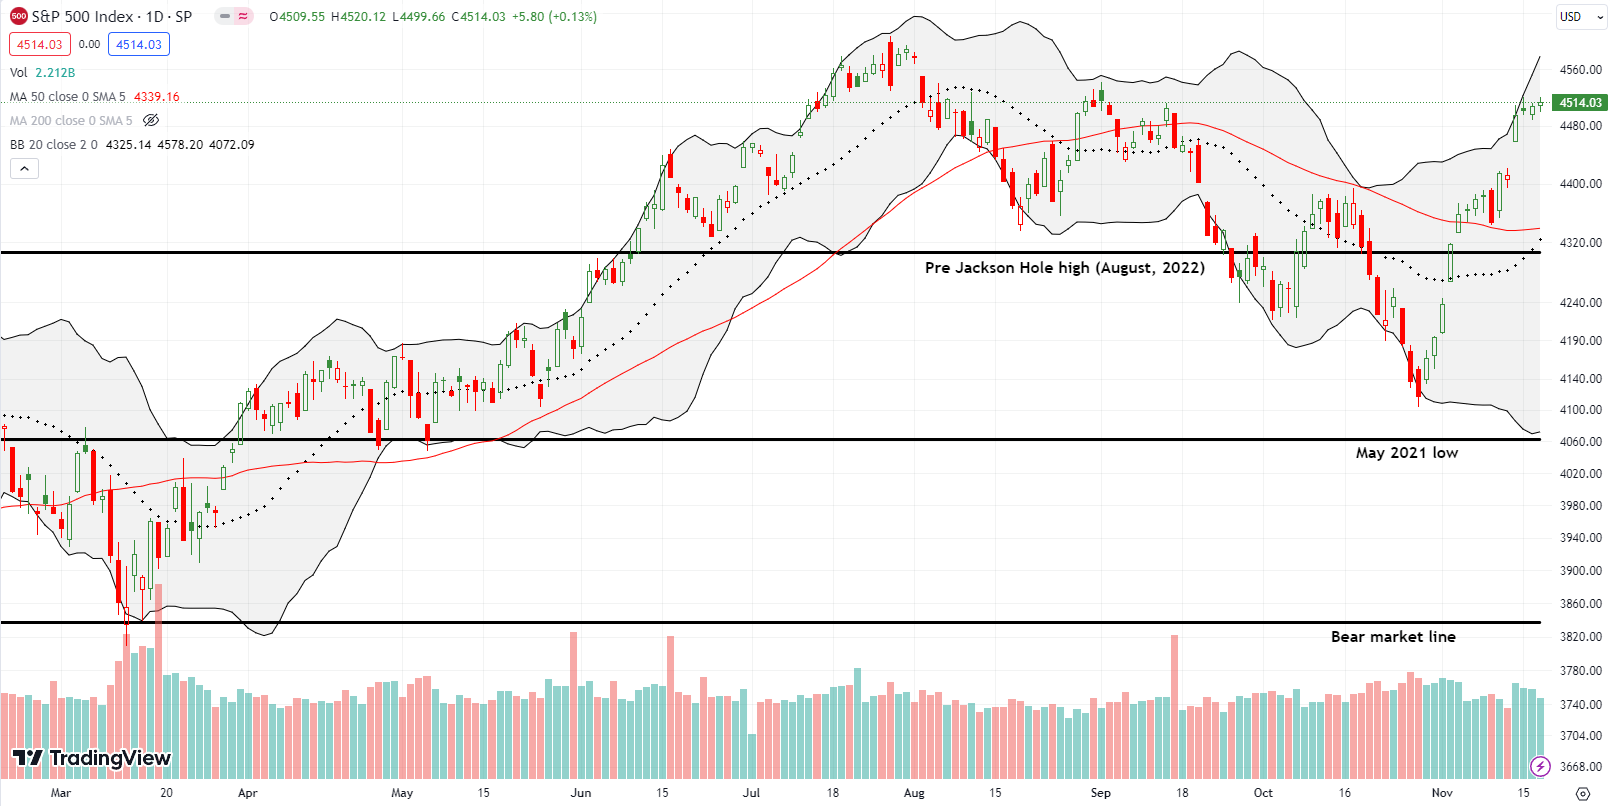
The S&P 500 (SPY) celebrated the inflation report with a gap up and 1.9% gain. While buyers were not able to nudge the index much higher from there, the S&P 500 looks coiled and ready to launch higher into overbought conditions. The S&P 500 ended the week right at the previous closing high on September 1st. I bought an SPY $453/$458 call spread in anticipation of a Thanksgiving/Black Friday push higher.
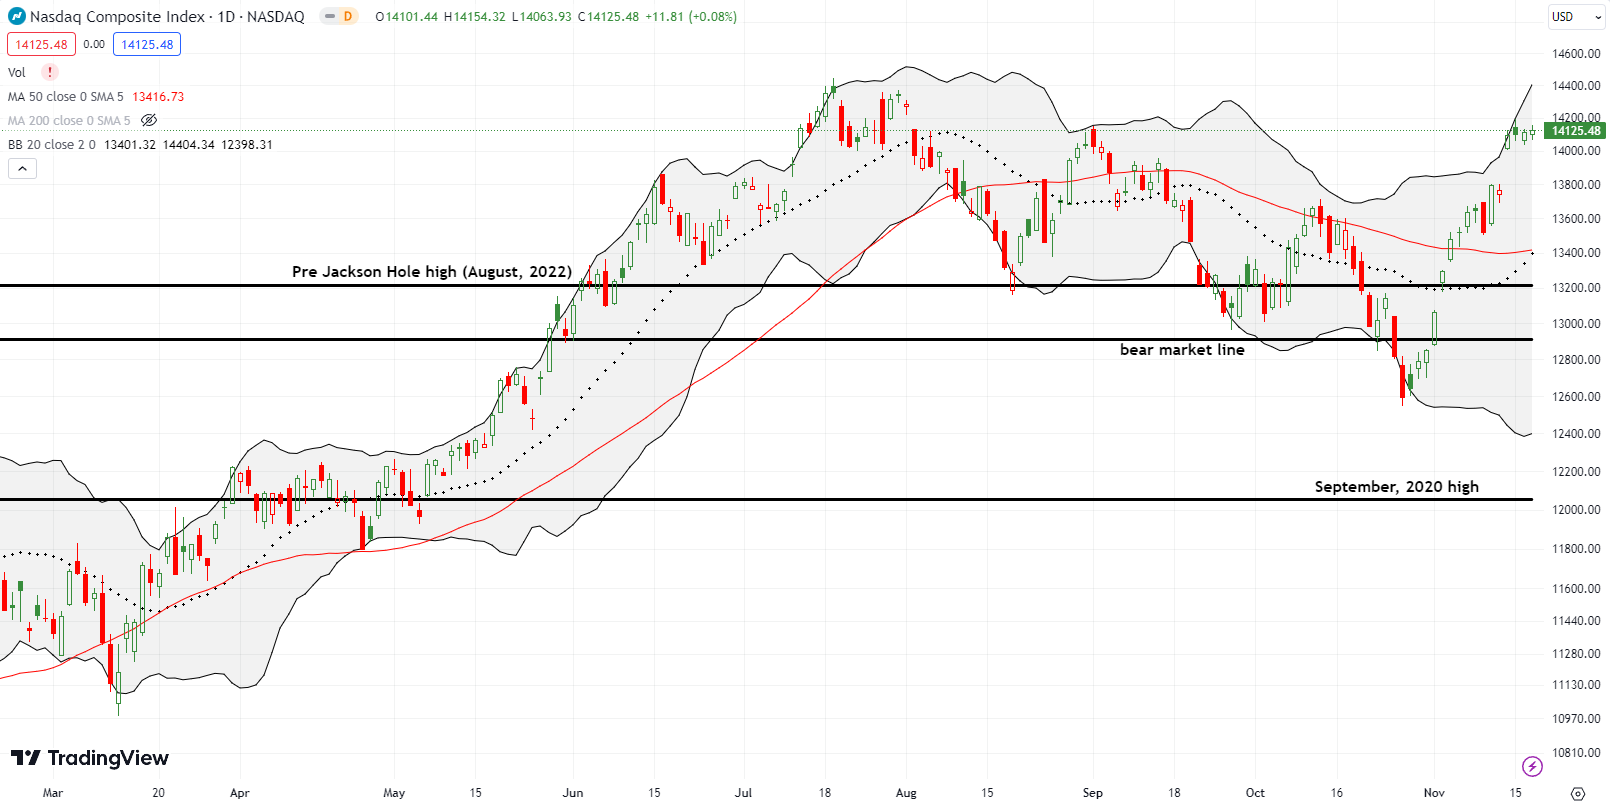
The NASDAQ (COMPQ) celebrated the inflation report with a 2.4% surge. Like the S&P 500, buyers failed to nudge the tech-laden index much higher. However, the NASDAQ did clear the hurdle of the August 30/September 1st high. The NASDAQ has an unimpeded shot at challenging the summer’s high.
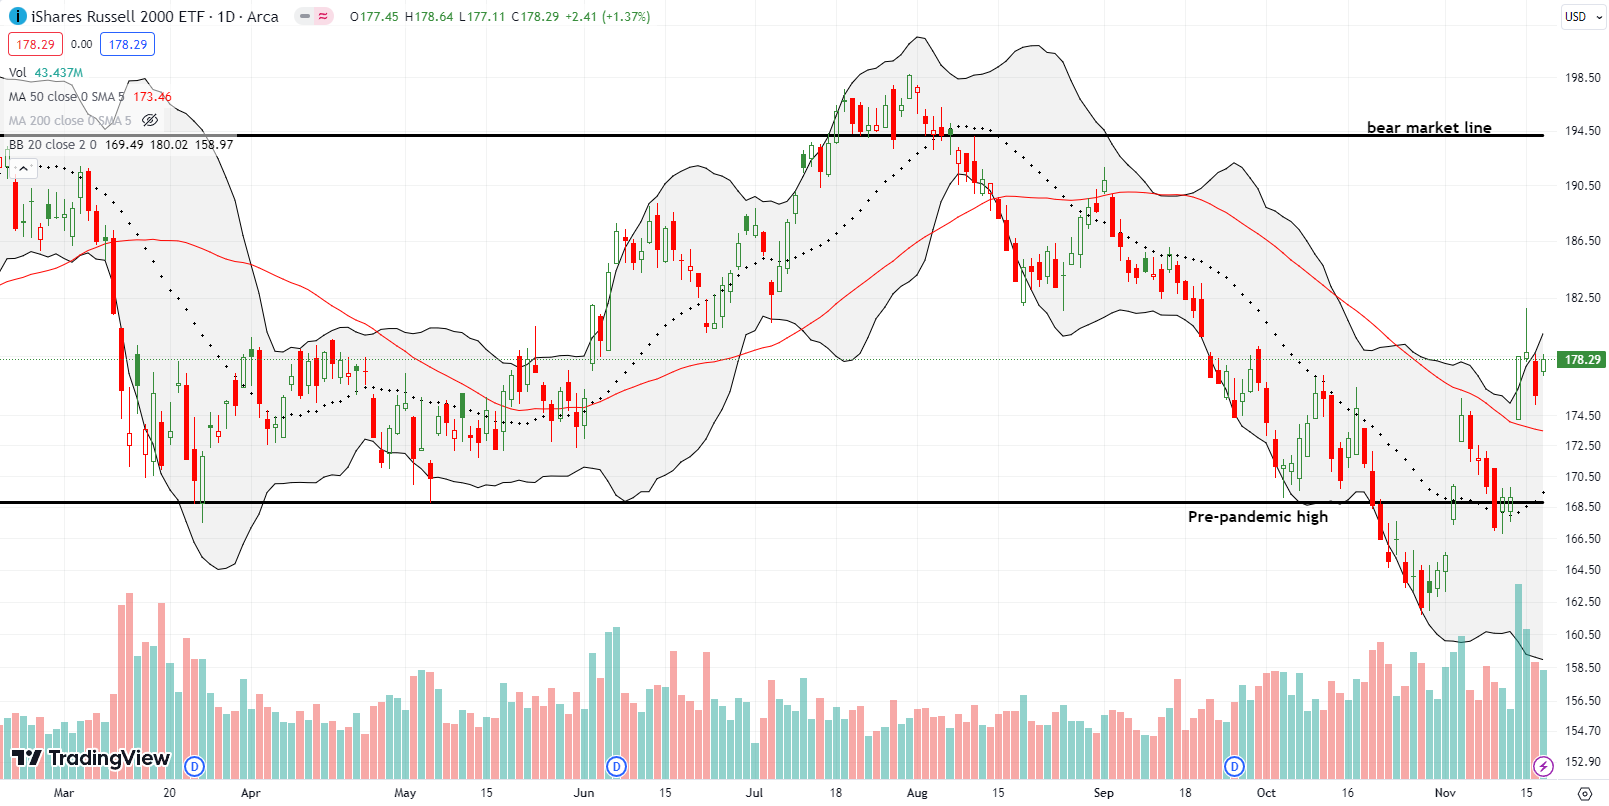
The iShares Russell 2000 ETF (IWM) was the bigger winner of the week. Yet, the ETF of small caps also had a much more volatile experience. IWM celebrated the inflation report with a 5.5% run-up. Buyers were still excited the next day and pushed IWM up another 1.8% before profit-takers took over. The sellers faded IWM back to near flat on the day and continued selling the next day. Buyers took over again on Friday and gapped IWM back to flat with Tuesday’s inflation celebration. The churn left IWM without a clear confirmation of its breakout above resistance at its 50-day moving average (DMA).
I laid out my latest trading rule for IWM in the last Market Breadth. I lamented missing IWM’s first 20DMA breakout because the action moved too fast. So I jumped at the chance to trade on 20DMA support. The inflation celebration was so extreme, I took profits starting with the open and then lastly near the close. I am next looking to buy a pullback to or toward 50DMA support. I missed Thursday’s early opportunity.
The Short-Term Trading Call With An Inflation Celebration
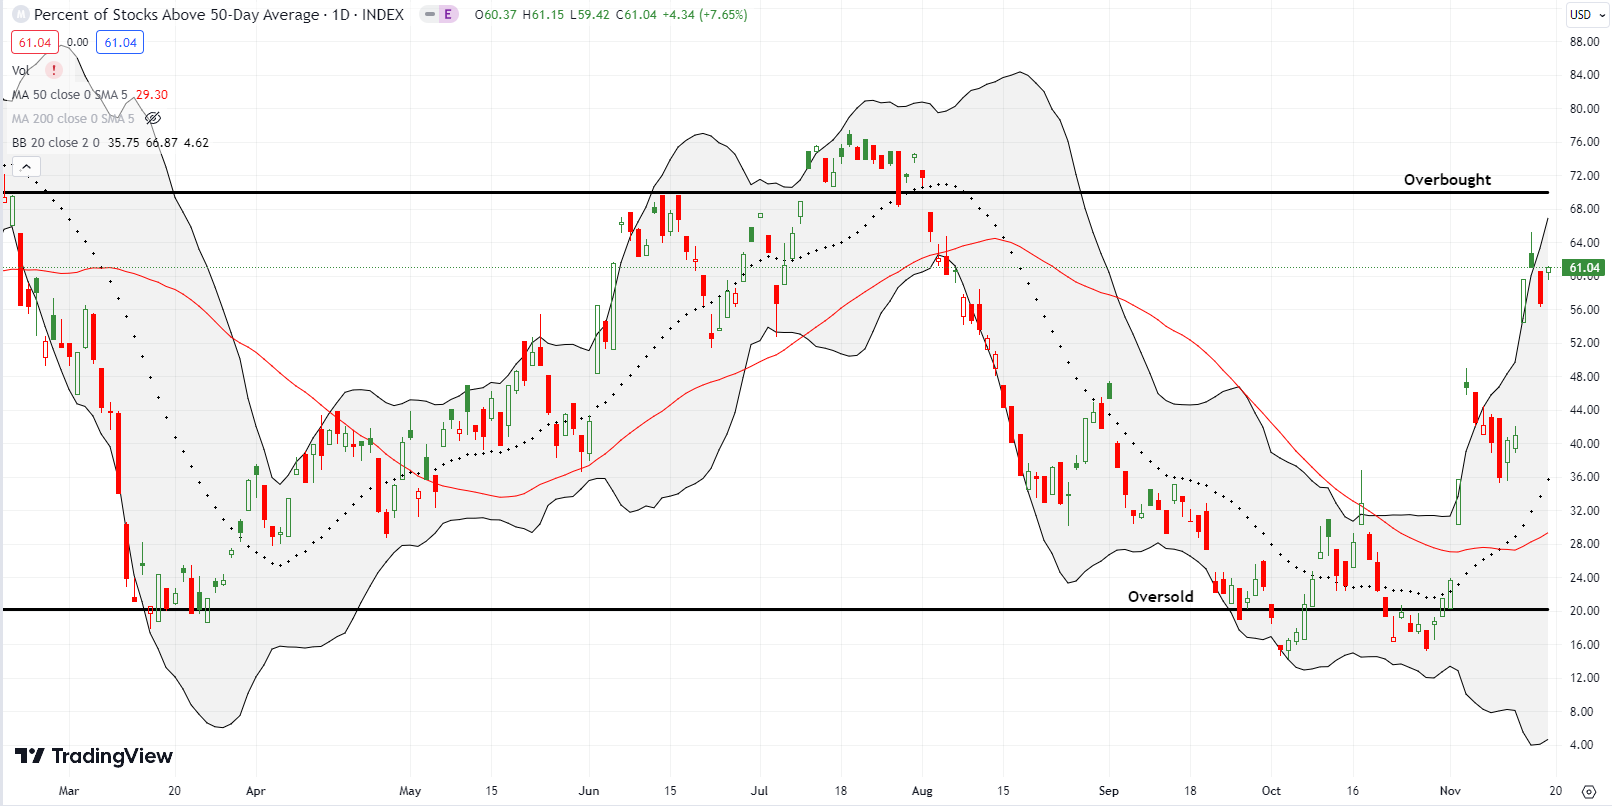
- AT50 (MMFI) = 61.0% of stocks are trading above their respective 50-day moving averages
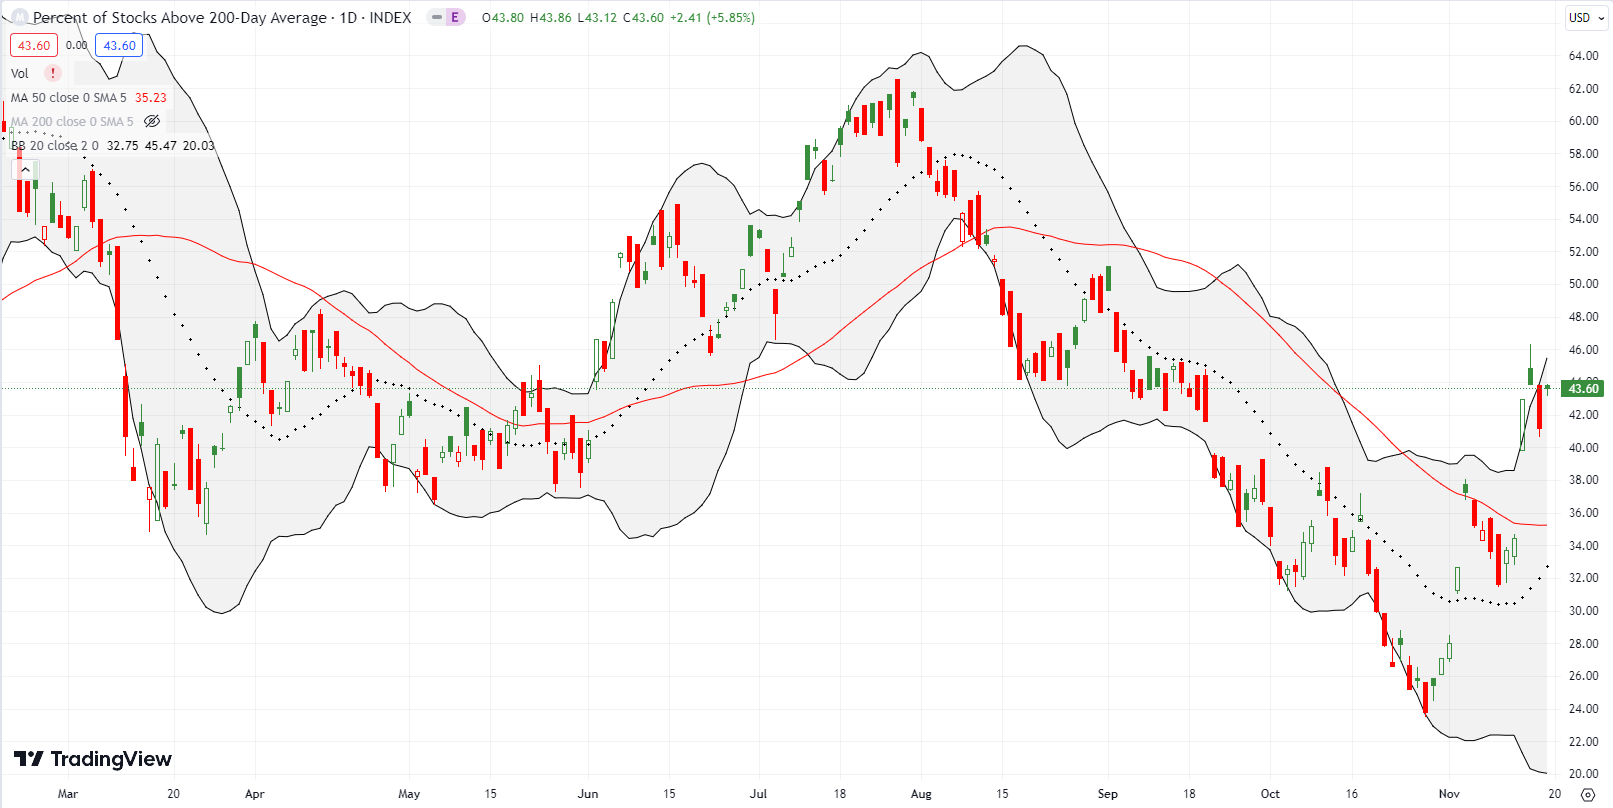
- AT200 (MMTH) = 43.6% of stocks are trading above their respective 200-day moving averages
- Short-term Trading Call: cautiously bullish
AT50 (MMFI), the percentage of stocks trading above their respective 50DMAs, mainly followed the volatility of IWM. My favorite technical indicator celebrated the inflation report with a surge from 40.9% to 59.6%. In just one day, AT50 put overbought conditions within sight. Thus, I downgraded my short-term trading call to cautiously bullish. This downgrade prepares me to flip bearish if/once AT50 fails at the overbought threshold (review the AT50 trading rules for the nuances of trading overbought conditions). Moreover, the large gap up not only confirmed bullish sentiment but also carved out a caveat: large gaps in the indices are extremes and subject to eventual fills.
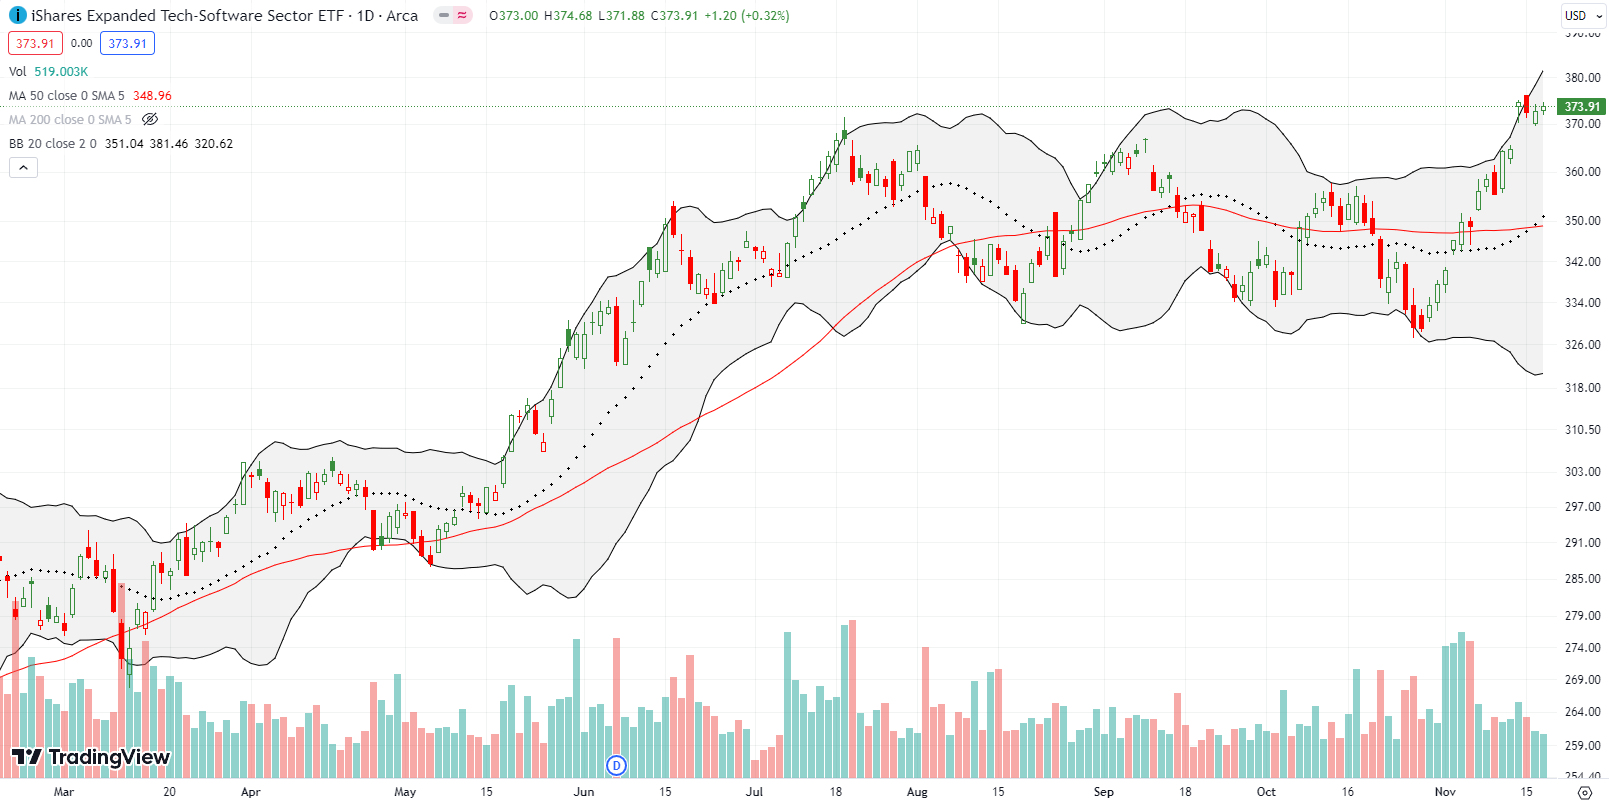
One of the most bullish charts of the week came in the form of the iShares Expanded Tech-Software Sector ETF (IGV). IGV’s inflation celebration created a new high for the year. IGV closed the week at a near 23-month high. IGV is in a bullish breakout position and looks poised to go higher. I am a buyer on the next close higher.
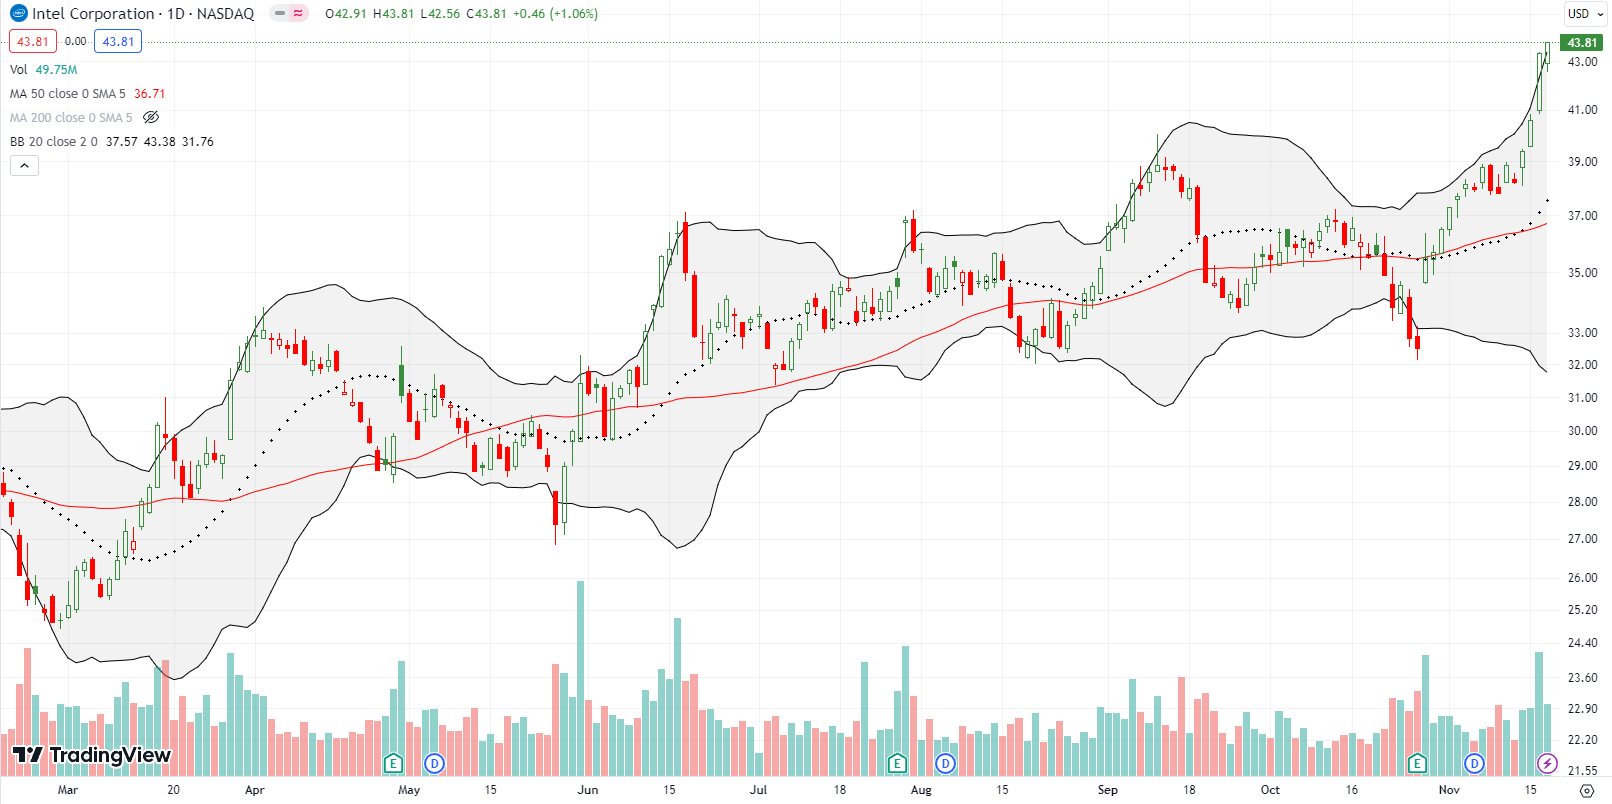
I like to buy Intel Corporation (INTC) call options between earnings. The stock tends to sell-off post-earnings, or shortly thereafter, only to recover at some point. I was not as attentive as usual this time around. INTC fell to a 3-month low right before earnings, making INTC look dangerous. However, the sellers and bears got completely faked out as INTC jumped 9.3% post-earnings. Still, such a big move seemed ripe for some kind of gap fill, especially with INTC closing right at resistance at the 50DMA. Instead, buyers pressed on.
The relentless buying turned nearly parabolic next week. INTC closed at a near 18-month high, and now I definitely need to wait for a cooling. Notice how the 50DMA has sneakily trended upward since March.
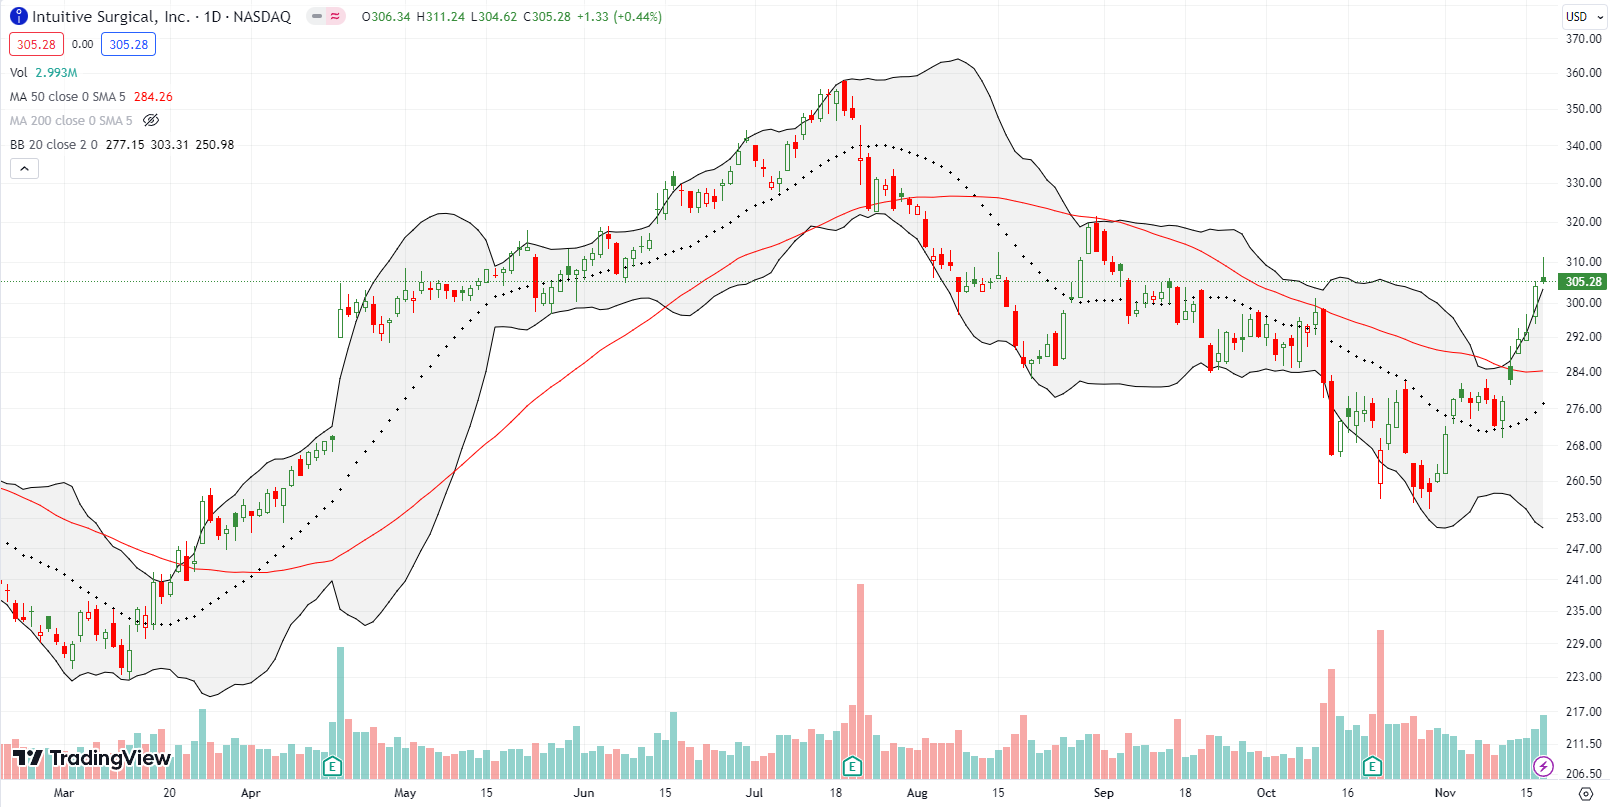
Intuitive Surgical, Inc (ISRG) struggled after its last two earnings reports. The struggles are transitioning to a return to bullish sentiment. Last week, ISRG confirmed a 50DMA breakout and charged relentlessly higher all week. The stock is a bit stretched after 4 straight closes above the upper Bollinger Band (BB). The fade from intraday highs on Friday sets ISRG up for some kind of cooling. I want to buy the dips all the way back to 50DMA support.
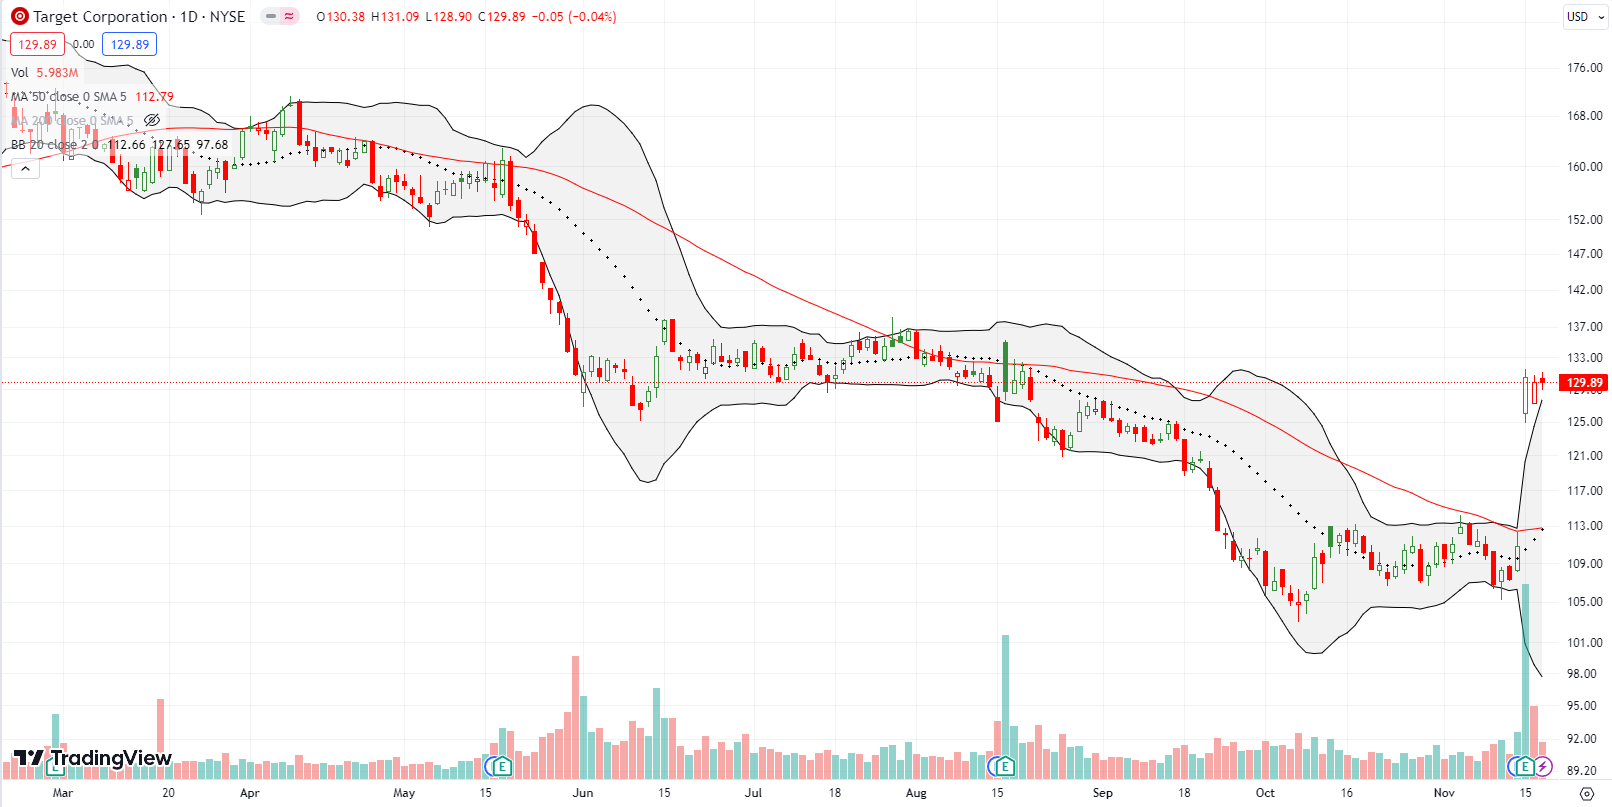
Last week was revenge week for big box retailer Target Corporation (TGT). A 17.8% post-earnings gain sent TGT to a 3-month high. While TGT has a LONG way to go to return to former glory, last week’s move laid the foundation for a sustained bottom. Going forward, TGT is a buy on the dips while above its 50DMA.
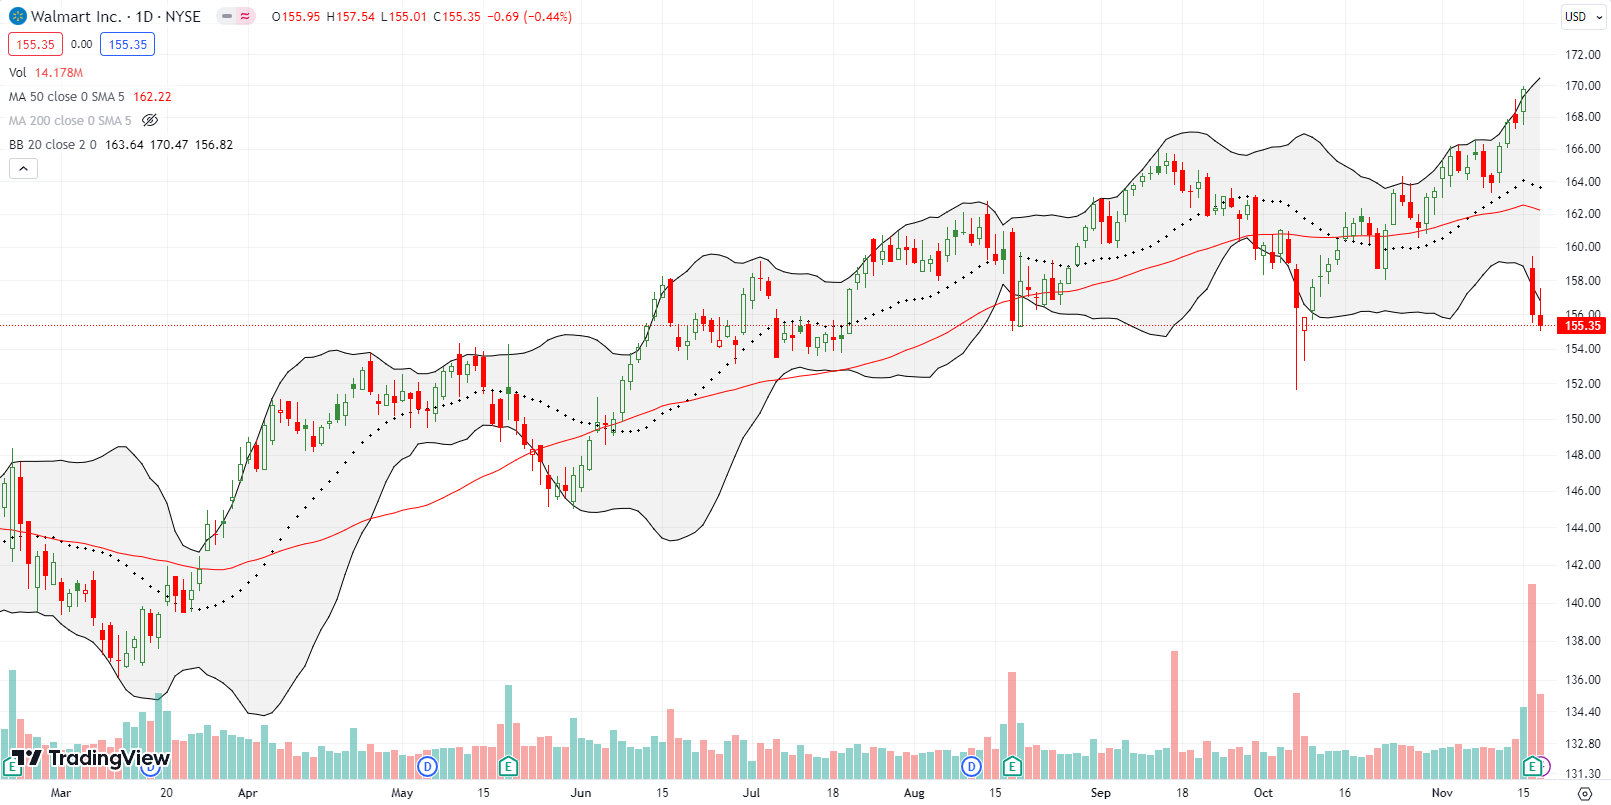
TGT must have absorbed some Walmart Inc (WMT) money. WMT gapped down for an 8.1% post-earnings loss and sellers kept pressing on Friday. This pullback looks like a buying opportunity. My read tells me the market was looking for any excuse to take profits on what has acted like a “defensive” stock while retailers like Target struggled.
For example, a Seeking Alpha article proclaimed that Walmart warned on consumer spending. However, the full context of the commentary shows WMT management was overall optimistic. From the Seeking Alpha transcript of the conference call (emphasis mine to show the negativity embedded within positive commentary):
“Sales during November have turned higher as unseasonal weather abated and we kicked-off holiday events. So sales have been somewhat uneven and this gives us reason to think slightly more cautiously about the consumer versus 90 days ago. We still expect sales growth to moderate in Q4 versus prior quarters as grocery inflation further normalizes towards historic levels. So we’re encouraged by the increased traffic and share gains we’ve seen and expect them to continue. As such, we are modestly raising our full year sales guidance to 5% to 5.5% from 4% to 4.5% previously primarily to reflect Q3’s outperformance.”
Note how Walmart even RAISED sales guidance in the wake of a strong quarter!
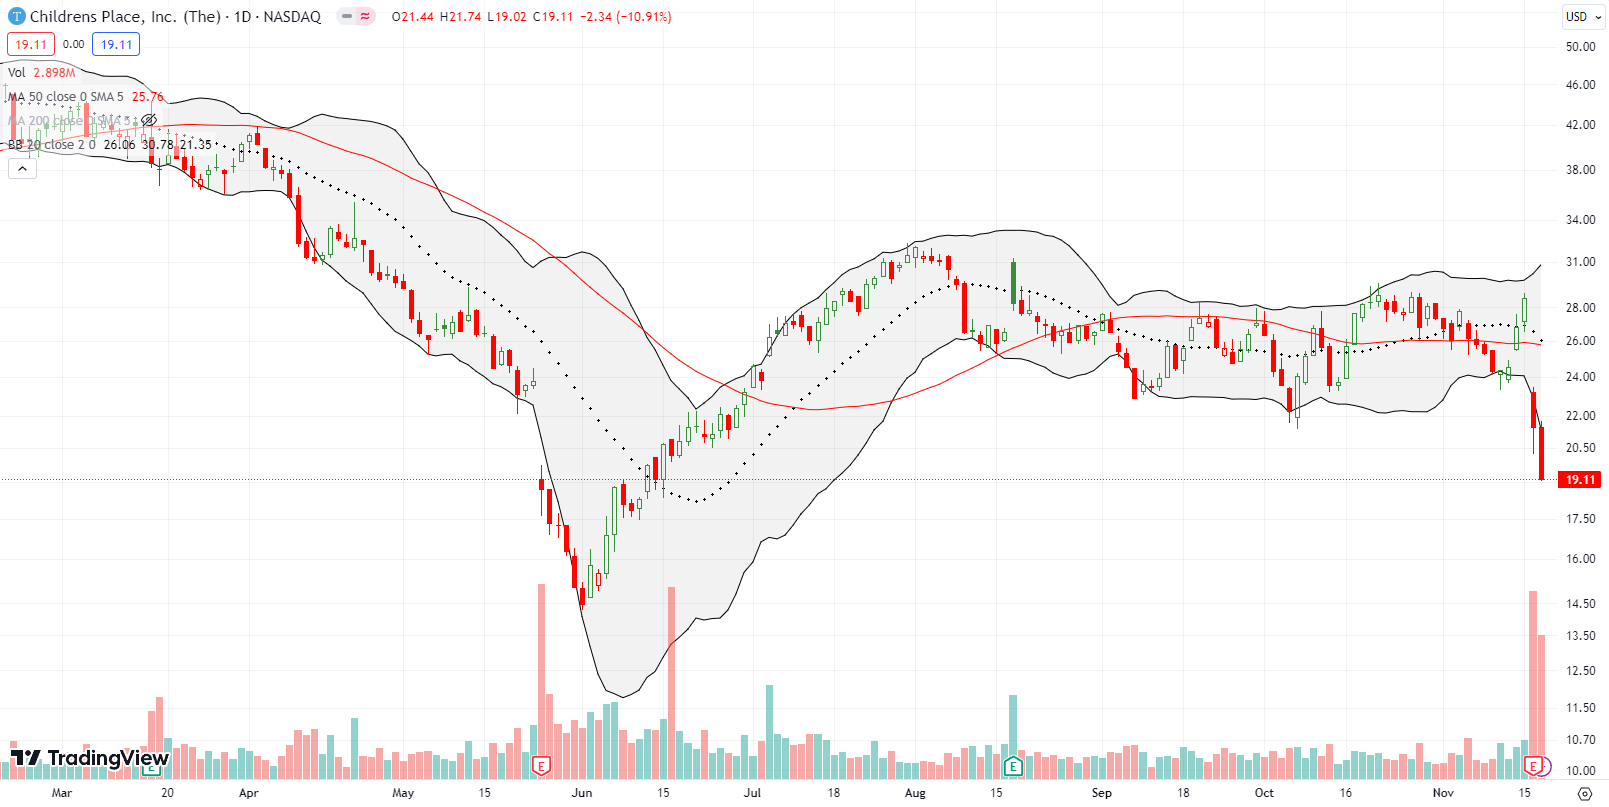
Kids clothing specialty retailer Children’s Place, Inc (PLCE) suffered mightily post-earnings. I was not able to find the diamond amid the negativity given the company’s terrible earnings guidance relative to “consensus” expectations. PLCE is a no-touch and probably a fade on the next move higher.
Be careful out there!
Footnotes
Subscribe for free to get email notifications of future posts!
“Above the 50” (AT50) uses the percentage of stocks trading above their respective 50-day moving averages (DMAs) to measure breadth in the stock market. Breadth defines the distribution of participation in a rally or sell-off. As a result, AT50 identifies extremes in market sentiment that are likely to reverse. Above the 50 is my alternative name for “MMFI” which is a symbol TradingView.com and other chart vendors use for this breadth indicator. Learn more about AT50 on my Market Breadth Resource Page. AT200, or MMTH, measures the percentage of stocks trading above their respective 200DMAs.
Active AT50 (MMFI) periods: Day #9 over 20%, Day #7 over 30%, Day #5 over 40%, Day #4 over 50%, Day #1 over 60%, Day #71 under 70%
Source for charts unless otherwise noted: TradingView.com
Full disclosure: long SPY call spread, long TGT
FOLLOW Dr. Duru’s commentary on financial markets via StockTwits, Twitter, and even Instagram!
*Charting notes: Stock prices are not adjusted for dividends. Candlestick charts use hollow bodies: open candles indicate a close higher than the open, filled candles indicate an open higher than the close.


Thanks
You’re welcome!