
Stock Market Commentary
An October jobs report with some weakening numbers and more downward revisions of prior numbers appeared to reinforce the market’s celebratory conclusion that the Fed is done hiking interest rates. The resulting drop in long-term interest rates helped to support a major reset for the stock market. October’s bearishness has given way to a resounding oversold bounce. Yet again, another cycle of market sentiment demonstrates the value of sticking to the discipline of trading counter to extremes of market sentiment.
The Stock Market Indices
The S&P 500 (SPY) rallied straight up. The major reset delivered a 5.9% gain for the week. The index sliced through every major line of resistance, including its 50-day moving average (DMA) (not shown). If the S&P 500 manages to break out above the October high, the index will be right back into bullish positioning. Not only will a major resistance point give way, but also the downtrend channel from the 2023 high will come to an end. In the meantime, I am treating the S&P 500 as a buy-the-dip down to the 200DMA (the blue line below).
")
The NASDAQ (COMPQ) pulled off the same feats as the S&P 500. The tech laden index gained 6.6% on the week as a reward for its efforts. While the NASDAQ still has to pull off one more breakout to get back to bullish positioning, I am impressed with the general resiliency of the uptrending 200DMA. The NASDAQ’s October return to a bear market swiftly came to an end. That milestone alone is a bullish sign.
")
The iShares Russell 2000 ETF (IWM) lagged the other two major indices until it played catch-up the last two days of the week. The burst was enough to push IWM into a stellar 7.6% gain for the week. IWM moved so fast, I did not get a chance to speculate on some IWM calls. My buy signal was a 20DMA breakout (the dotted line below), but I did not want to chase the subsequent gap up. I like buying the dips on IWM down to the converged support of the pre-pandemic high and the 20DMA.
")
The Short-Term Trading Call With A Major Reset
- AT50 (MMFI) = 46.6% of stocks are trading above their respective 50-day moving averages (ending a 1-day oversold period)
- AT200 (MMTH) = 37.2% of stocks are trading above their respective 200-day moving averages
- Short-term Trading Call: bullish
AT50 (MMFI), the percentage of stocks trading above their respective 50DMAs, closed the week at 46.6%. Its parabolic move for the week started in oversold territory and ended at a startling 3-month high. This stunning and swift major reset leaves my favorite technical indicator in an over-stretched position. Accordingly, I am tempted to downgrade the short-term trading call to cautiously bullish. However, such a shift would be too short-term in nature and also raise the risk of churning the call. I particularly do not want to get caught downgrading the call just ahead of a confirmed 50DMA breakout for the S&P 500 and the NASDAQ.
Needless to say, last week was a good week to stay disciplined with the AT50 trading rules. My experience with these rules and prior mistakes kept telling me to stay patient and to ignore fundamental reasons to disbelieve the significance of the buying. I ignored concerns over a major government auction of debt, another Federal Reserve meeting, and the October jobs report. Along the way, I of course locked in profits and I did lean on a few hedges (like Apple (AAPL) put spreads). After all, trading for an oversold bounce is not about making predictions. Instead, it is about leaning with the odds.
I go into the current week with no positions on the indices, so I am itching to go after a dip. I am long some housing market plays positioned for a portion of the seasonally strong period for home builders.
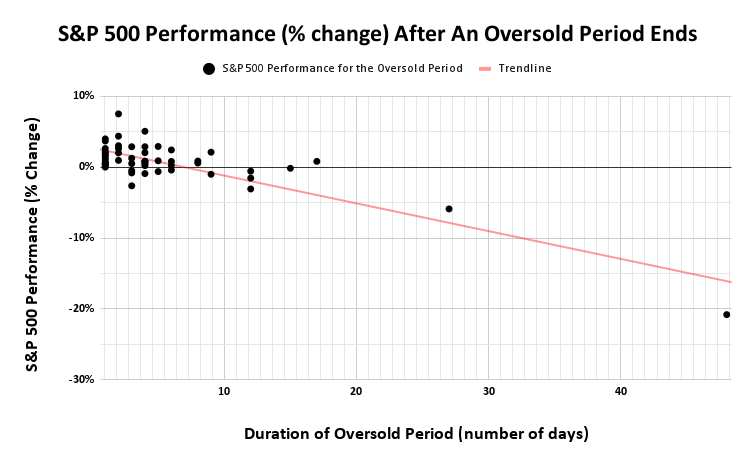
Ironically, the oversold bounce delivered outsized gains while the S&P 500’s -0.7% loss during the oversold period slightly underperformed historical patterns. On the other hand, this setup allowed the conservative oversold trading strategy to deliver big gains.
ARK Innovation ETF (ARKK) was an iconic winner for the week. This hotbed of speculation gained 18.6% for the week. Most of the gains occurred in just the last two days. I took a look at the options on Thursday and was surprised by their “cheapness”. The pricing implied the kind of skepticism I want to see in an oversold bounce. So, I bought a fistful of ARKK Nov 10 ’23 $39 calls. On Friday, these calls promptly gained 133% as ARK rushed into 200DMA resistance with a 5.6% gain. ARK also broke out above its 50DMA (not shown below). A higher close will confirm the end of ARK’s downtrend from the summer highs.
")
Live Nation Entertainment, Inc (LYV) had a jittery post-earnings reaction. I missed a great opportunity there. LYV reported strong headline results and gapped higher on Friday’s open. Sellers immediately descended on the stock and wiped out the gains. Before I could even think about buying into the reversal, buyers took over control one more time. While LYV will need to overcome the October highs to return to a clean, bullish positioning, I feel good assuming sellers exhausted themselves trying to reverse the post-earnings gains.
")
I missed a big bearish opportunity with BILL Holdings, Inc (BILL). A bullish engulfing post-earnings reaction in August put BILL on my radar as a bottoming stock. Particularly compelling was BILL’s move below and then above the 200DMA. However, the subsequent trading was not compelling, and I soon forgot about BILL. In the prior week, BILL closed below its post-earnings intraday low and drooped into bearish territory. BILL’s inability to rally with the oversold bounce was the confirming red flag. BILL closed Friday post-earnings with a 25.2% loss and was down as much as 35.0%.
")
")
")
Be careful out there!
Footnotes
Subscribe for free to get email notifications of future posts!
“Above the 50” (AT50) uses the percentage of stocks trading above their respective 50-day moving averages (DMAs) to measure breadth in the stock market. Breadth defines the distribution of participation in a rally or sell-off. As a result, AT50 identifies extremes in market sentiment that are likely to reverse. Above the 50 is my alternative name for “MMFI” which is a symbol TradingView.com and other chart vendors use for this breadth indicator. Learn more about AT50 on my Market Breadth Resource Page. AT200, or MMTH, measures the percentage of stocks trading above their respective 200DMAs.
Active AT50 (MMFI) periods: Day #4 over 20%, Day #2 over 30%, Day #1 over 40% (overperiod ending 43 days under 40%), Day #58 under 50% (underperiod), Day #63 under 60%, Day #66 under 70%
Source for charts unless otherwise noted: TradingView.com
Full disclosure: long ARKK,
FOLLOW Dr. Duru’s commentary on financial markets via StockTwits, Twitter, and even Instagram!
*Charting notes: Stock prices are not adjusted for dividends. Candlestick charts use hollow bodies: open candles indicate a close higher than the open, filled candles indicate an open higher than the close.
Bravo, great report or perhaps reflects my current posture. So I don’t know whether your right or is it me. Still the tingling on the bottom of my feet tells me to beware of the Gorilla’s debt load which is quite unsettling. My ole econ professor said “guns or butter” and this past week I heard Kudlow mummering the same. Stay tuned to bond auctions on Wed?/ Thursday. Perhaps safe haven will help us. The Gorilla is inhaling all the money in the United States and wants the World’s.
Among all this, the IWM gap up was the real money-maker. For what it’s worth (and you’re better at this than I ever was), my gut tells me IWM is constantly playing catch-up. If my gut is correct, IWM is a money-printing machine. Can you figure out a way to validate (or debunk) my intuition?
The debt issue has been simmering for a while now. I think we are hitting a crescendo for its impact on the stock market. It seems like “everyone” is finally paying attention to what’s happening. The next key catalyst may be when/if all this massive debt issuance sends longer-term yields skyrocketing again.
Welllll….I was in the habit of buying IWM call options FIRST when I anticipated an eventual market bounce. But after a few losing swings, I had to stop even though I knew it would mean I’d miss the eventual bounce. It just made more sense to step aside something that was practically in freefall. As long as IWM is about its 20DMA, I’m back in the game.
As far as trying to validate IWM’s behavior…the out-performance/under-performance has bounced back and forth. It hasn’t been worth predicting when IWM will be the better one or not. I think the tightest correlation has been to interest rates. IWM appears a lot more sensitive than the S&P 500 or the NASDAQ. That relationship is driven by the preponderance of banks in IWM and profitless companies.