Stock Market Commentary
Oversold trading conditions await no more. The stock market went over hard and dropped into oversold territory with a sinking feeling. Important support levels broke down, interest rates continued to surge, the U.S. dollar continued to race higher, and, returning to a theatre near you for yet another dreadful showing is Groundhog day, the U.S. government shutdown edition (or as some would say an operational “disruption”). The hangover from last week’s Federal Reserve meeting looms large over the stock market with not a single positive catalyst in sight.
And yet, these oversold conditions are an occasion for (short-term) bullishness…
The Stock Market Indices
The S&P 500 (SPY) failed to hold support at its pre Jackson Hole High from last year. The 1.5% shot straight down further extended the index below its lower Bollinger Band (BB). These over-stretched conditions are pointing toward a highly important test of converged support from the 200-day moving average (DMA) (the bluish line below) and the price where the summer of loving stocks began. The “good news” is that if such a test happens this week, the S&P 500 should be over ready for a major rebound out of deep oversold conditions. In the meantime, I bought a weekly SPY call spread and calls expiring next week.
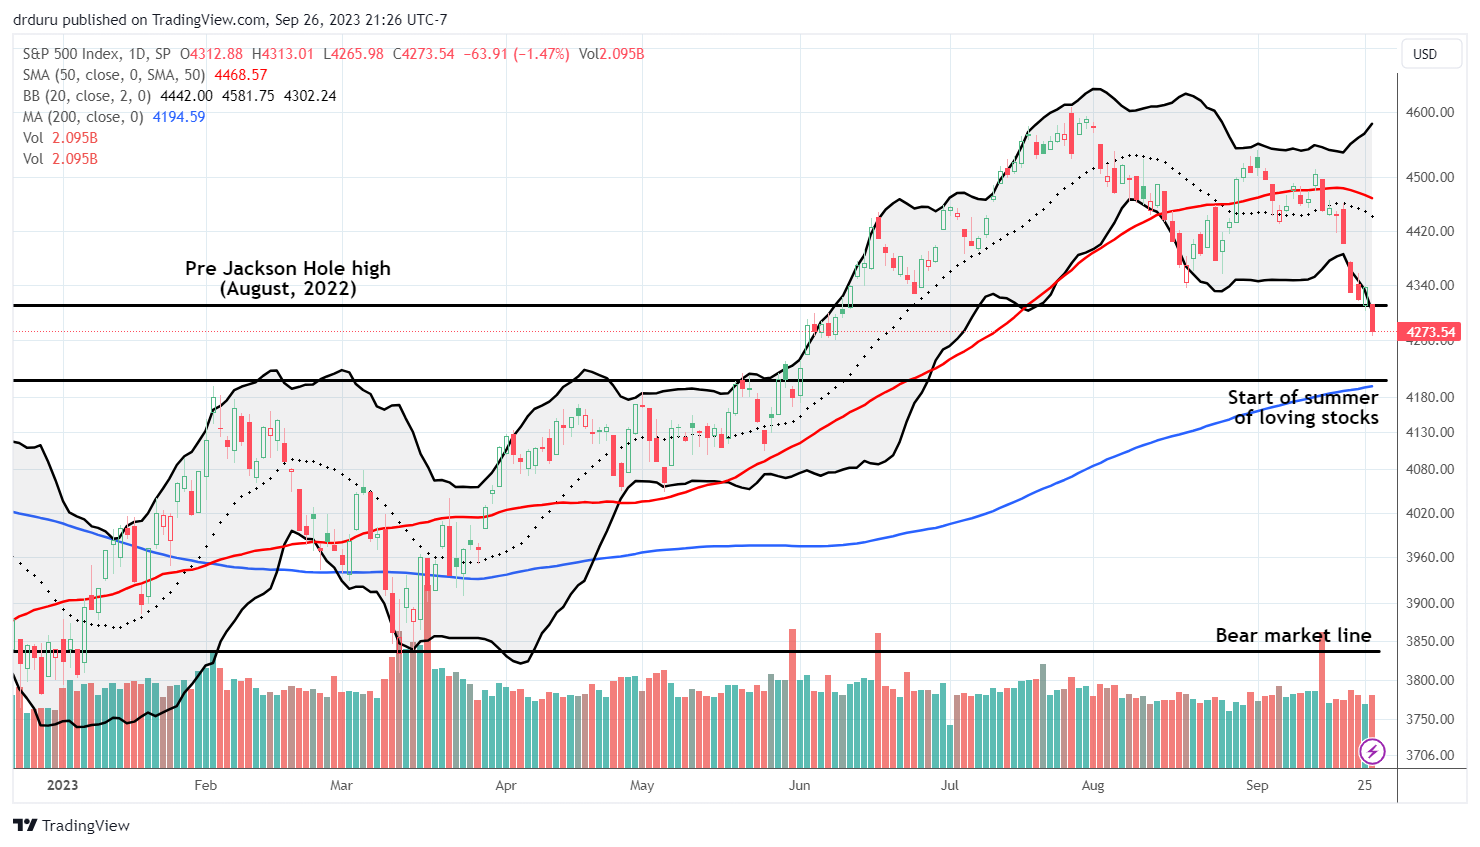
The NASDAQ (COMPQ) is in a more precarious position than its more diversified cousin. Unlike the March drawdown, in September’s drawdown the tech-laden index failed to defend its pre Jackson Hole support from last year. This time around support failed as the NASDAQ lost 1.6% on the day. Ominously, the NASDAQ’s bear market line now waits on the sellers to throw just a few more punches over hard.
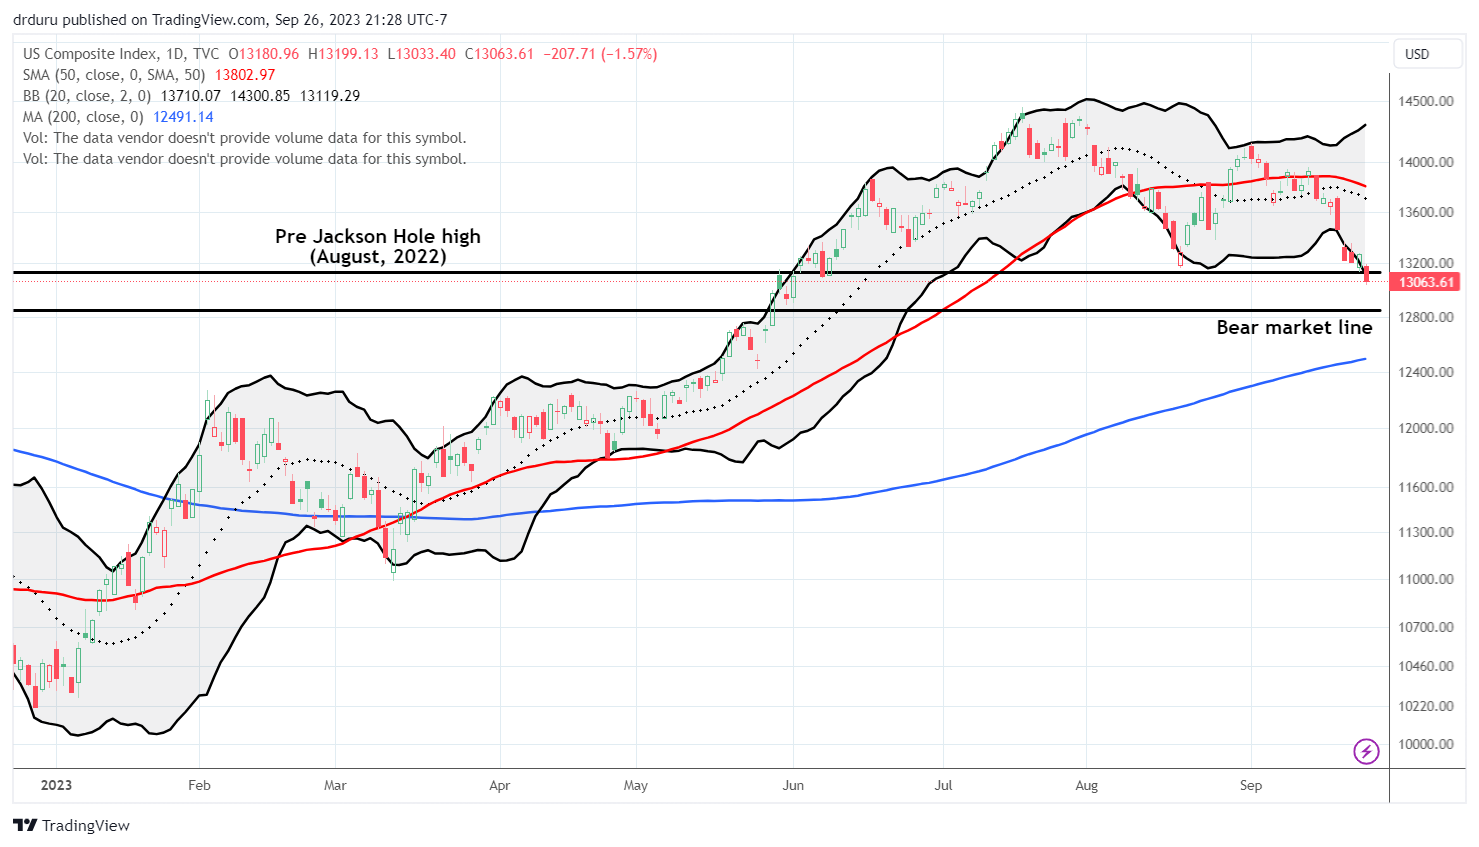
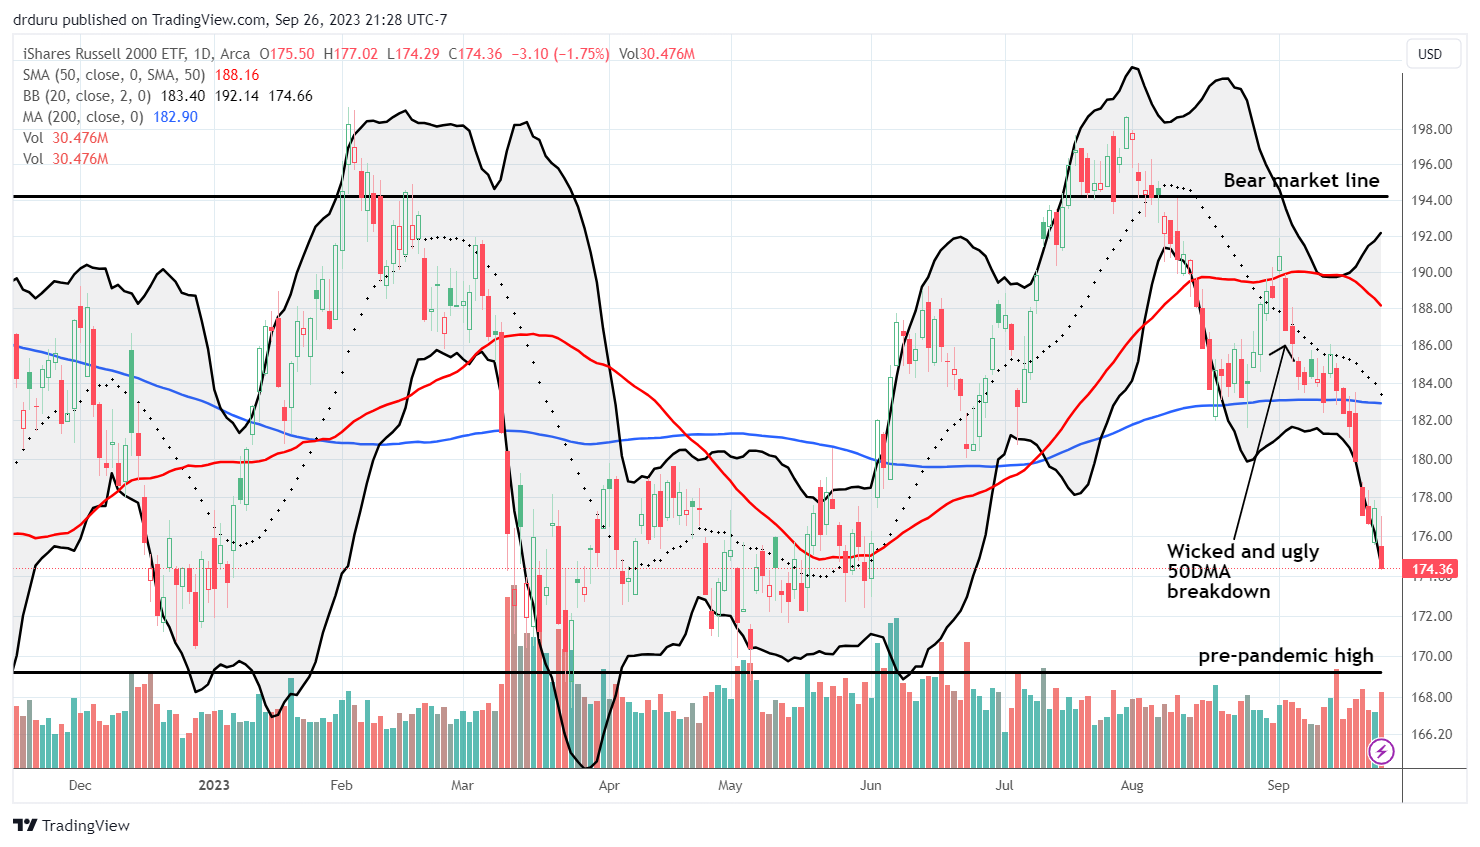
The iShares Russell 2000 ETF (IWM) is truly over hard. The ETF of small caps has sold its way into a flat year-to-date (YTD) performance. Poetically, IWM closed exactly where it closed at the end of 2022. Further selling will easily take IWM back to critical support from its pre-pandemic high.
The Short-Term Trading Call While Over Hard
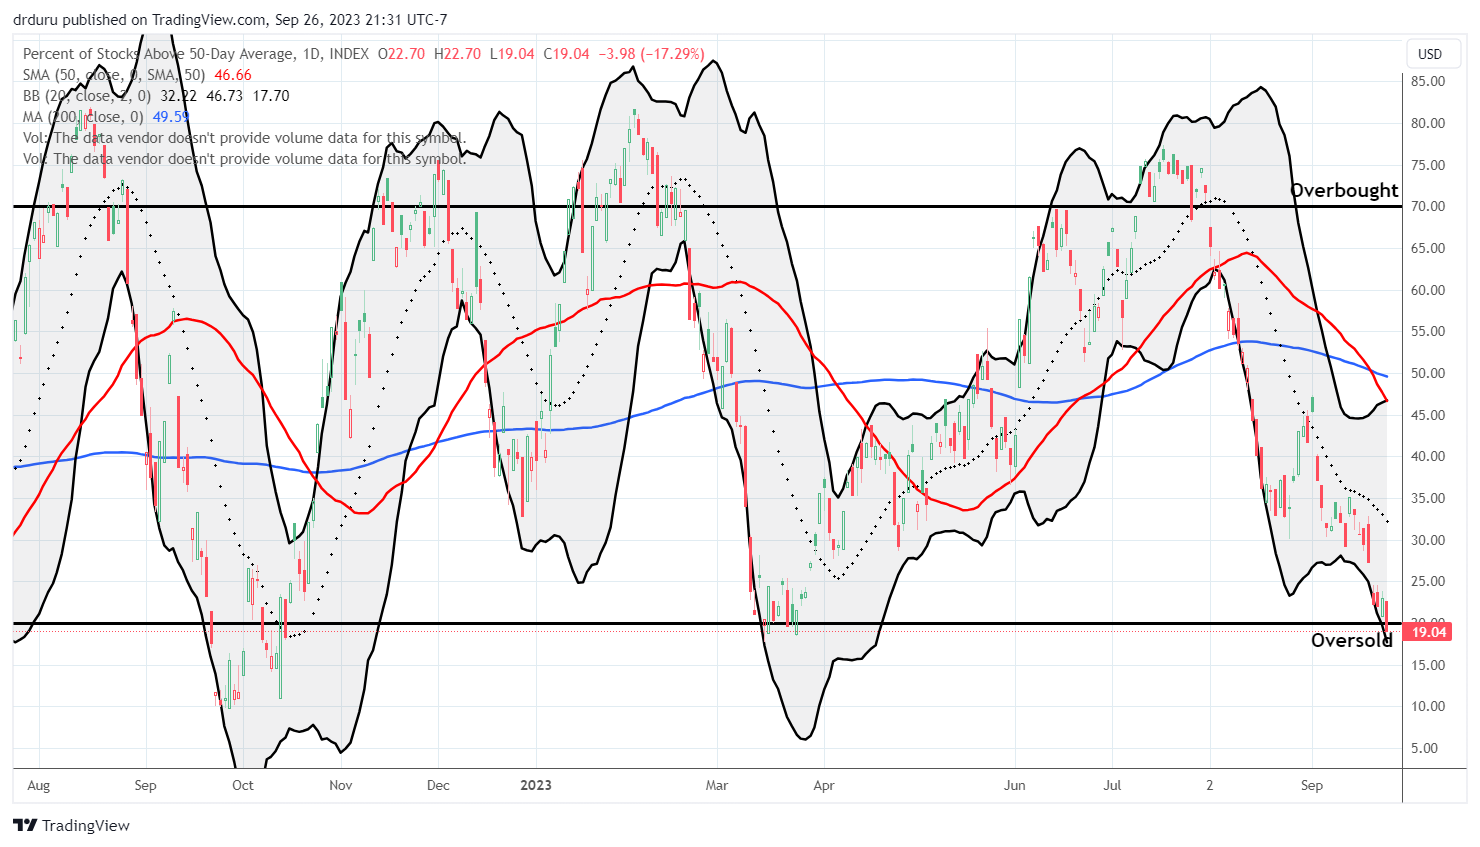
- AT50 (MMFI) = 19.0% of stocks are trading above their respective 50-day moving averages (first day oversold)
- AT200 (MMTH) = 35.2% of stocks are trading above their respective 200-day moving averages
- Short-term Trading Call: bullish
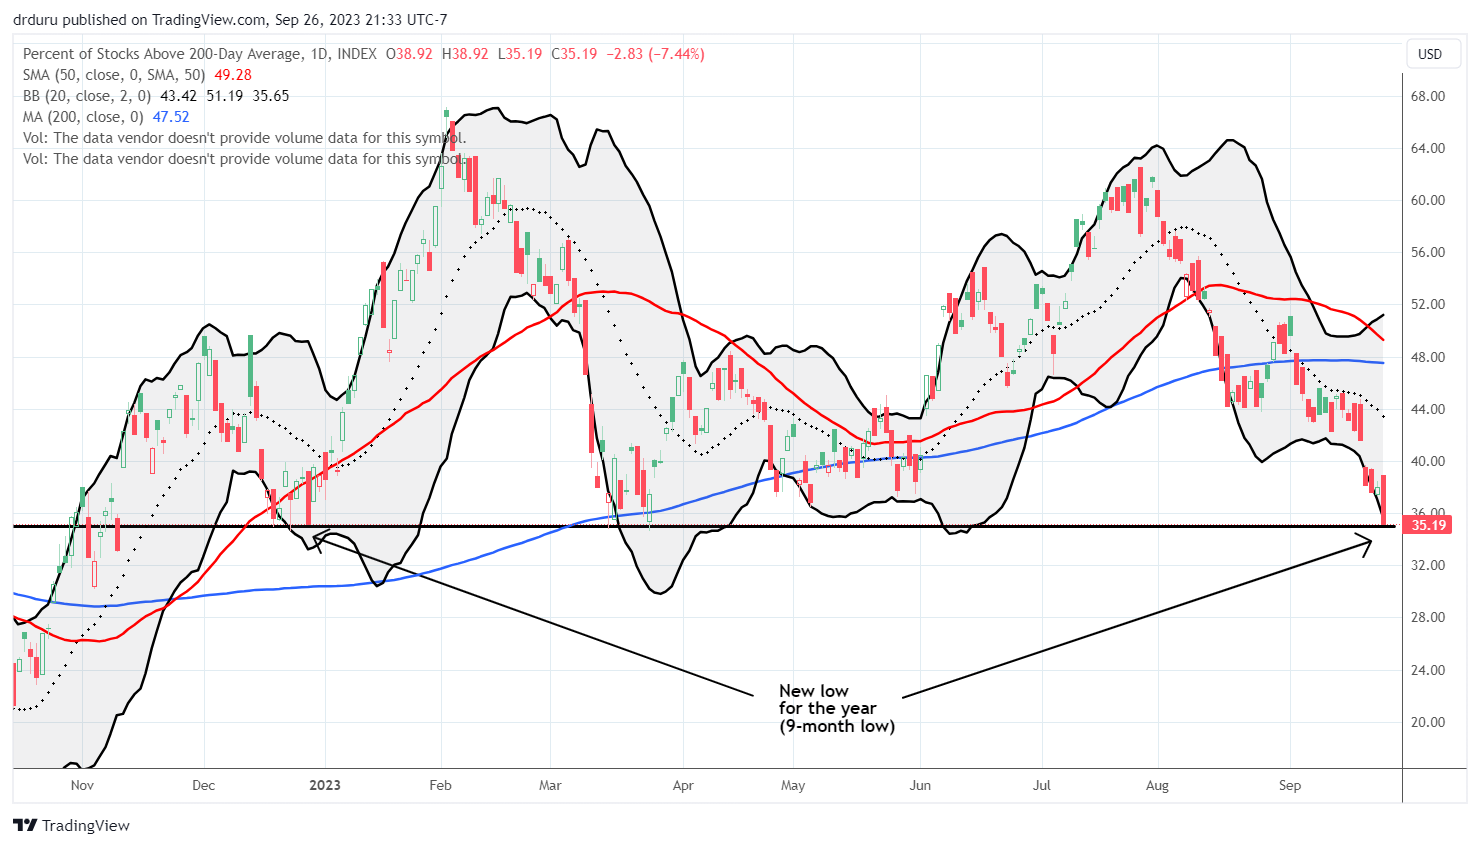
AT50 (MMFI), the percentage of stocks trading above their respective 50DMAs, fell over hard into oversold trading conditions for the first time since the March lows. My favorite technical indicator closed at 19.0%, below the 20% oversold threshold. While the S&P 500 index remains well above those lows, the longer term indicator AT200 (MMTH), the percentage of stocks trading above their respective 200DMAs, exposes the underlying weakness of the market. Incredibly, AT200 is at its lowest close of the year and back to a level it last saw in late December. In other words, the vast majority of stocks “feel” as bad as they did at the end of last year’s gut-wrenching bear market run. This sharp divergence from the S&P 500 presents a bad sign for the sustainability of the coming short-term oversold bounces. Sellers and shorts will likely be quick to pounce on rallies.
Yet, with all the negative catalysts pressing against the stock market, I got MORE bullish with my short-term trading call. Over the years, I have simply learned not to question the inevitability of the oversold bounce. The rebound may not come when I want it to come. I may not be able to explain why or how it will come. But the rebound doth come. The game is now to manage risk and meter trades. I do not want to get distracted from profiting from the bounce whenever it happens.
As I explained in the last Market Breadth post, I started early on oversold trading by picking out a few stocks clinging to 50DMA support (the red line in the stock charts). With oversold trading official, I now kick my trading rules into gear.
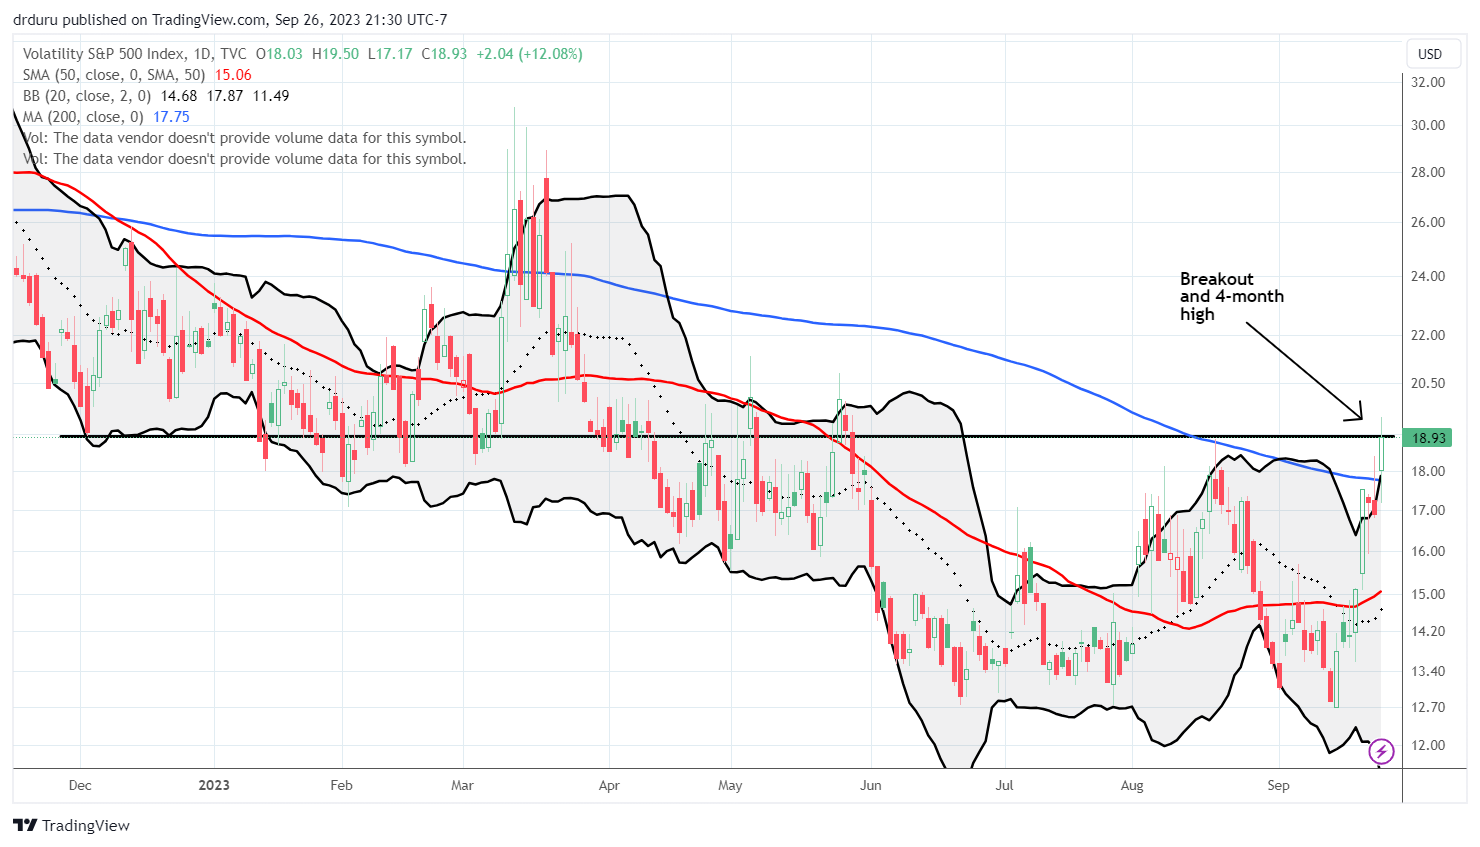
An old friend, the volatility index (VIX), has returned to action just in time to provide guidance and support the trading rules. The VIX is actually acting as I would hope it to act. Fear is spreading fast in the market with the VIX breaking out to a 4-month high. This fear helps to grease the gears for an eventual oversold bounce. At the moment, I even want the VIX to surge even higher above its upper BB. Such a condition would wind the coil of oversold tension to extreme levels.
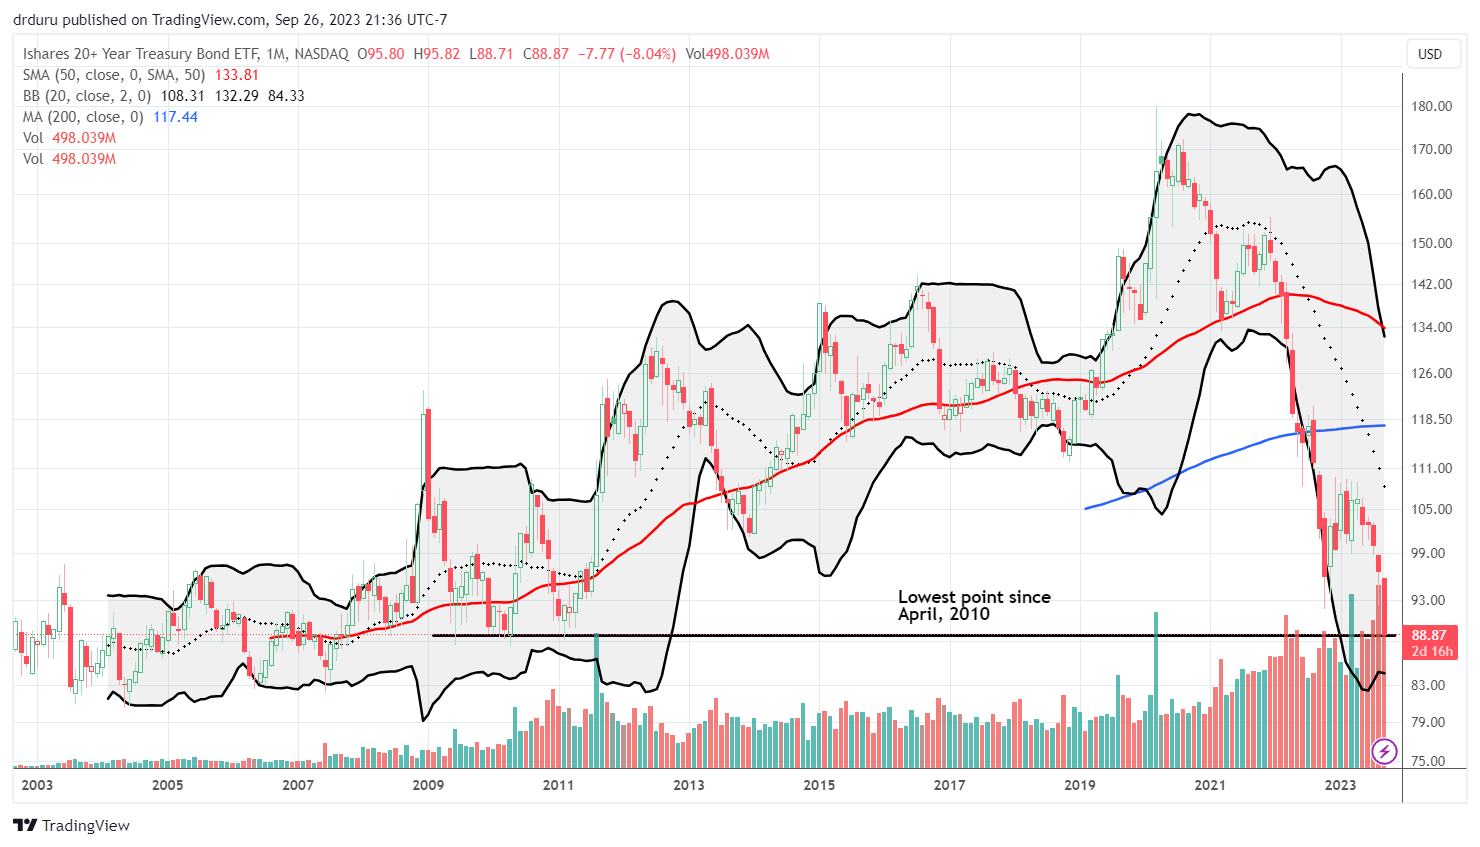
When the last threat of a government shutdown ended in a false peace, I pointed out a potential trade shorting the iShares 20+ Year Treasury Bond ETF (TLT) given the government’s massive funding needs. On a daily basis the trade seemed to unfold slowly. TLT is down an eye-watering 8.0% this month and is creating a major drag on the stock market. Unfortunately, my last trade in TLT put spreads was a few weeks ago. I just never imagined that TLT’s downfall could accelerate to these multi-year lows. TLT was last this low in the early aftermath of the financial crisis. Since the fallout from this surge in rates may be in its early stages, I will likely be quick to take profits in oversold bounces.
The monthly view below shows how TLT fell off a cliff after the Fed stopped artificially propping up bond prices in the wake of the pandemic. Volume in TLT has also surged. Bond sellers have moved over hard on bonds (even as liquidity in the underlying bond market purportedly dries up).
Be careful out there!
Footnotes
Subscribe for free to get email notifications of future posts!
“Above the 50” (AT50) uses the percentage of stocks trading above their respective 50-day moving averages (DMAs) to measure breadth in the stock market. Breadth defines the distribution of participation in a rally or sell-off. As a result, AT50 identifies extremes in market sentiment that are likely to reverse. Above the 50 is my alternative name for “MMFI” which is a symbol TradingView.com and other chart vendors use for this breadth indicator. Learn more about AT50 on my Market Breadth Resource Page. AT200, or MMTH, measures the percentage of stocks trading above their respective 200DMAs.
Active AT50 (MMFI) periods: Day #1 under 20% (oversold period ending 94 days over 20%), Day #6 under 30%, Day #16 under 40%, Day #30 under 50%, Day #35 under 60%, Day #38 under 70%
Source for charts unless otherwise noted: TradingView.com
Full disclosure: long IWM calls, long S&P 500 call spread and call, long VXX put options
FOLLOW Dr. Duru’s commentary on financial markets via StockTwits, Twitter, and even Instagram!
*Charting notes: Stock prices are not adjusted for dividends. Candlestick charts use hollow bodies: open candles indicate a close higher than the open, filled candles indicate an open higher than the close.


