Stock Market Commentary
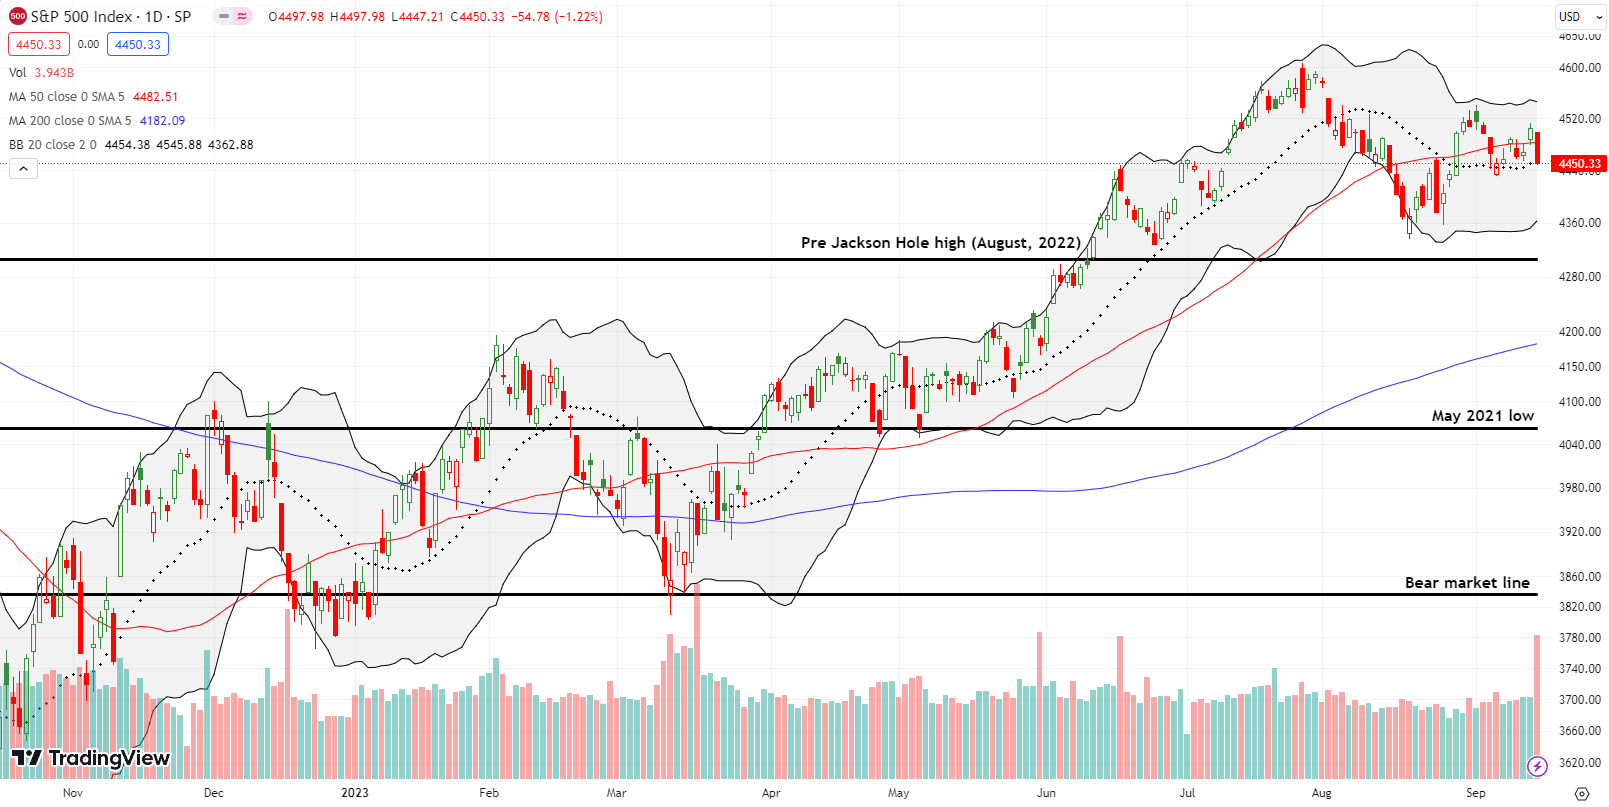
Last week was a time to avoid staring too hard at the day-to-day pricing action. The major indices were pretty much locked into a stalemate. Two breakouts were followed by two breakdowns. From a wider perspective, a stalemate has effectively been in place since mid-August. Despite my expectations, last month’s Jackson hole confab did not spark a major turning point, up or down, in the stock market. However, it is notable that the indices bottomed out following Jackson Hole.
For a brief moment, midweek, the trading action seemed ready to meet my expectations for a drop into oversold conditions. But, just as sharply as the market dropped, it rebounded.
The market yawned at last week’s inflation data as it remained consistent with the on-going softening. The market also yawned at a looming, historic strike in the U.S. auto industry. Greater attention seemed to go to the interest rate environment. Rates went higher again over the week (I did not have a new short TLT trade). Friday’s triple-witching in the options and futures market resolved into major, high-volume selling pressure. Accordingly, I fully expect some relief buying on Monday which should next resolve into more stalemate trading. I even suspect the stock market will release a collective yawn after Fed Chair Jerome Powell delivers the latest on monetary policy….unless the bond market (surprisingly) reacts strongly to something.
The Stock Market Indices
The S&P 500 (SPY) broke out above its 50-day moving average (DMA) (the red line in the chart below) twice during the week. Thursday’s 0.8% gain looked the most convincing. Yet, sellers were able to pressure the index back below the 50DMA. Friday’s 1.2% setback looked even more convincing than Thursday’s burst higher. The resulting stalemate produced a pivot around the 50DMA for the week with the 20DMA (the dashed line) playing a supporting role. Panning back, I can see the S&P 500 in a larger pivot around the 50DMA thanks to the bottoming action last month.
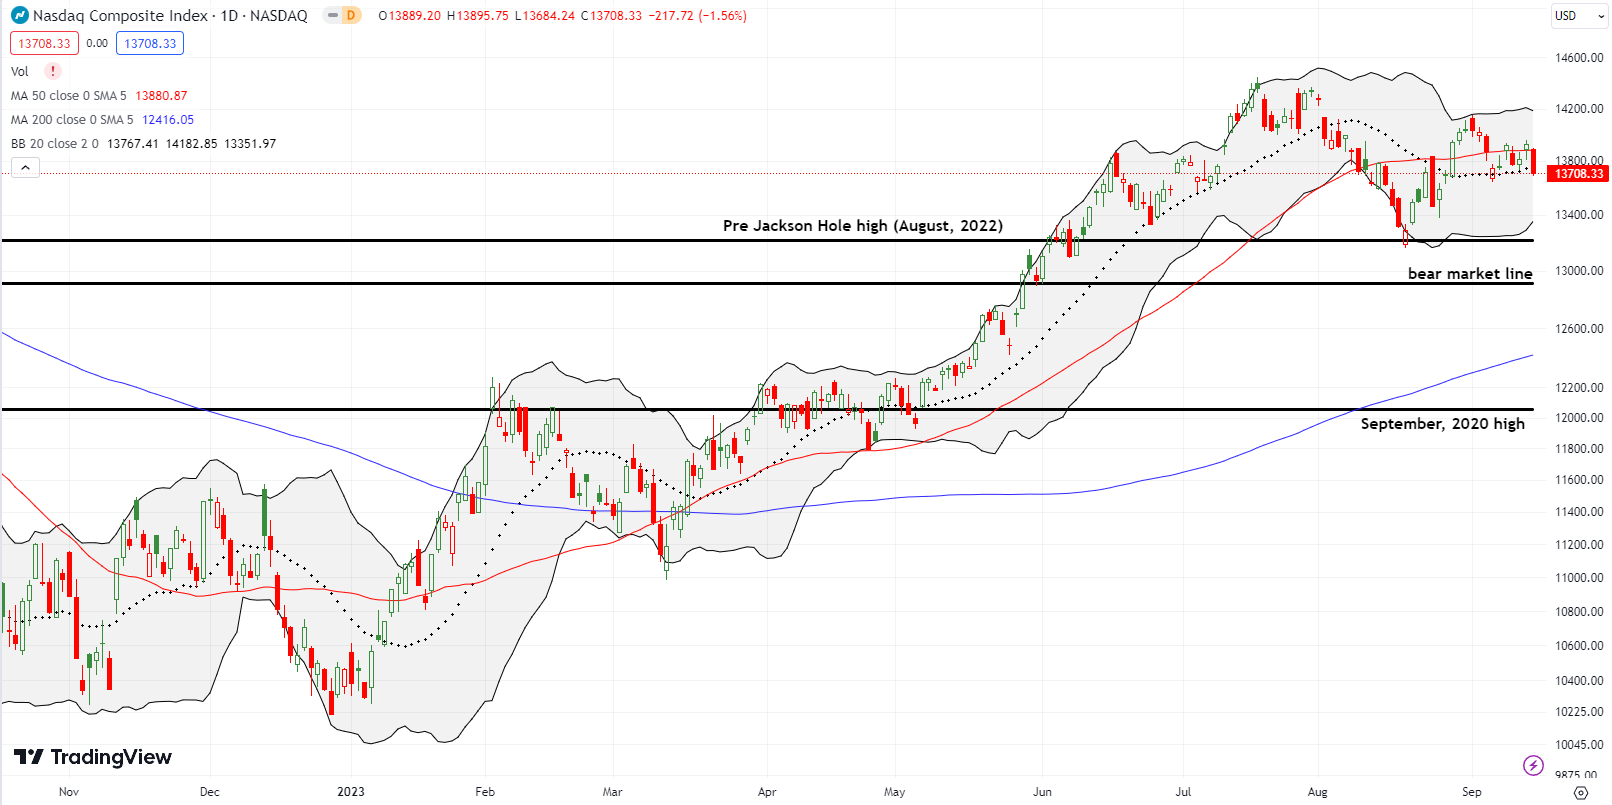
The NASDAQ (COMPQ) had less dramatic breakouts and breakdowns than the S&P 500. The resulting stalemate still looks quite familiar. The pivoting going back into August is also similar to the S&P 500’s behavior. The NASDAQ’s stalemate is actually impressive given the big breakdown in Apple (AAPL). Last week’s big product event failed to revive interest in AAPL; the stock even lost 1.7% on the day.
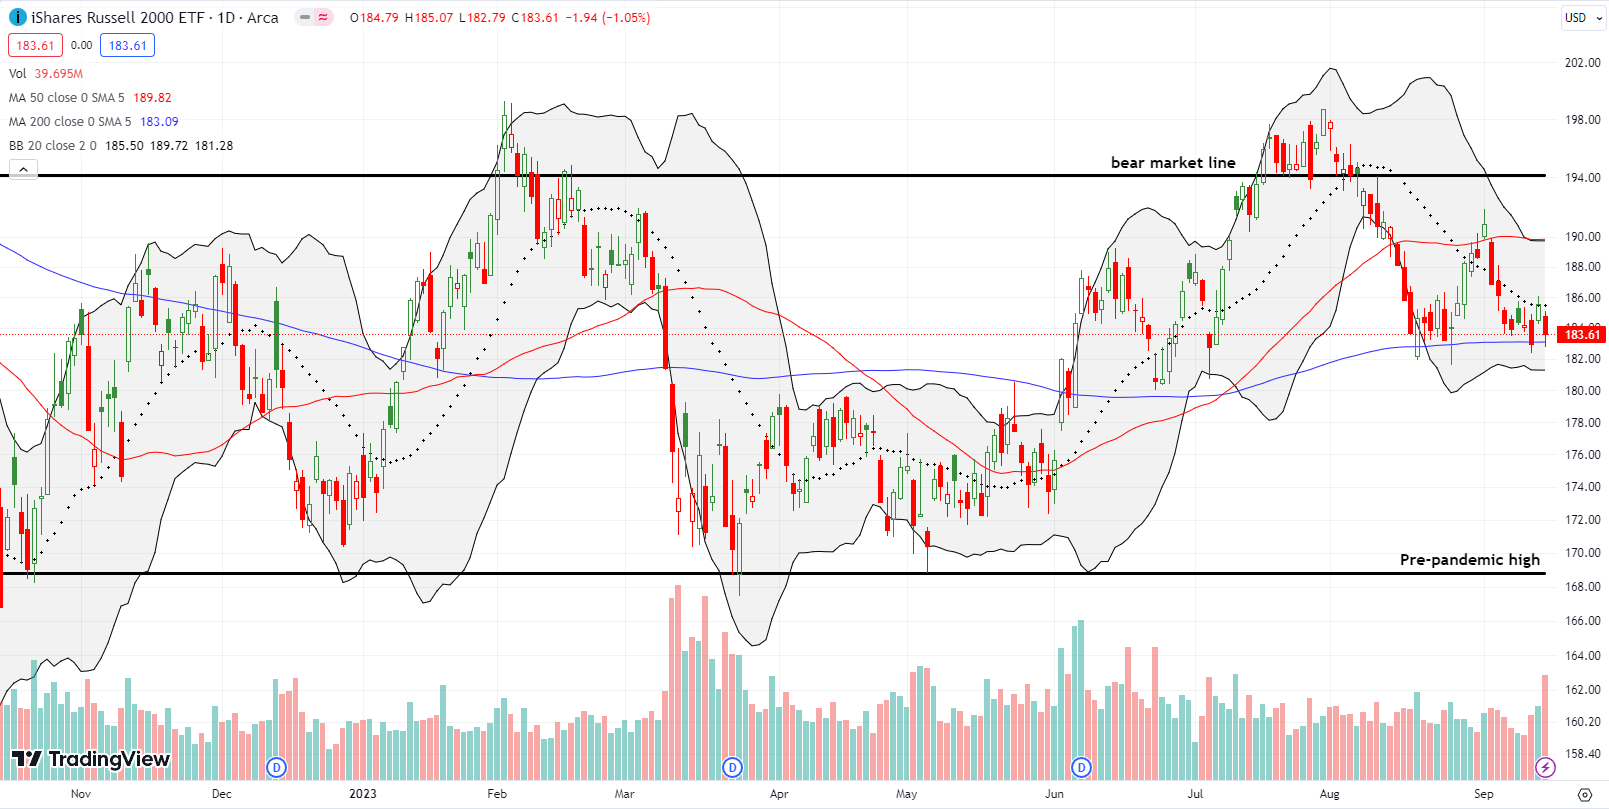
The iShares Russell 2000 ETF (IWM) is in a stalemate with its 200DMA support (the blue line). Unfortunately for the ETF of small caps, the 20DMA served as resistance all week. I was very fortunate in my last IWM trade by leveraging the current pattern. I added to my IWM call when IWM punched at 200DMA support on Wednesday. When IWM hit resistance at its 20DMA the next day, I immediately took profits. I reloaded on Friday’s test of support….
The Short-Term Trading Call with A Stalemate
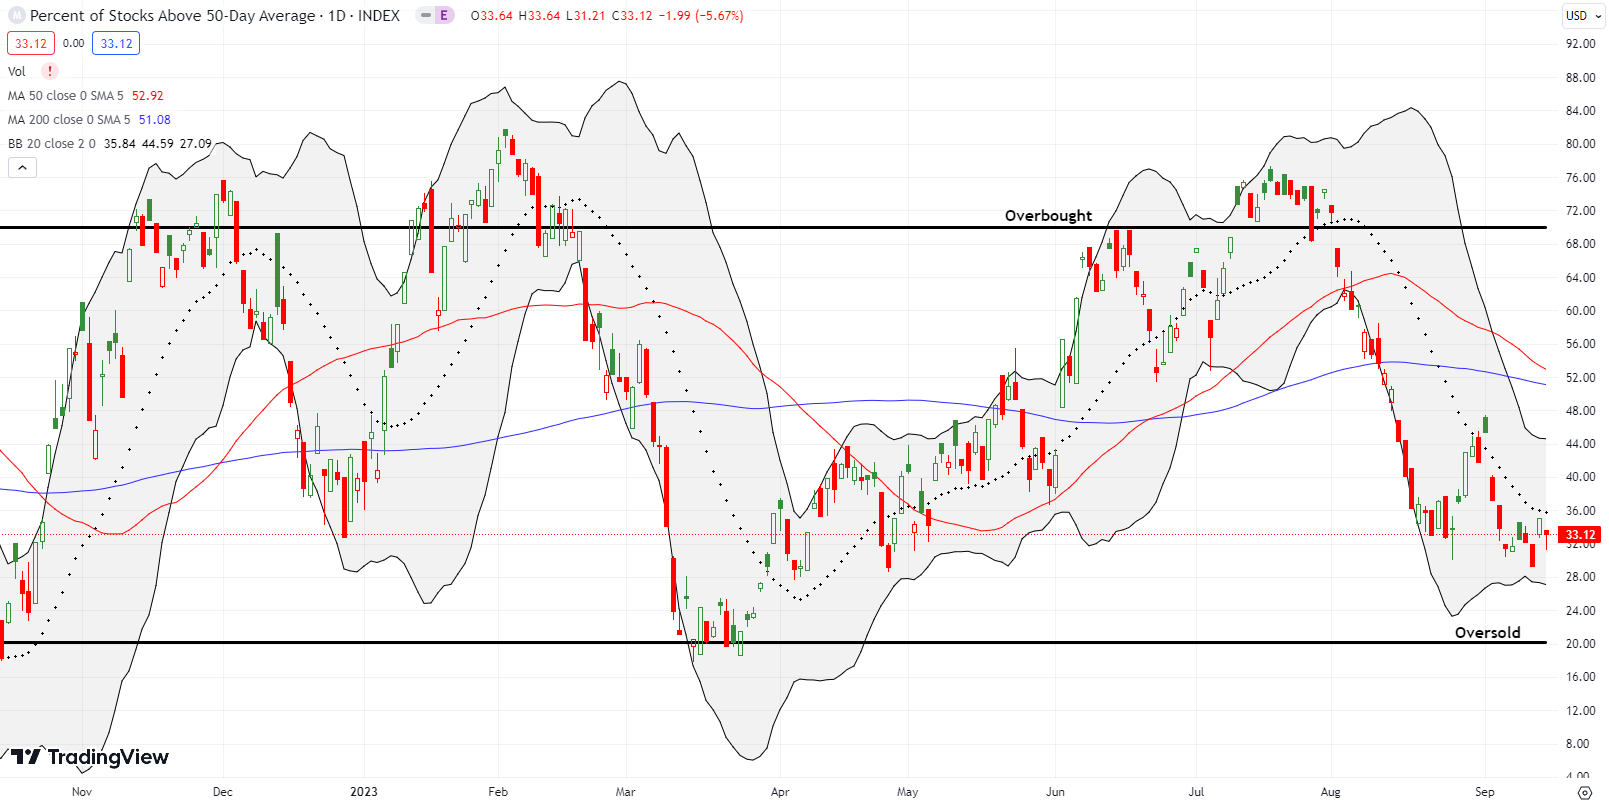
- AT50 (MMFI) = 33.1% of stocks are trading above their respective 50-day moving averages
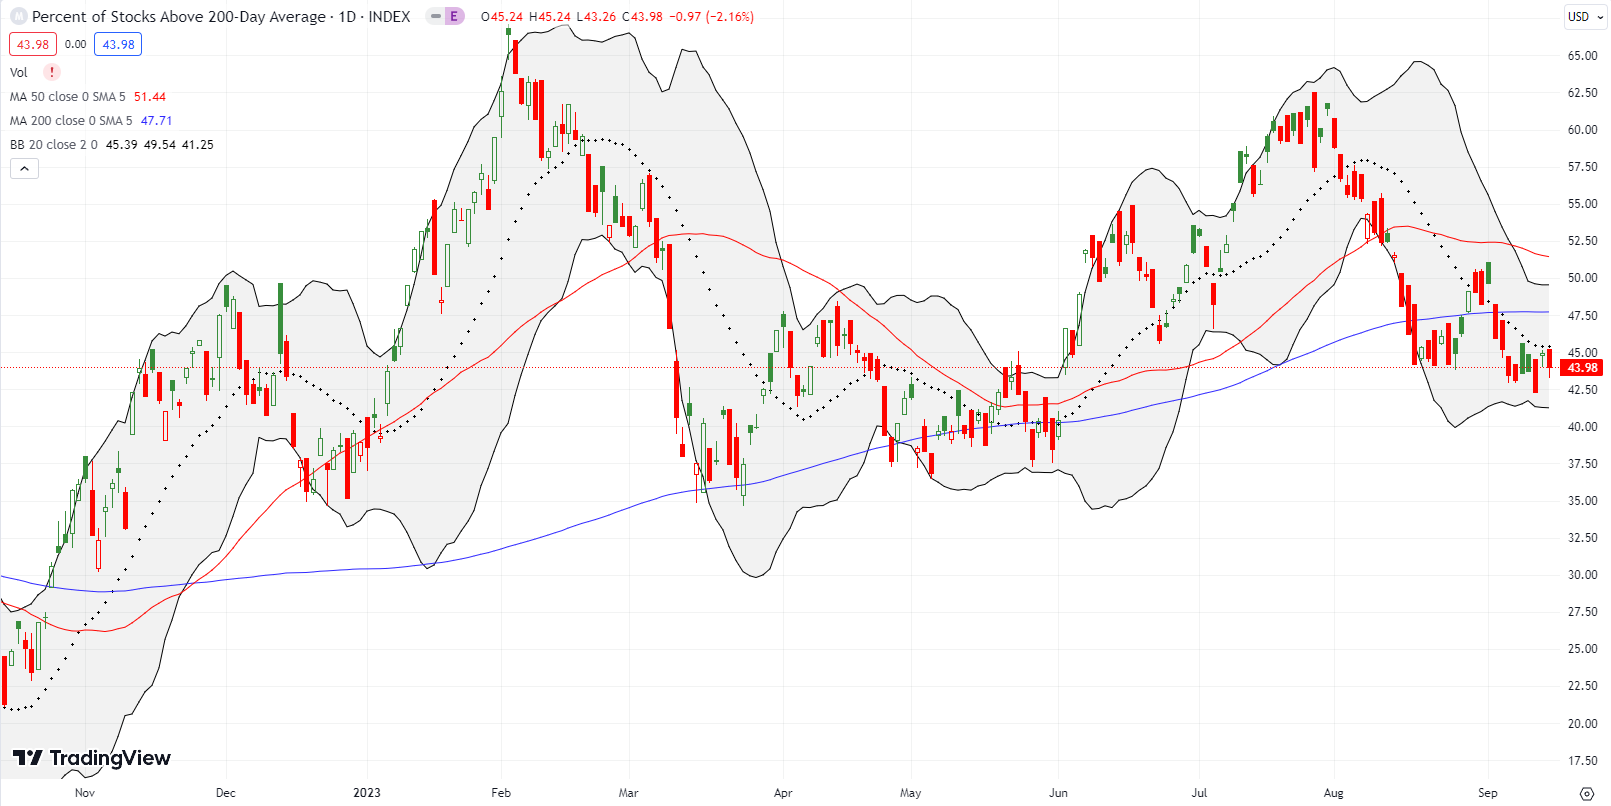
- AT200 (MMTH) = 44.0% of stocks are trading above their respective 200-day moving averages
- Short-term Trading Call: neutral
AT50 (MMFI), the percentage of stocks trading above their respective 50DMAs, closed the week at 33.1%. On Wednesday, my favorite technical indicator closed at 29.3%. Small caps led the way on that decline as the S&P 500 closed with a fractional gain. While I bought more IWM call options, I braced myself for a continuation downward toward oversold trading conditions. The stalemate reasserted itself and prevented a further decline. I cannot say a bearish divergence still exists, but I remain wary of an eventual drop to oversold in coming weeks. In the meantime, the stalemate keeps my short-term trading call locked firmly into neutral.
The consumer discretionary sector has been “quietly” selling off in the background of the market action. It finally came fully to my attention a week and a half ago. Of course the burn has slowed down since then.
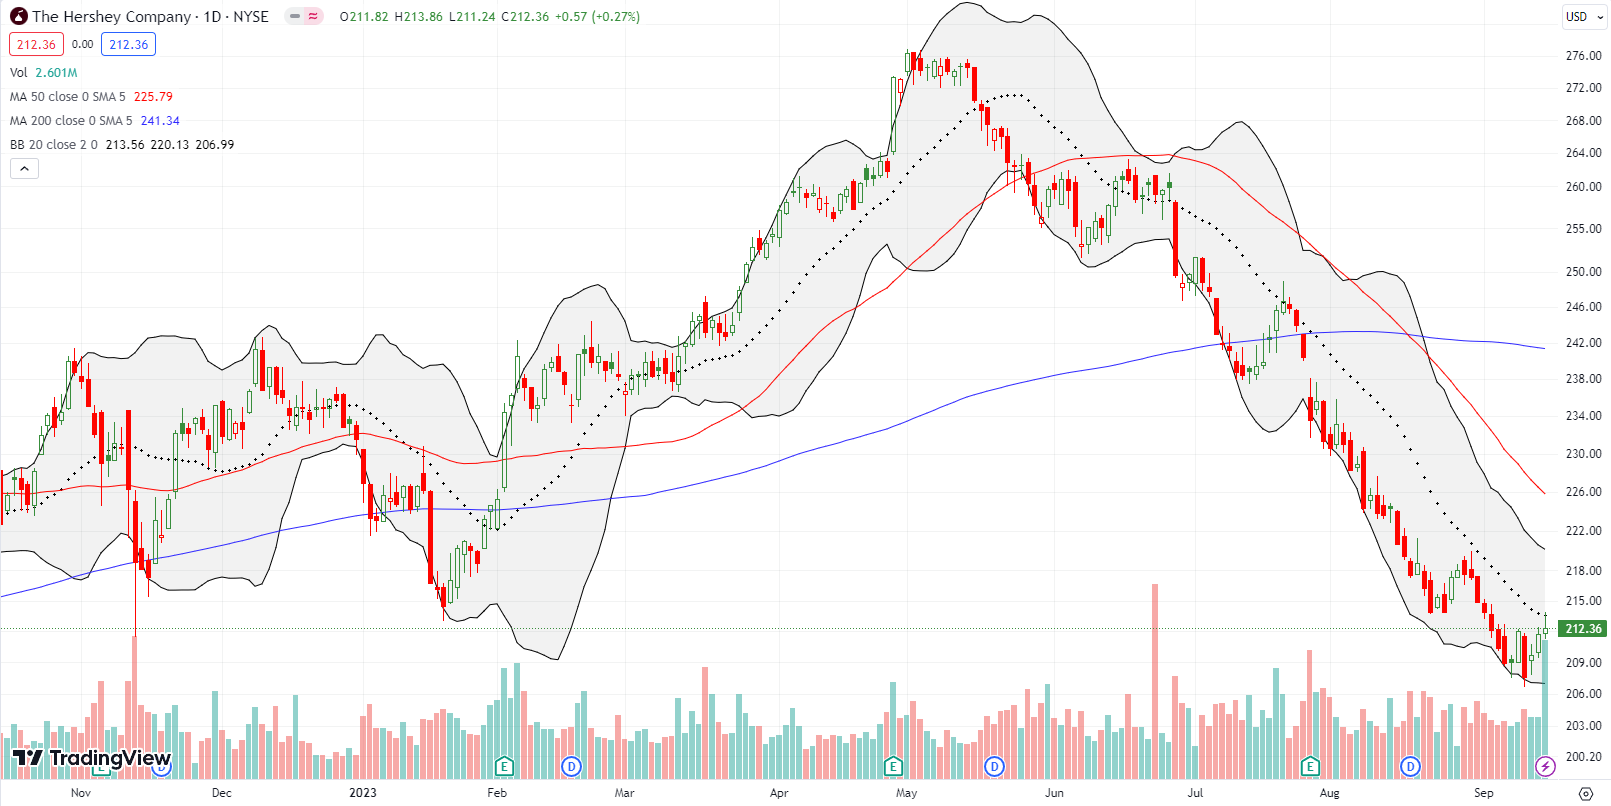
The Hershey Company (HSY) is an example of a stalwart consumer discretionary stock that has experienced consistent pressure since the summer. HSY hit an all-time high in early May and gave way to profit-taking from there. A declining 20DMA has guided the stock downward most of the way. Buyers returned to HSY after it hit a 15-month low. Since I love chocolate, I dare not try the obvious trade: a fade at 20DMA resistance; I cannot implement trades that cause psychological conflict. If HSY closes ABOVE resistance, I will try for a swing trade back to the last high or 50DMA resistance.
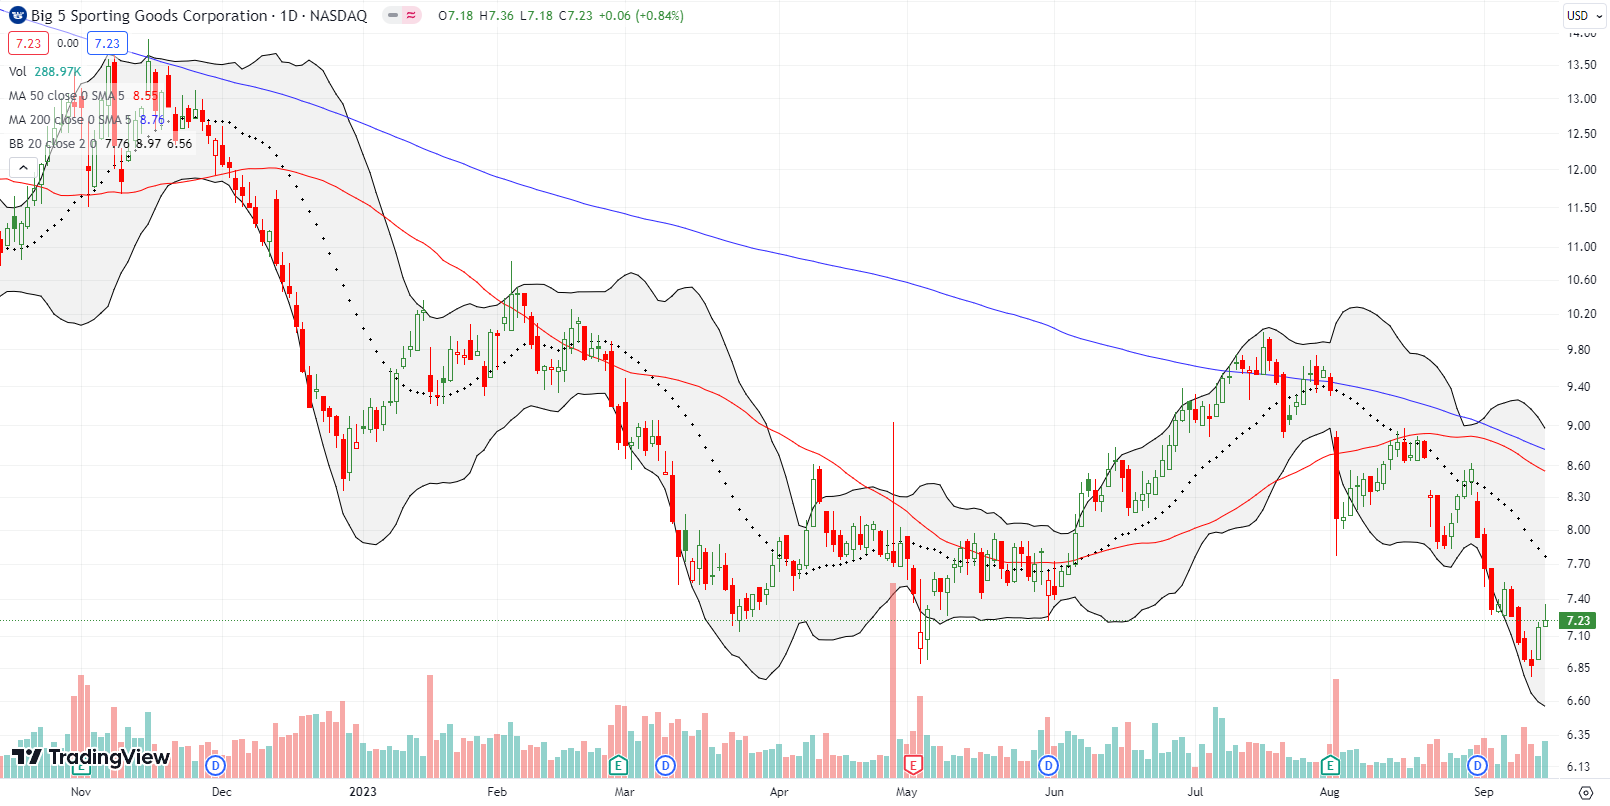
Sporting goods and recreational stocks have fallen from favor since they were all the rage during the depths of the COVID-19 pandemic. Big 5 Sporting Goods Corporation (BGFV) came into my radar after my wife had to take my son to the store upon discovering the local Dick’s Sporting Goods (DKS) had closed down (supposedly due to the burden of theft). I checked out BGFV just in time to see it locked into a stalemate with its low of the year which in turn is around a 3-year low. I do not see an immediate trade here, but I will check in on the stock as a short if it breaks to new lows or it hits resistance at the converging 50DMA and 200DMA (a much better risk/reward at that point).
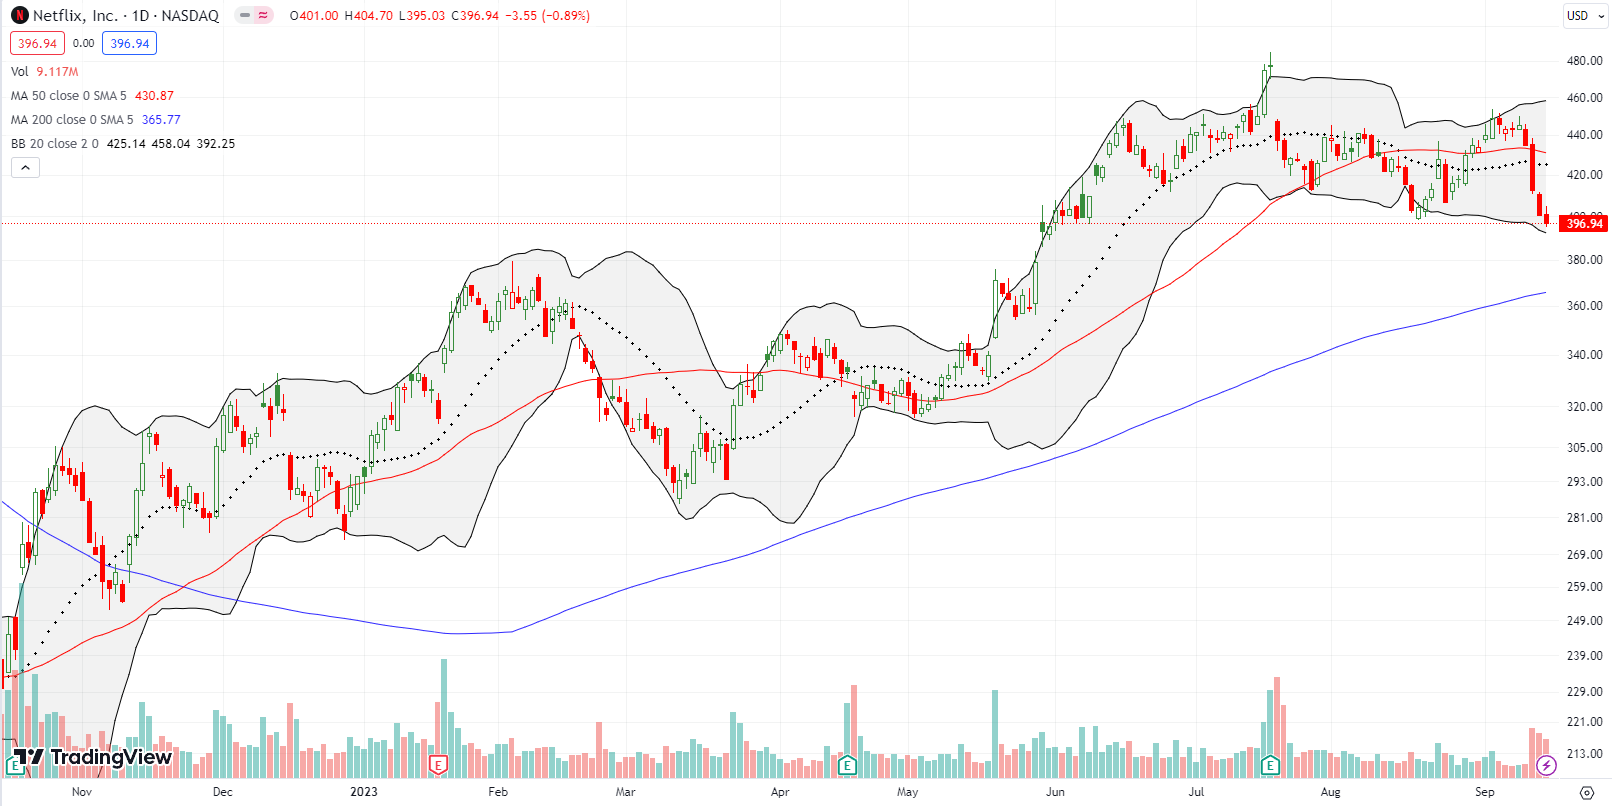
I never understood the excitement about Netflix (NFLX) “conceding defeat” to a cheap, ad-supported tier of service. Last week, NFLX’s CFO reported that after nearly a year of launching the service, results are not yet adding material revenues. The disappointing news took NFLX down 5.2% and sellers kept up the pressure into the end of the week. The chart pattern now looks toppy. A key test will come when (if?) NFLX its 200DMA support.
Be careful out there!
Footnotes
Subscribe for free to get email notifications of future posts!
“Above the 50” (AT50) uses the percentage of stocks trading above their respective 50-day moving averages (DMAs) to measure breadth in the stock market. Breadth defines the distribution of participation in a rally or sell-off. As a result, AT50 identifies extremes in market sentiment that are likely to reverse. Above the 50 is my alternative name for “MMFI” which is a symbol TradingView.com and other chart vendors use for this breadth indicator. Learn more about AT50 on my Market Breadth Resource Page. AT200, or MMTH, measures the percentage of stocks trading above their respective 200DMAs.
Active AT50 (MMFI) periods: Day #88 over 20%, Day #2 over 30%, Day #9 under 40%, Day #23 under 50%, Day #28 under 60%, Day #31 under 70%
Source for charts unless otherwise noted: TradingView.com
Full disclosure: long IWM call,
FOLLOW Dr. Duru’s commentary on financial markets via StockTwits, Twitter, and even Instagram!
*Charting notes: Stock prices are not adjusted for dividends. Candlestick charts use hollow bodies: open candles indicate a close higher than the open, filled candles indicate an open higher than the close.


Regarding AAPL: it usually sells off on new product announcements, for a simple reason (IMO): the reality can never meet the pre-announcement hype generated by rumor-mongers grasping for eyeballs.
I hear you about psychological conflict on trades related to chocolate. My own bugaboo is clean energy.
The expected post-news sell-off was worse for AAPL this time around because the selling started right from the open. I kept waiting for a pop to fade and one never came…