

Housing Market Intro and Summary
Real estate is local. Regional banks often sit at the heart of local communities. So it seems odd writing about the relative strength in the housing market in the wake of the Panic of 2023 that featured the historic collapse of two regional banks, Silicon Valley Bank (SIVB) and Signature Bank (SBNY). Yet, here we are. In my last Housing Market Review, I described the persisting uptrend in the stocks of home builders despite a fresh risk of higher mortgage rates. The rebound in mortgage rates stopped cold with the bank failures. This change provided fresh hope for home sales.
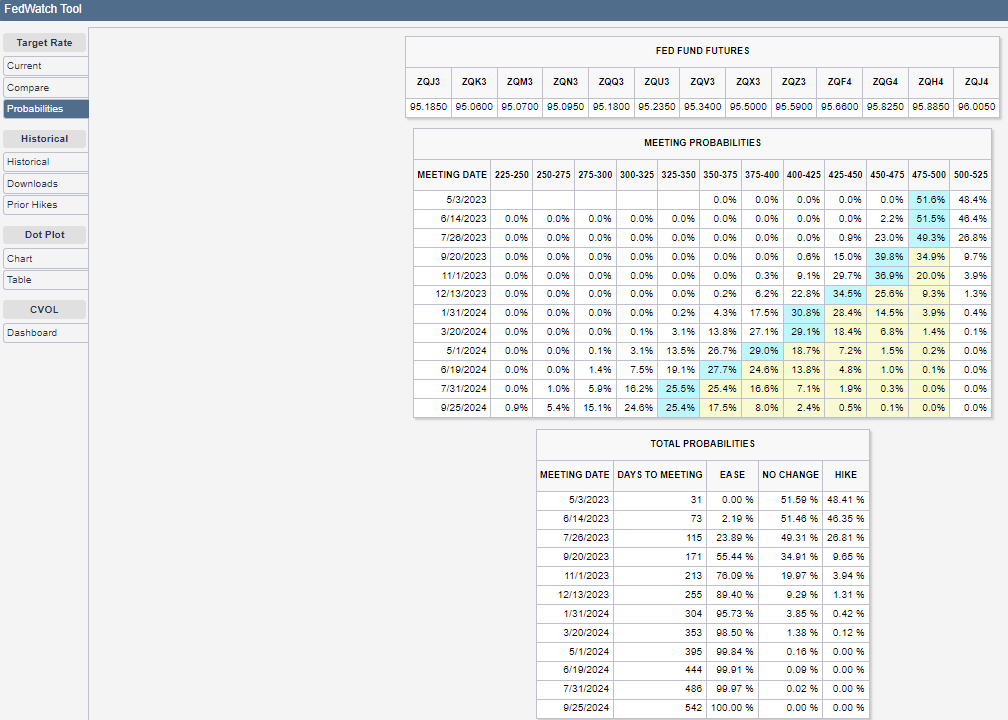
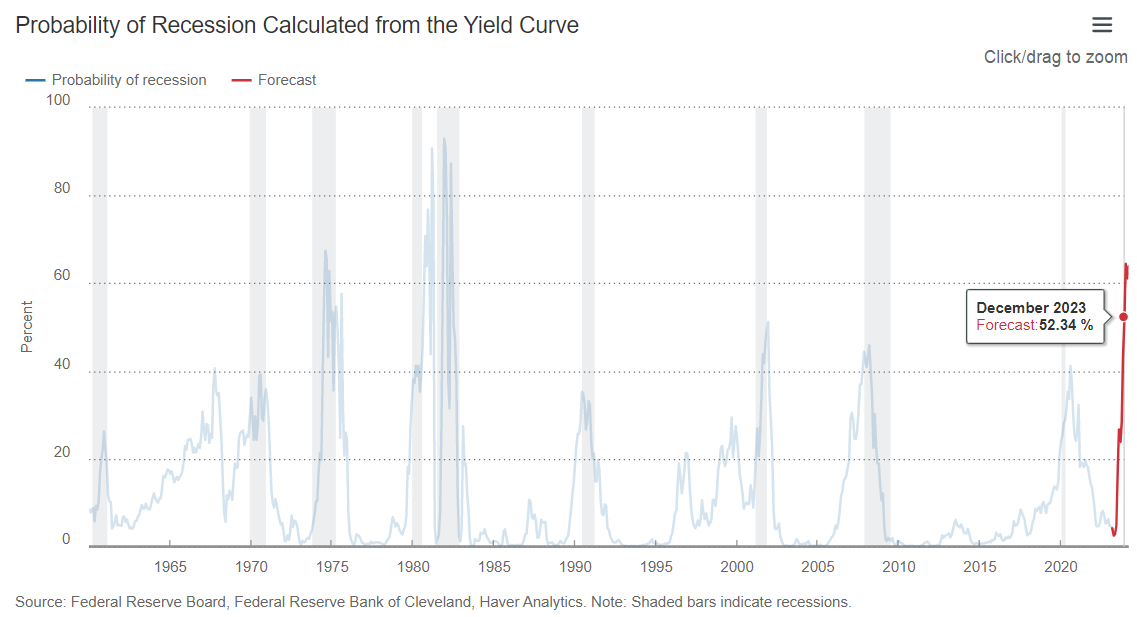
A rush to “safety” brought bond yields down and took mortgage rates along for the ride. Markets now expect the Fed to end its rate hikes and start cutting rates as soon as September of this year. In other words, the mortgage rate environment should improve going forward. One outstanding question is whether a recession, likely by the end of the year, will deliver a high enough obstacle to bring new troubles to the housing market.
Housing Stocks
The iShares US Home Construction ETF (ITB) continues to hold its uptrending 50-day moving average (DMA) as support. ITB barely skipped a beat through the Panic of 2023. ITB gained 3.9% for the month mainly thanks to a 2.8% surge on the last day of the month. This fresh move signals the next opportunity for the seasonal trade on homebuilders. For the rest of the spring selling season, I am treating ITB as a buy on the dips until it next closes twice below the 50DMA. Since ITB barely outperformed the S&P 500 (SPY) for the month (3.5%), I am assuming the seasonal outperformance is winding down.
")
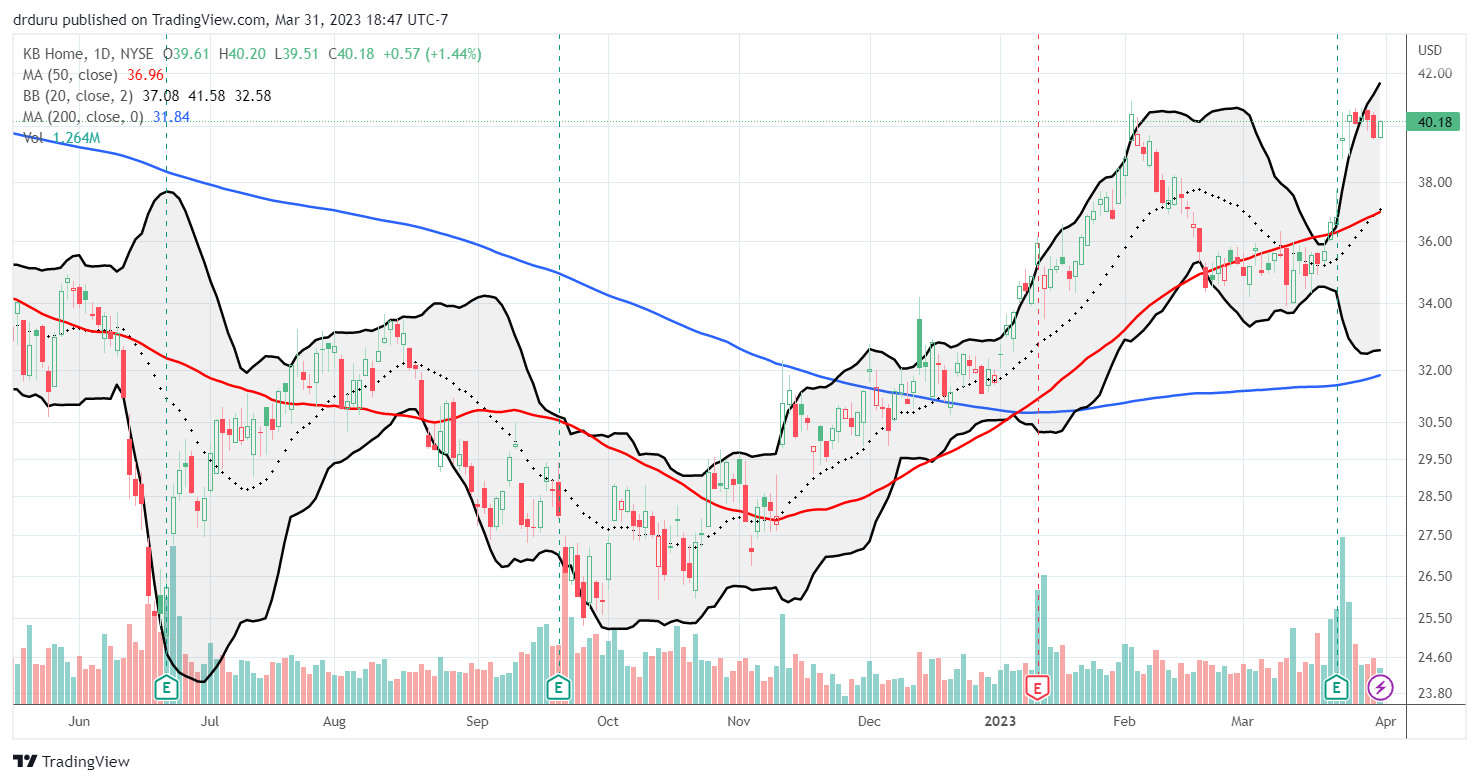
KB Home (KBH) pulled off a rare feat. The stock soared 7.5% post-earnings and led home builders generally upward. That surge finished reversing KBH’s losses from the February top. However, KBH ended the month struggling to break out to new highs. A breakout will serve as confirmation of a new cycle for the seasonal trade on home builders. I wrote about KBH earnings on Seeking Alpha: “KB Home: ‘Markets Are Starting To Normalize“.
Housing Data
New Residential Construction (Single-Family Housing Starts) – February, 2023
Housing starts increased 1.3% month-over-month to 830,000. Starts decreased 31.6% year-over-year. January’s starts were revised downward to 821,000. The 800K level is still hanging tough as support for starts. These starts look like they are waiting in limbo for the Spring selling season.
![US. Bureau of the Census, Privately Owned Housing Starts: 1-Unit Structures [HOUST1F], first retrieved from FRED, Federal Reserve Bank of St. Louis, March 19, 2023.](https://drduru.com/onetwentytwo/wp-content/uploads/2023/03/20230319_Housing-Starts.png "Housing starts")
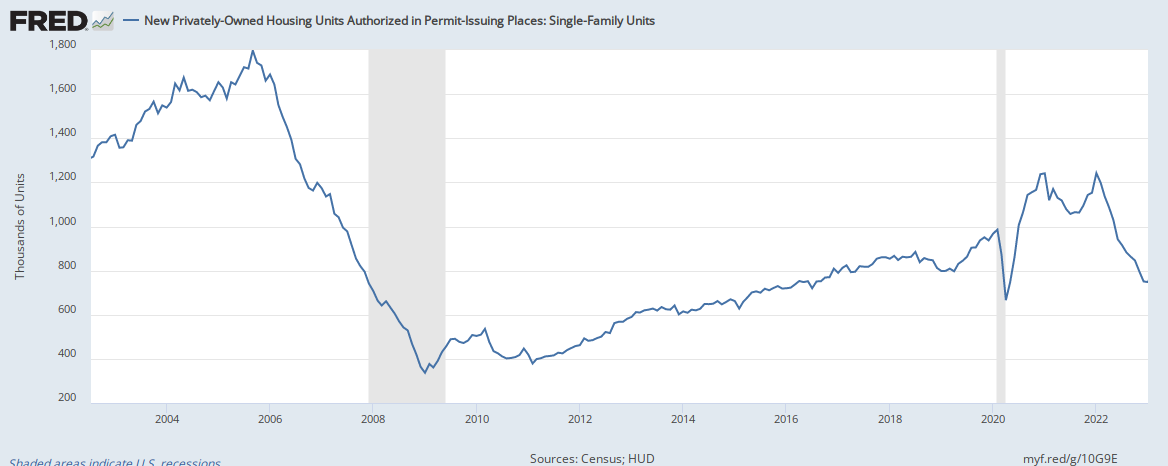
In the last Housing Market Review I warned that “the odds of holding the 800K support are getting lower and lower as permits continue a steep decline.” Just in time, permits increased month-over-month for the first time in a year. Suddenly, the 800K support for starts looks a little more firm!
Housing starts once again declined year-over-year in all four regions. The Northeast stood out with an unusual surge in starts in December. The Northeast region’s starts came plunging right back to earth in January and February. Housing starts in the Northeast, Midwest, South, and West each changed -11.3%, -42.0%, -25.3%, and -45.1% respectively year-over-year.
Existing Home Sales – February, 2023
The slow descent for sales of existing homes flattened out in January and outright launched higher in February.
Existing home sales finally stopped falling after 12 straight months of sequential declines. The seasonally adjusted annualized sales in February of 4.58M increased 14.5% month-over-month from the 4.00M in existing sales for January (unrevised). Year-over-year sales decreased 22.6%. The 8.2% jump in pending home sales in January turned out to be a telling sign of stronger sales in February. At the time I claimed that second straight monthly increase in pending home sales “should show sequential increases going into the Spring home selling season. Thus, sales for now look like they are stabilizing and bottoming out.” The spring selling season indeed looks like it will start on a strong foot. Pending existing home sales increased sequentially yet again in February.

(For historical data from 1999 to 2014, click here. For historical data from 2014 to 2018, click here) Source for chart: National Association of Realtors, Existing Home Sales© [EXHOSLUSM495S], retrieved from FRED, Federal Reserve Bank of St. Louis, March 28, 2022.

February’s absolute inventory level of 980K homes stayed flat with January and increased 15.3% year-over-year. According to the NAR, “unsold inventory sits at a 2.6-month supply at the current sales pace, down 10.3% from January but up from 1.7 months in February 2022.” Supply remains tight and the sequential decline likely represents a significant drawdown from the ramp in sales. In a confirmation of demand strength, the NAR noted that “multiple offers are returning on a good number of properties.”
Despite the sequential surge in sales, homes stayed on the market a little longer. It took an average of 34 days to sell a home in February, up from 33 days in January and up significantly from the 26 days in December and 18 days a year ago. The 57% of homes that sold within a month is up from the 54% in January. The sales cycle is finally showing signs of stabilization.
The surge in sales likely helped end the persistent month-over-month decline in prices. The median price of an existing home increased 0.5% month-over-month to $363,000 but decreased 0.2% year-over-year. The year-over-year decline was tiny, but the move ended a record streak of 131 straight months of year-over-year increases. The streak ended one month ahead of my predictions for a March or April inflection point.
Apparently the surge in sales came from experienced buyers. The share of sales to first-time home buyers dropped sharply from 31% in January to 27% in February. The share was also higher a year ago at 29%. The NAR’s 2017 Profile of Home Buyers and Sellers reported an average of 34% for 2017, 33% for 2018, 33% for 2019, 31% for 2020, 34% for 2021, and 26% for 2022. The first-time buyer share for 2022 is the lowest on record for the NAR, so the latest decrease could be a sign of share falling back to 2022 norms. I thought first-timers would be a key factor for stabilizing existing home sales.
All regions declined significantly in sales year-over-year. All regions participated in the large sequential gain in sales with the Northeast trailing far behind at 4.0%. The regional year-over-year changes were: Northeast -25.7%, Midwest -18.7%, South -21.3%, West -28.3%.
The regions were mixed in the pace of year-over-year price changes. The West was the first region to flip negative in January and worsened in February. The regional year-over-year price gains were as follows: Northeast -4.5%, Midwest +5.0%, South +2.7%, West -5.6%.
Single-family existing home sales increased 15.3% from January and declined on a yearly basis by 21.4%. Per the above graph, sales for existing single-family homes far outpaced condos and coops. The median price of $367,500 was down 0.7% year-over-year.
California Existing Home Sales – February, 2023
California existing single-family home sales improved on a sequential basis for the third straight month thanks to the lowest mortgage rates in 5 months (per the California Association of Realtors (C.A.R.)). The 17.6% surge from January outpaced the aggregated gains across the US in spite of severe weather conditions across the state. The C.A.R. soberly observed that “any decline in rates is not likely to be sustainable since inflation remains high, and the Federal Reserve is willing to take some calculated risks in order to keep inflation under control.” This prediction will likely get revised in the next report given the market’s change in expectations for monetary policy.
California sales of existing single-family homes increased to 284,010 in February. Year-over-year, sales still fell a whopping 33.2% – a 20th straight month of year-over-year declines in California. The C.A.R. expects “larger price drops moving through the spring home-buying season”. However, it also expects a bottom in prices later this year with stabilizing mortgage rates and “the availability of homes remaining extremely tight and housing supply conditions not expected to improve any time soon.” The month-over-month price on a square footage basis increased from $371 to $373 and fell from $392 a year ago. The sequential price movement suggests that February’s decline in median prices was due to a shift in mix to smaller homes. Indeed, the C.A.R. observed that “a shift toward more home sales in the lower-price segments is expected to continue to further soften home prices.”
The statewide sales-price-to-list-price ratio stayed below 100.0% for the seventh month in a row and still looks set to remain there for the duration of the housing market recession. This ratio increased sequentially for the second month in a row from 96.5% in January to 97.7% in February. The median time to sell a home in California surged from 28 days in December to 33 days in January. It fell back down to 28 days in February. The duration was just 9 days a year ago!
The monthly surge in sales helped push absolute inventory down to a 4-month low. The Unsold Inventory Index (UII) decreased from 3.6 in January to 3.2 in February. The UII was just 2.0 a year ago. C.A.R. again did not provide an aggregate change in active listings for the state. Forty-six of 51 counties experienced a year-over-year increase in active listings.
New Residential Sales (Single-Family) – February, 2023
The playbook for maintaining sales continues to work for home builders. New home sales have essentially stabilized since the summer, the longest stretch since the housing market reached its peak in August, 2020.
December new single-family home sales of 640,000 increased 1.1% from January’s 633,000 (revised significantly downward from 670,000), just below the August, 2022 peak at 642,000. Sales were still down 19.0% year-over-year. The key support at 550,000 in sales continues to hold.
![US. Bureau of the Census, New One Family Houses Sold: United States [HSN1F], first retrieved from FRED, Federal Reserve Bank of St. Louis, March 29, 2023.](https://drduru.com/onetwentytwo/wp-content/uploads/2023/03/20230329_New-Home-Sales.png "new home sales")
In the January housing market review, I declared price relief had finally started. That relief finally started this month. A significant shift in sales mix toward homes priced between $400,000 to 479,000 helped to push the median price up to $438,200.
![U.S. Census Bureau and U.S. Department of Housing and Urban Development, Median Sales Price for New Houses Sold in the United States [MSPNHSUS], retrieved from FRED, Federal Reserve Bank of St. Louis, March 29, 2023](https://drduru.com/onetwentytwo/wp-content/uploads/2023/03/20230329_Median-Sales-Price-New-Home-Sales.png "Median Sales Price for New Houses")
Inventory dropped slightly from 8.3 to 8.2 months of sales. The market is over-supplied given inventory sits above the 6.0 level that is the benchmark for a balanced market. THe market was perfectly balanced a year ago.
The Northwest took the lead from the West as the region with the worst year-over-year decline in sales. The Northeast, Midwest, South, and the West changed -55.3%, -20.2%, -8.8%, and -33.2% respectively. The South ended a brief streak of two consecutive, sizeable month-over-month sales increases.
Home Builder Confidence: The Housing Market Index – March, 2023
Builder sentiment continued to improve in March. However, the entire two point move came from a surge in sentiment in the South by 4 points. February’s HMI soared from 35 in January to 42 in February and progressed to 44 in March.
The National Association of Home Builders (NAHB) tempered its enthusiasm by pointing out two key constraints on the market for new homes:
“…40% of builders in our March HMI survey currently cite lot availability as poor. And a follow-on effect of the pressure on regional banks, as well as continued Fed tightening, will be further constraints for acquisition, development and construction (AD&C) loans for builders across the nation. When AD&C loan conditions are tight, lot inventory constricts and adds an additional hurdle to housing affordability.”
While builder sentiment pushed higher (again, completely thanks to the South), consumer sentiment fell month-over-month for the first time since November, 2022. Combined with two regions, the Midwest and the West, losing a point of HMI, the setback in consumer sentiment suggests that the recovery in the aggregate HMI will likely flatten out in the coming months.
/Wells Fargo Housing Market Index (HMI) and the University of Michigan Index of Consumer Sentiment")
Source for data: NAHB and the University of Michigan
The SF Detached Next Six Months (Seasonally Adjusted) was the one component of the HMI to lose ground in March. Like consumer sentiment, the last sequential fall for this component was back in November, 2022.
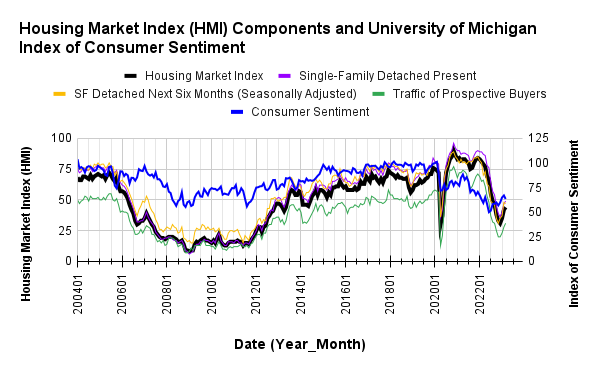
The four regions experienced mixed month-over-month performances. The Northeast increased from 32 to 34 to 46 over the past two months but flattened out in March. The Midwest fell a point to 35. The South was the only region in December to increase its HMI. So its surge from 46 to 50 in March takes on additional significance, especially since this milestone makes the South the first region to push into “positive” territory. The South was last at or above 50 in September. The Northeast was the next best region with a 57 in July. Sentiment in the West retreated by a point to 36.
Home closing thoughts
Yes In My Backyard Movement Heads to State Capitols
Sometimes what is great for existing members of a community is bad for the community-at-large. As homelessness rises and options for affordable housing diminish, states are looking for ways to override the decisions local communities make that exacerbate these problems. In particular, states are looking for ways to increase housing supply. In “‘A holy war on sprawl’: States seek to shape new housing development by limiting local control“, Yahoo News describes several state legislative efforts to address housing problems with more liberal supply policies. Of course, several local communities are pushing back and essentially declaring that the housing crunches are someone else’s problem.
“Polls show that while building more affordable housing is popular in theory, most homeowners tend to oppose it in their own neighborhoods. Their stated objections are usually practical concerns (like increased traffic or competition for street parking) or worry over property values and an aesthetic preference for lower density.
The resulting local zoning codes in suburbs and some affluent urban neighborhoods tend to prevent new construction of smaller, less expensive homes, especially rental apartments. Such so-called snob zoning drives up housing costs by creating scarcity; it also worsens economic and racial segregation by preventing lower-income families from living in certain areas, studies have shown.”
The article goes on to describe legislative efforts in New York, California, Oregon, and Washington that have produced bills mandating a range of actions for local governments: housing development goals, legalizing accessory dwelling units, approval for multifamily housing developments in walkable, transit-accessible and centrally located areas, and appropriation of funds for affordable housing development. Housing proponents suffered a setback in Arizona where a bill to allow construction of less expensive housing types (like duplexes, triplexes, single-room occupancies and granny flats) went down in legislative defeat.
Affordable Housing Takes A Hit from the Panic of 2023
KQED identified 11 in-process or recently completed affordable housing projects in the San Francisco Bay Area that are dependent on loans from Silicon Valley Bank. SVB touched off the banking Panic of 2023 after depositors rushed to withdraw money. The run lasted less than 2 days before regulators shut the bank down. According to KQED: “the collapse of the bank leaves many unanswered questions, even for projects that are already completed. Developers and housing providers are concerned that any delays or disruptions in financing will increase costs and hinder the construction process.” Affordable housing may become one of many flashpoints as regional banks come under increased pressure and scrutiny and rein in lending.
The Death of Big Cities Has Been Greatly Exaggerated
It appears the migration patterns brought on by the pandemic may not endure. The Census Bureau released its latest report on U.S. migration patterns with the telling title “Growth in the Nation’s Largest Counties Rebounds in 2022.” The Census Bureau explained that “after some of the nation’s most populous counties experienced significant outmigration and population declines in 2021, overall patterns of population growth and decline are moving towards pre-pandemic rates for the nation’s 3,144 counties according to the U.S. Census Bureau’s Vintage 2022 estimates of population and components of change…”
Specifically, many of the small counties that benefited from gains in domestic migration in 2021 experienced slower growth in 2022. Many large counties experienced small gains in domestic migration, especially in the South and West. San Francisco and Los Angeles counties lost much lower numbers of people while New York flipped from deep negative territory to a small positive. Pre-pandemic migration patterns are not likely to return anytime soon; it seems the pandemic-driven exodus from big cities is already slowing and even coming to an end.
Spotlight on Mortgage Rates
The 30-year fixed rate mortgage was on its way up again until the Panic of 2023 hit. The March peak hit 6.73%. The month ended at 6.32%. This places rates right around the latest Freddie Mac forecast for the end of 2023. If February was any indication, this new decline sets up another month of relatively strong housing data. Every week in March, the Mortgage Bankers Association (MBA) reported sequential increases in mortgage applications. The inverse correlation between the direction of mortgage rates and the direction of mortgage applications remains relatively consistent given rates fell for most of March.
![Source: Freddie Mac, 30-Year Fixed Rate Mortgage Average in the United States [MORTGAGE30US], retrieved from FRED, Federal Reserve Bank of St. Louis, March 31, 2023](https://drduru.com/onetwentytwo/wp-content/uploads/2023/03/20230331_30-Year-Fixed-Rate-Mortgage-Average-US.png)
Be careful out there!
Full disclosure: long ITB, long KBH