Housing Market Intro and Summary
In my last Housing Market Review, I described the dynamics of a housing market trying to wait out this cycle of rising rates. Since then, ever higher mortgage rates continued their relentless and sharp uptrend. Accordingly, the pressures on the housing market simply increased further. The marks of a deepening housing recession are written all over the latest data, even with consumer sentiment stabilizing for the moment.
The GDP report for the third quarter describes another aspect of the housing recession. While overall GDP growth was robust in Q3, residential fixed investment dropped for the sixth quarter in a row with substantial declines over the last two quarters of 17.8% and 26.4%. According to the Bureau of Economic Analysis (BEA), new single-family construction and brokers’ commissions drove the latest declines. Excluding the pandemic-induced crash, single-family housing starts are around a 3-year low.
These housing dynamics continue to stall my seasonal trade on home builders. While the stocks of home builders have stabilized since the June lows, a lack of confidence in the 2023 Spring selling season promises to cap the typical seasonal upside in the stocks of home builders.
Housing Stocks
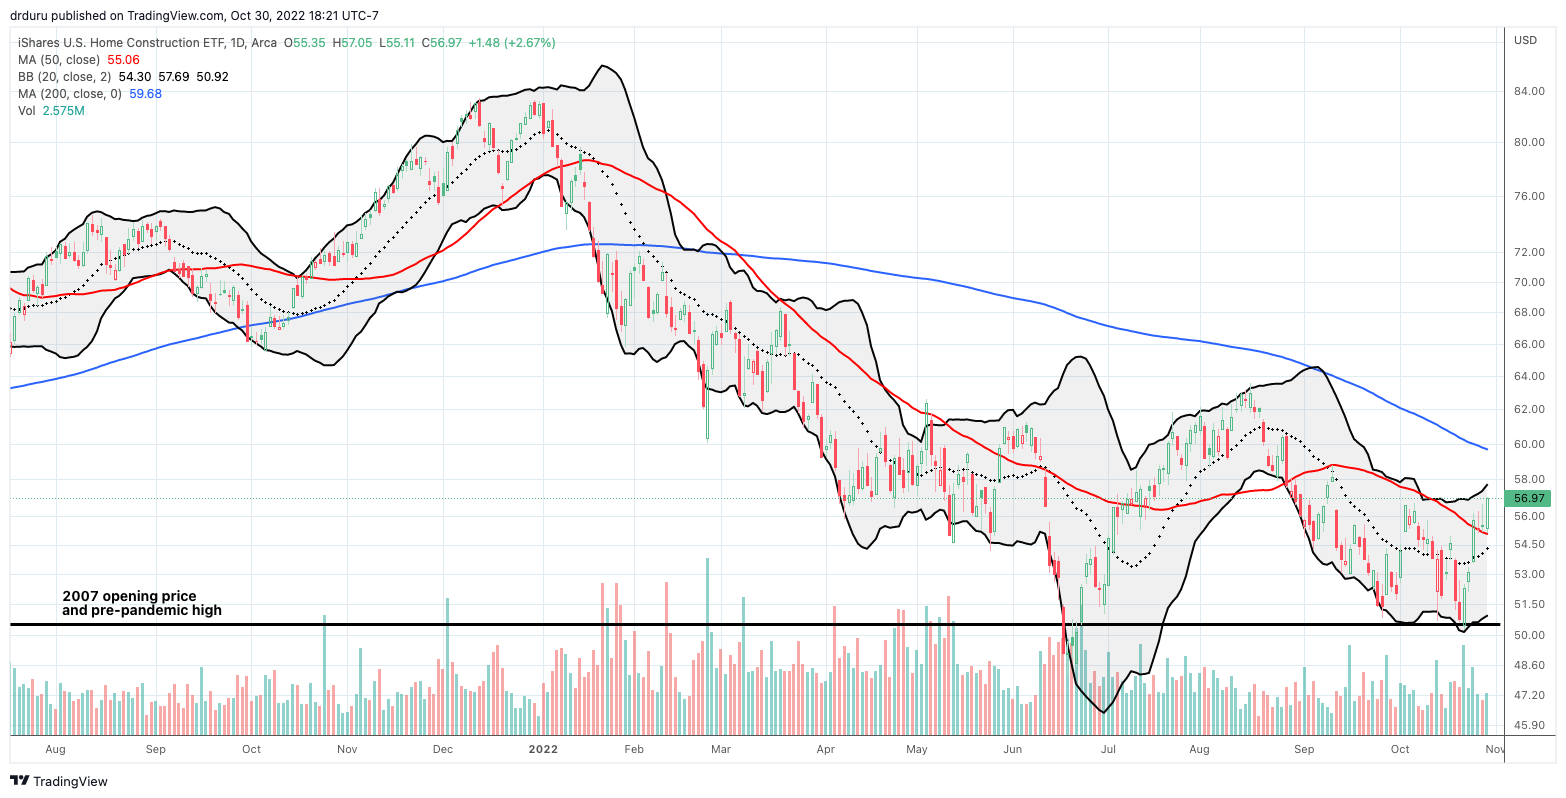
The iShares US Home Construction ETF (ITB) found fresh support at its pre-pandemic high. That bounce came a week after the S&P 500 (SPY) generated its own bottoming pattern. This lag is an unseasonal performance and one more indication to wait on the trading strategy.

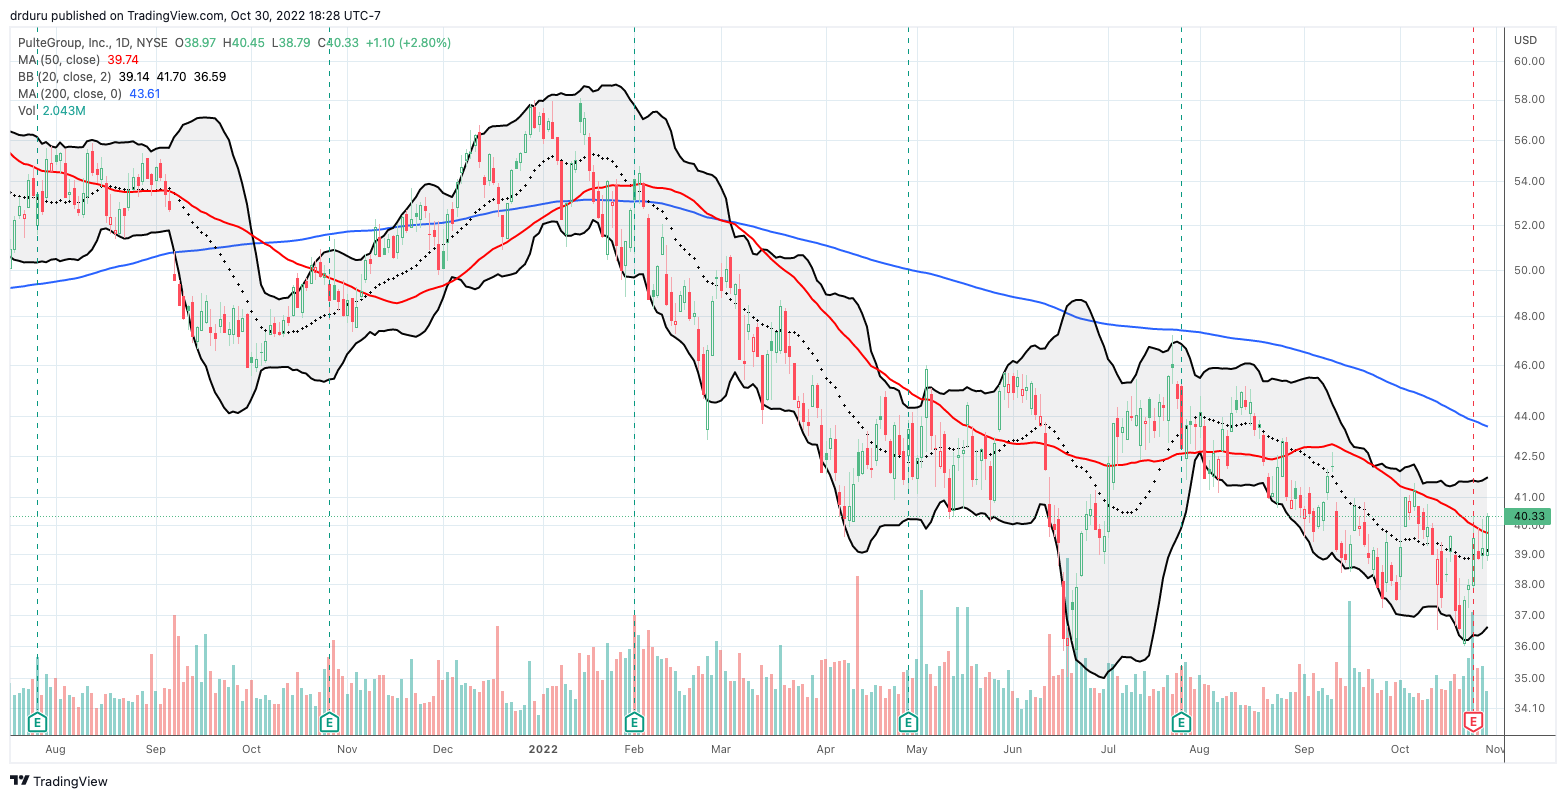
PulteGroup, Inc (PHM) reported earnings last week and generated a surprise 4.2% gain in response. Buyers followed through with the simultaneous rally in the stock market. By my read, PHM did not report any surprise good news. Instead, management delivered the reality check of an extended slowdown in the housing market. I will post a more detailed write-up soon (likely on Seeking Alpha).

Housing Data
New Residential Construction (Single-Family Housing Starts) – September, 2022
Housing starts reached a new pandemic era low (excluding the plunge in the early months of the pandemic). Starts decreased 4.7% month-over-month to 936,000. Starts decreased 18.5% year-over-year. August’s starts were revised to 936,000. While starts hit a new low, the decline was small enough to suggest that odds remain good for the 800K floor to hold in the face of the current housing downturn. However, with builder sentiment back to the troughs of the housing crash after the Great Financial Crisis (GFC), holding the 800K floor may become a close call.
![Housing starts Source: US. Bureau of the Census, Privately Owned Housing Starts: 1-Unit Structures [HOUST1F], first retrieved from FRED, Federal Reserve Bank of St. Louis, October 24, 2022.](https://drduru.com/onetwentytwo/wp-content/uploads/2022/10/221024_Housing-Starts.png)
Housing starts declined year-over-year in every region. The South was the only region to enjoy a month-over-month gain (of 2.5%). The West region’s starts dropped to their second lowest point since the pandemic as activity suffers a rapid slowdown that promises to create a new supply crunch in the next recovery. Housing starts in the Northeast, Midwest, South, and West each changed -15.9%, -15.2%, -14.5%, and -30.1% respectively year-over-year.
Existing Home Sales – September, 2022
The slowing housing market is still delivering little (aggregate) price relief in the market for existing homes. Absolute inventory even contracted for the second month in a row. For the July report, the National Association of Realtors (NAR) declared a recession for the housing market, but the slowdown has yet to deliver significant pricing or inventory relief for buyers.
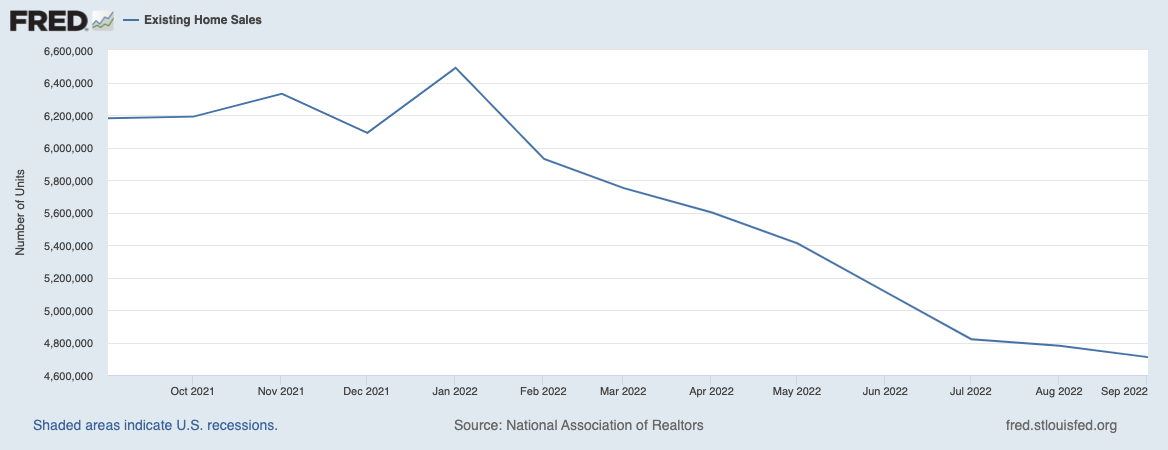
Existing home sales dropped for an eighth month in a row although the pace remains much slower than the beginning of the decline. The seasonally adjusted annualized sales in September of 4.71M decreased 1.5% month-over-month from the slightly downwardly revised 4.78M in existing sales for August. Year-over-year sales decreased 23.8%. Sales remain below the pre-pandemic existing home sales activity between 5.0M to 5.5M in 2019 and 2018. Sales were last this low in 2014 excluding the pandemic-driven crash.
(For historical data from 1999 to 2014, click here. For historical data from 2014 to 2018, click here) Source for chart: National Association of Realtors, Existing Home Sales© [EXHOSLUSM495S], retrieved from FRED, Federal Reserve Bank of St. Louis, October 24, 2022.

September’s absolute inventory level of 1.25M homes decreased 2.3% from August. This monthly decline is the second one in a row after six straight months of increases. Inventory stayed flat year-over-year in July and August but declined slightly by 0.8% in September. According to the NAR, “unsold inventory sits at a 3.2-month supply at the current sales pace – unchanged from August and up from 2.4 months in September 2021.” The on-going tightness in inventory contrasts with the notion of a full-blown housing recession. The NAR acknowledged the stark contrast with the last significant housing downturn:
“Despite weaker sales, multiple offers are still occurring with more than a quarter of homes selling above list price due to limited inventory…The current lack of supply underscores the vast contrast with the previous major market downturn from 2008 to 2010, when inventory levels were four times higher than they are today.”
Despite the drop in inventories, the time it took for buyers to take a home off the market increased slightly. The average 19 days it took to sell a home in September was three above the 16 days in August and up from 17 days a year ago. The 70% of homes that sold within one month is a notable decline from the 81% in August. In other words, buyers are less excited by what is left on sale. The earlier rapid turnover demonstrated lingering strength in market demand among those who could still afford a home.
Prices continue to creep sequentially downward. The median price of an existing home decreased 1.8% month-over-month to $384,800 and jumped 8.4% year-over-year. Prices have increased year-over-year for 127 straight months, an on-going record streak.
The sequential decline did not stir incremental interest in first-time home buyers. Their share of sales stayed flat with July and August’s 29% and a surprising 1 percentage point higher than a year ago. The NAR’s 2017 Profile of Home Buyers and Sellers reported an average of 34% for 2017, 33% for 2018, 33% for 2019, 31% for 2020, and 34% for 2021.
All regions declined significantly in sales year-over-year with the two biggest regions suffering the largest losses. The regional year-over-year changes were: Northeast -18.7%, Midwest -19.7%, South -23.8%, West -31.3%. The Northeast and the West managed to increase sales slightly month-over-month, 1.6% and 1.1% respectively.
For the twelfth month in a row, the South’s median price soared year-over-year. The South has outpaced the other three regions for 13 straight months. I continue to imagine the rush for more attractive and affordable housing in the South is applying the stronger price pressures. The regional year-over-year price gains were as follows: Northeast +8.3%, Midwest +6.9%, South +11.8%, West +7.1%.
Single-family home sales decreased 0.9% from August and declined on a yearly basis by 23.0%. The median price of $391,000 was up 9.8% year-over-year.
California Existing Home Sales – September, 2022
Existing home sales in California resumed their steady grind lower after August’s quick jump in sales. The resumption in the uptrend for mortgage rates cooled off buyers.
C.A.R. reported that “existing, single-family home sales totaled 305,680 in September on a seasonally adjusted annualized rate, down 2.5 percent from August and down 30.2 percent from September 2021.” September’s sales decline was broad based with all price segments falling by at least 25% year-over-year. Homes priced below $300K fell the most at 36.7% (inventory of such Californian homes is likely extremely thin). The median price dropped 2.1% month-over-month and increased 1.6% year-over-year. Normalized by square footage, the median selling price of an existing home in California increased 2.8% year-over-year.
Bidding wars are rapidly fading from California’s market. The statewide sales-price-to-list-price ratio stayed below 100.0% for the second month in a row, sitting at 97.7% in September. This ratio was 101.9% a year ago. The median time to sell a home in California increased from 19 days in August to 22 in September. The duration was just 10 days a year ago.
Contracting inventory kept the statewide Unsold Inventory Index (UII) flat with August’s 2.9 months of sales, up from 1.9 a year ago. Still, active listings increased 51.5% year-over-year.
New Residential Sales (Single-Family) – September, 2022
New home sales in September resumed their downtrend off the pandemic peak after a surprise surge in August. As expected, a resumption in the surge for mortgage rates sent new home sales back down.
September new single-family home sales of 603,000 were down 10.9% from August’s 677,000 (revised down). Sales were also down 17.6% year-over-year. Despite the resumption in declines, the key support at 550,000 in sales held.
![new home sales Source: US. Bureau of the Census, New One Family Houses Sold: United States [HSN1F], first retrieved from FRED, Federal Reserve Bank of St. Louis, October 30, 2022](https://drduru.com/onetwentytwo/wp-content/uploads/2022/10/221030_New-Home-Sales.png)
A month after losing significant share, the $500,000 to $749,000 price tier bounced right back. Overall, sales shifted from the $200,00 to $299,000 tier to the higher price tiers. The sizable shift helped take the median sales price close to its all-time high and an 8.0% sequential increase.
The fresh sales decline took inventory from 8.1 months of sales in August to 9.0 months in September. The market is over-supplied given it sits above the 6.0 level that is the benchmark for a balanced market.
The year-over-year decline in sales was led by the South and the West while the other two regions bounced higher. The Northeast, Midwest, South, and the West changed +25.8%, +10.6%, -19.3%, and -30.4% respectively. The West got hit the hardest yet again. The Midwest enjoyed a second month of gains after 10 straight months of significant declines.
Home Builder Confidence: The Housing Market Index – October, 2022
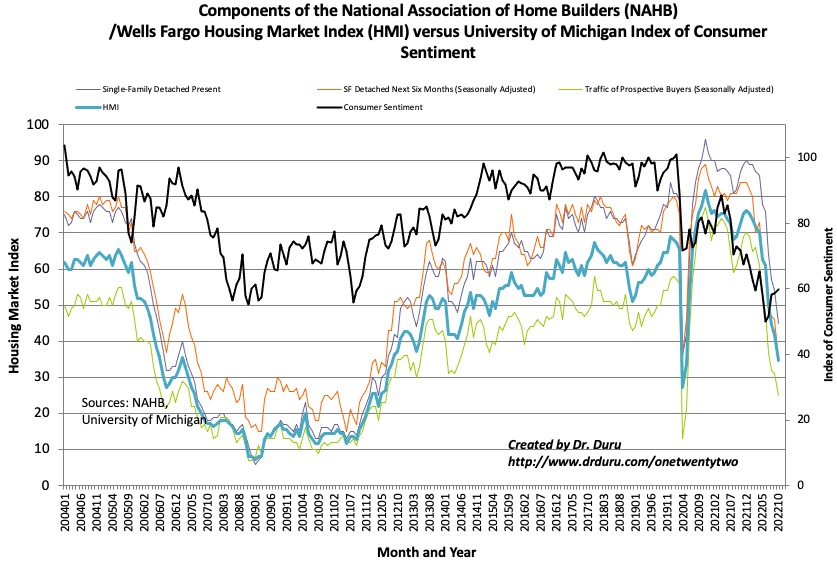
The Housing Market Index (HMI) dropped for the tenth straight month. October’s plunge to 38 planted the HMI in housing recession territory. Interestingly, at the same time, consumer sentiment may have stopped coming down with three straight days of gains. The Single-Family Detached Present led the way down again. As expected, the previous month’s decline in this metric signaled the temporary nature of the August jump in new home sales. Excluding the pandemic, the Traffic of Prospective Buyers (Seasonally Adjusted) was last this low in March, 2012, the trough of the last housing recession.

Source for data: NAHB and the University of Michigan
The National Association of Home Builders (NAHB) fingered swiftly rising mortgage rates as the major drag on the market. The NAHB also decried the notion that the housing recession is bringing the housing market back into balance: “While some analysts have suggested that the housing market is now more ‘balanced,’ the truth is that the homeownership rate will decline in the quarters ahead as higher interest rates and ongoing elevated construction costs continue to price out large number of prospective buyers.”
Just as with new home sales, the West and the South led the regional declines. The Northeast was the one region with an increase, from 47 to 48. After two months of stabilization, the Midwest fell from 42 to 38. The South plunged from 52 to 41, and the West plunged as well, falling from 34 to 25. Sentiment in the West was last this low in January, 2012, in the middle of the trough of the housing collapse from the financial crisis. The South’s HMI was last this low September, 2012, excluding the low of the pandemic.
Home closing thoughts
Locals Fight California’s Housing Edicts
California’s high cost of housing is partially driven by a severe shortage of inventory relative to demand and need. Even during this housing recession, the market remains relatively tight as demonstrated by the latest data. California’s state government stepped into the crunch in recent years with legislation mandating that cities produce plans for accommodating growth, including allocations for affordable housing (well, what counts as affordable in California). This election season features some pushback from residents of several towns.
In “From Menlo Park to Laguna Beach, Residents Turn to Ballot Box to Fight New California Housing Mandates“, KQED covers the story of a Menlo Park ballot measure seeking to put limits on new apartment complexes. Perhaps ironically, this measure is fighting against an affordable housing proposal for teachers. Middle to low income workers have suffered the most from California’s housing shortage, and their inability to afford local housing translates into some labor shortages as well.
The history of these local ballot measures is poor as judges have ruled that state law overrules such measures: “There is no authority of the voters of Encinitas or Menlo Park or any other city to do through direct democracy something that the city council cannot do.” Yet this precedence clearly will not stop residents from opposing growth to accommodate new residents.
Spotlight on Mortgage Rates
Mortgage rates are continuing a relentless rise. The 30-year fixed rate mortgage soared from 4.99% at the August low to 7.08% last week. Mortgage rates were last this high in 2002. This jump in rates is truly stunning.
![Sources include: Board of Governors of the Federal Reserve System (US), Market Yield on U.S. Treasury Securities at 30-Year Constant Maturity [DGS30], retrieved from FRED, Federal Reserve Bank of St. Louis and Freddie Mac, 30-Year Fixed Rate Mortgage Average in the United States [MORTGAGE30US], retrieved from FRED, Federal Reserve Bank of St. Louis, May 1, 2022](https://fred.stlouisfed.org/graph/fredgraph.png?g=Vqj5)
Be careful out there!
Full disclosure: long ITB shares, long SPY calendar call spread


