Stock Market Commentary:
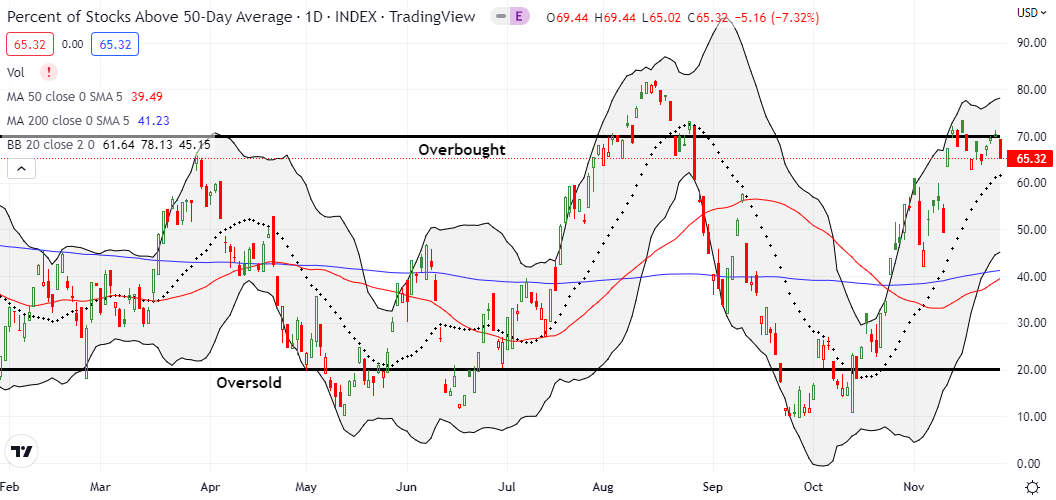
The people of China have now suffered three years of various draconian lockdowns meant to contain the spread of COVID-19. The latest lockdowns remind a suffering populace that there remains no end in sight for this extended kind of public health authoritarianism. Apparently, the frustrations are boiling over enough to motivate people to risk protesting and publicizing events on social media. With optimism here in the U.S. riding high on a “China reopening”, the news of potential deterioration on the ground in China was enough to motivate sellers in the stock market. The timing of these troubles created a reconfirmation of bearish trading conditions. The stock market fell out of overbought trading conditions for the third time in two weeks. Overbought conditions symbolize the strength of buyers. The failure to hold overbought trading conditions signals weakening convictions. In this case, the fresh drop underlines last week’s reluctant shift into overbought trading conditions.
The Stock Market Indices
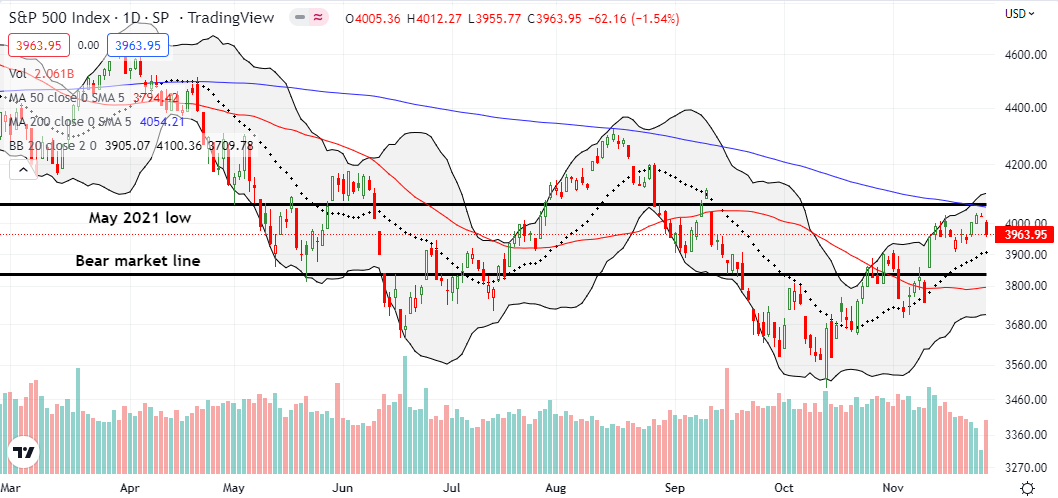
The S&P 500 (SPY) gapped down at the open and sold off most of the day. The 1.5% setback ended the index’s short-term hopes for challenging overhead resistance at its 200-day moving average (DMA) (the blue line below). While this failure is bearish, sellers have not yet taken control of the technicals. Such a milestone will only happen after a 50DMA (the red line below) breakdown which would return the S&P 500 to bear market territory.
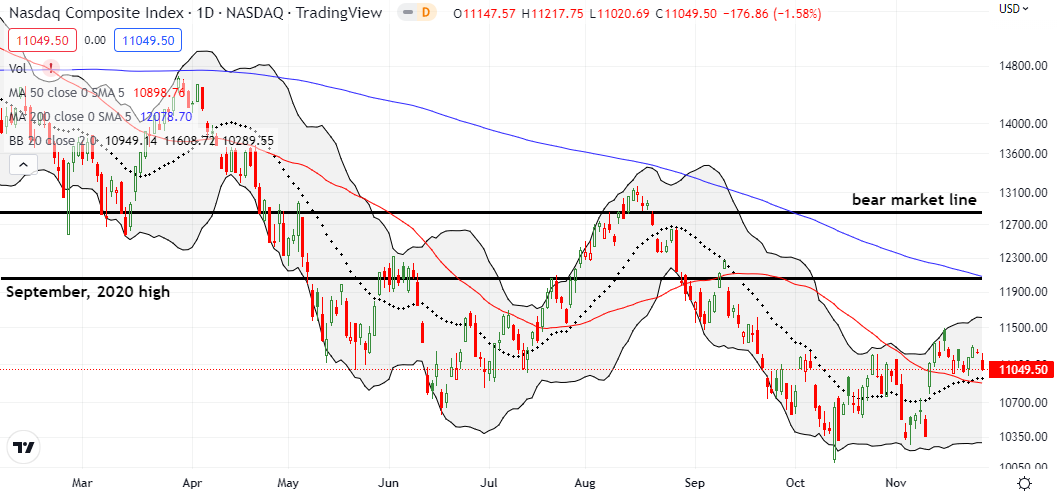
The NASDAQ (COMPQ) is churning away just above converged support from its 50DMA and 20DMA (the dotted line below). Accordingly, sellers are closer to taking over the trading action in the tech-laden index. A 50DMA breakdown could open a quick path to a fresh challenge to the October and November lows. I bought a QQQ put spread expiring this Friday as my first direct trade on the bearish implications for the latest failure to hold overbought trading conditions.
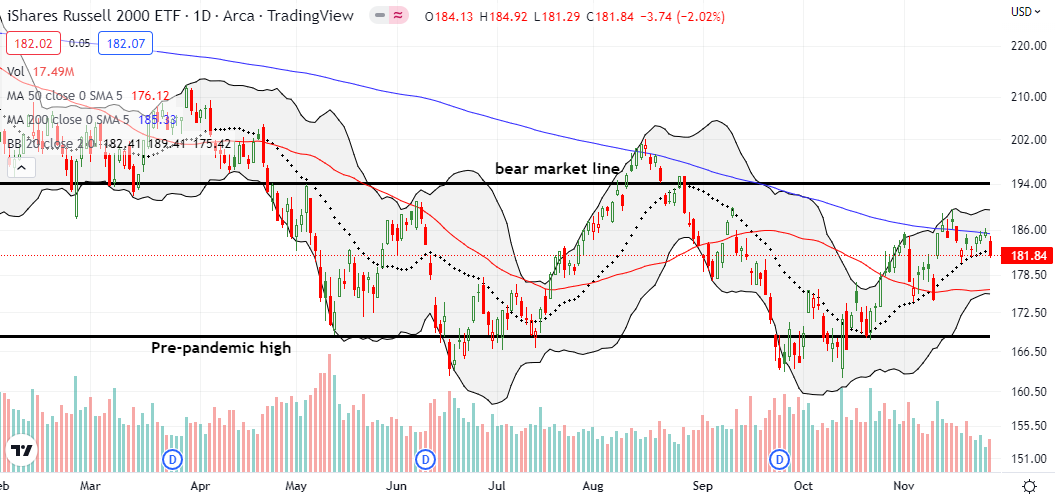
The iShares Russell 2000 ETF (IWM) fell directly from 200DMA resistance and even closed below its 20DMA for the first time in almost three weeks. Suddenly, IWM has gone from technical leader to being at risk for a swift retest of 50DMA support.
Stock Market Volatility
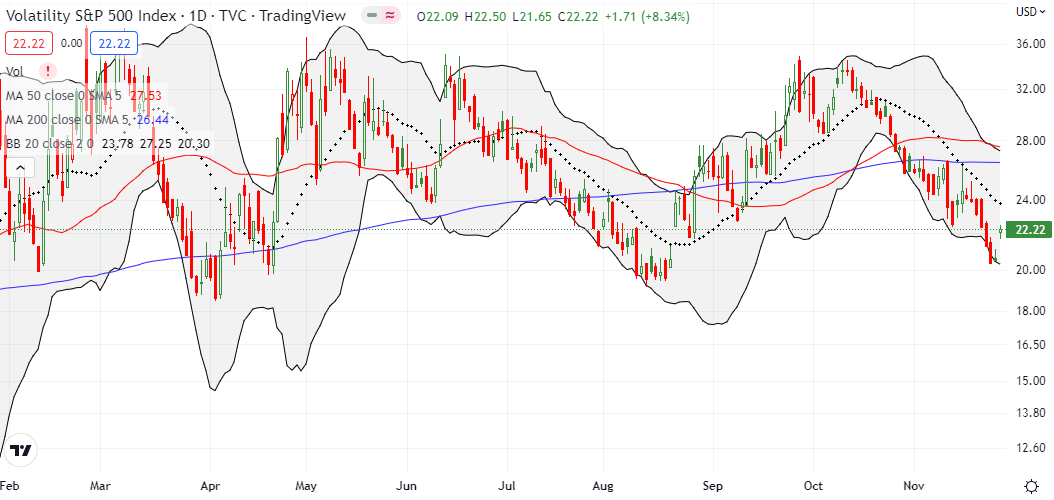
The volatility index (VIX) showed some real strength for the first time since it peaked in October. The 8.3% gain put an exclamation point on the 20 level as support. I am now on watch for an end to the VIX’s downtrend.
The Short-Term Trading Call With A Failure
- AT50 (MMFI) = 65.3% of stocks are trading above their respective 50-day moving averages (ending a 1-day overbought period)
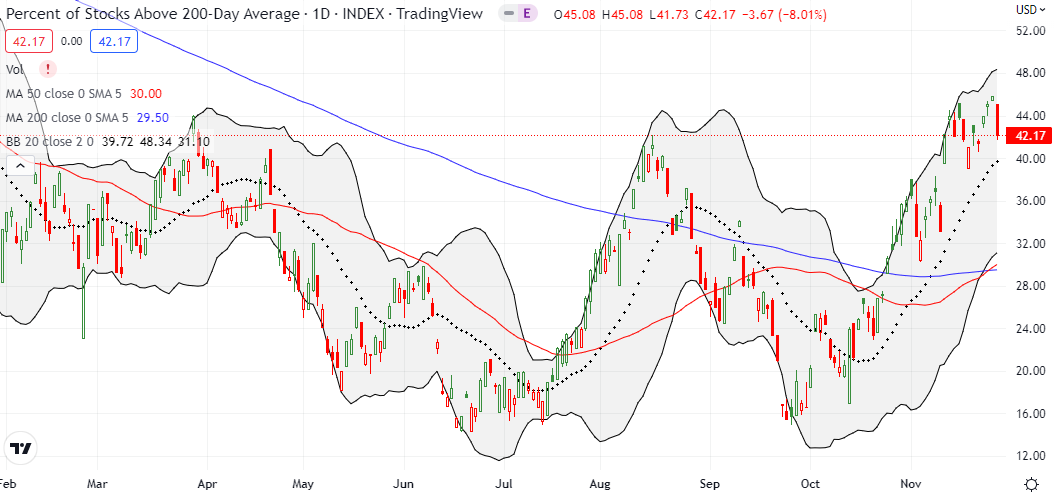
- AT200 (MMTH) = 42.7% of stocks are trading above their respective 200-day moving averages
- Short-term Trading Call: cautiously bearish
AT50 (MMFI), the percentage of stocks trading above their respective 50DMAs, lost 5 percentage points in a definitive rejection from overbought trading conditions (above 70%). AT200 (MMTH), the percentage of stocks trading above their respective 200DMAs, also suffered a significant failure and setback from last week’s bullish breakout. Combined, the two moves validated my decision to stick with the cautiously bearish short-term trading call. I followed through on the bearish failure by finally buying puts on an index (as described above). I chose a Friday expiration assuming that if sellers are actually serious, the move downward to support levels will be swift. Otherwise, I do not want to overpay for waiting with older bullish positions still on hand.
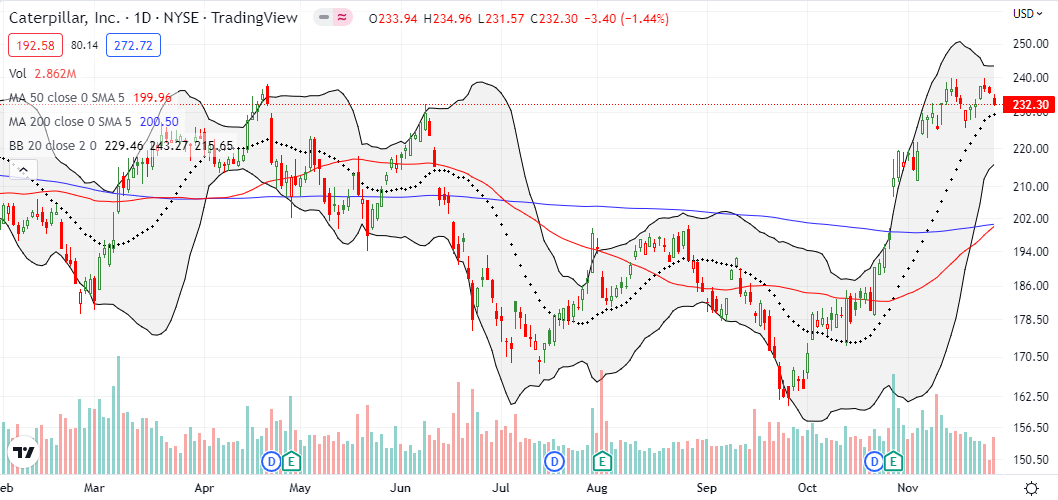
With a bearish tint in my glasses, I am looking askance at some old but familiar trading signals. Caterpillar, Inc (CAT) used to be a vehicle for hedging against bullishness. I dropped CAT some time ago given what I saw as extended resilience and even sustained bullishness. Now, CAT suddenly looks toppy with a mini double top in place right at resistance from the April highs which are also just below the all-time high set in June, 2021. I will treat a close below the last intraday low at $225.51 as a confirmation of the top.
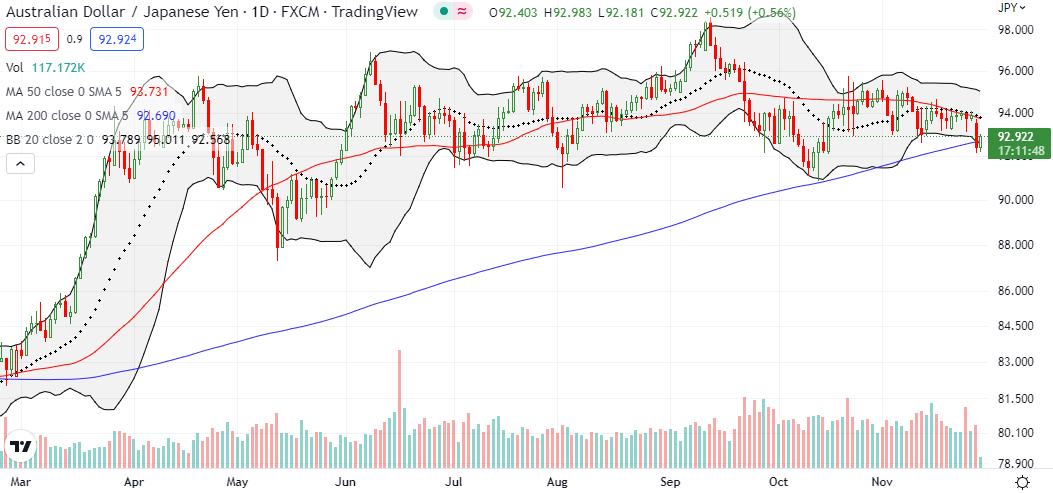
An even more ominous signal is coming from the currency market. The Australian dollar versus the Japanese yen (AUD/JPY) is testing 200DMA support again. When AUD/JPY tested 200DMA support in October, the S&P 500 pulled off a successful test of the September closing low. THIS time, the index is on its way down from important resistance. Thus, if AUD/JPY suffers a failure with a 200DMA breakdown, I will assume further confirmation of bearish tidings in the market. The Japanese yen has been hard to use in its traditional role as a safety trade given stubbornly accommodative monetary policy has weakened the yen for most of this year. However, with a global recession looming closer and closer, the tide seems to be turning for the yen, especially with October’s dramatic topping for USD/JPY at levels last seen in 1998.
Be careful out there!
Footnotes
“Above the 50” (AT50) uses the percentage of stocks trading above their respective 50-day moving averages (DMAs) to measure breadth in the stock market. Breadth defines the distribution of participation in a rally or sell-off. As a result, AT50 identifies extremes in market sentiment that are likely to reverse. Above the 50 is my alternative name for “MMFI” which is a symbol TradingView.com and other chart vendors use for this breadth indicator. Learn more about AT50 on my Market Breadth Resource Page. AT200, or MMTH, measures the percentage of stocks trading above their respective 200DMAs.
Active AT50 (MMFI) periods: Day #30 over 20%, Day #26 over 30%, Day #24 over 40%, Day #12 over 50%, Day #12 over 60% (overperiod), Day #1 under 70% (underperiod ending 1 day overbought)
Source for charts unless otherwise noted: TradingView.com
Full disclosure: long IWM calendar call spread, short IWM put spread, long SPY calendar call spread, long QQQ put spread
FOLLOW Dr. Duru’s commentary on financial markets via StockTwits, Twitter, and even Instagram!
*Charting notes: Stock prices are not adjusted for dividends. Candlestick charts use hollow bodies: open candles indicate a close higher than the open, filled candles indicate an open higher than the close.


