
Housing Market Intro and Summary
Despite more evidence of slowing conditions in the housing market, home builder stocks remained relatively resilient in August. The underlying dynamics of demand remain in place even as housing prices remain lofty and continue to conjure up images of a housing bubble for market commentators and pundits. A supportive Federal Reserve promises to keep a tight ceiling on mortgage rates and thus provides a strong floor for the housing market. These forces combine to deliver a comfortable calm for investors even as home buyers continue to scramble around limited (albeit growing) housing inventories. Until these inventories loosen further, a fresh and significant upside catalyst for the housing market will likely remain elusive.
Housing Stocks
The Spring selling season is long over and normalization brought clearer seasonal patterns like the May peak in most housing-related stocks. The iShares Dow Jones US Home Construction Index Fund (ITB) started a comeback from that peak with a breakout in July and another pop in August. The monthly gain of 2.2% for ITB almost kept up with the S&P 500 (SPY) which gained 2.9% on the month. The resulting trading range around current levels has the look of a comfortable calm.
LGI Homes, Inc (LGIH) reported second quarter earnings on August 3rd. The company proclaimed “the strongest second quarter performance in our history, exceeding our expectations and setting new Company records for revenue, closings, absorptions and virtually all our profitability metrics.” Pre-tax net income margin hit a record (18.8%). LGI Homes even raised guidance on margins and the number of homes delivered for the rest of the year. Unimpressed investors, presumably holding on to stratospheric expectations, sold LGI into a 5.9% post-earnings loss. Perhaps they lamented the lost opportunity in demand exceeding LGI Homes’s ability to deliver. Accordingly, net orders actually declined 10.1% year-over-year. Investors even took LGIH down fractionally in response to record August closings.
LGI Homes now has waitlists full of eager buyers at many of its communities.
M/I Homes (MHO) is one of the few home builders in my universe whose strong start in September propelled the stock into a breakout. As a result, MHO is still grinding higher on the momentum from a 6.2% post-earnings gain in early August. M/I Homes also caught the attention of CNBC’s Fast Money crew. Shana Sissel applauded the company for its cheap valuation that makes it a potential acquisition target. Guy Adami pointed out a new $100M stock buyback and a recent $100 price target from Wedbush. Unfortunately (and surprisingly), 56% of viewers panned the investment idea.
Housing Data
New Residential Construction (Single-Family Housing Starts) – July, 2021
Single-family home starts decreased to 1,110,000 which was 4.4% below June’s 1,163,000 starts (revised upward from 1,160,000). Starts were 5.5% above last year’s levels and mark a significantly slower growth rate from June’s 28.5% year-over-year jump. The rate of year-over-year change has remained positive for 13 straight months.
The downtrend remains from the 14-year high set in December, 2020. The longer-term trend from the 2011 trough remains upward. On balance, starts have settled into a bit of a comfortable calm. I continue to expect starts to hold the 1,000,000 level through the balance of the year even with builder sentiment now on the decline (see below).
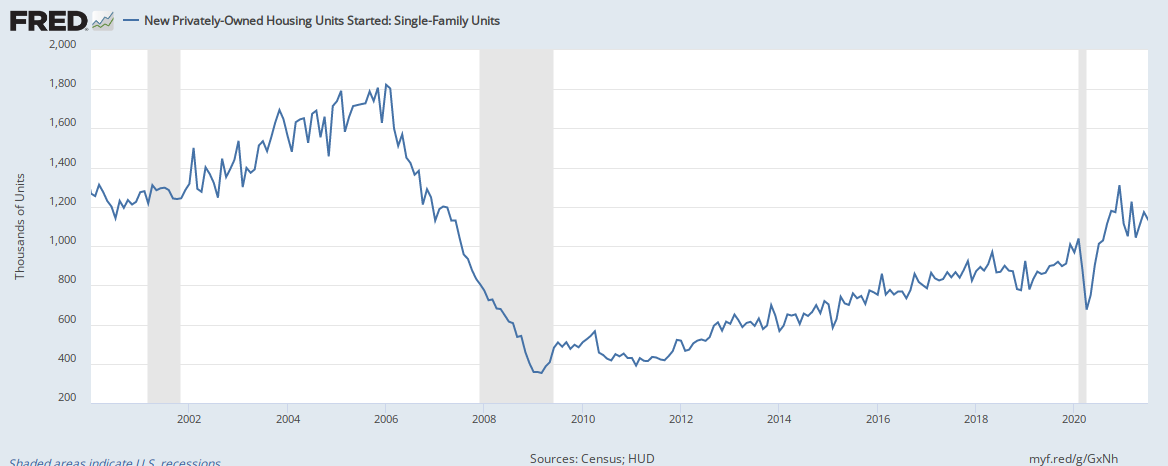
Source: US. Bureau of the Census, Privately Owned Housing Starts: 1-Unit Structures [HOUST1F], first retrieved from FRED, Federal Reserve Bank of St. Louis, September 3, 2021.
The Midwest was the only region with a year-over-year decline in starts. Housing starts in the Northeast, Midwest, South, and West each changed +7.1%, -6.0%, +8.8%, +3.5% respectively year-over-year.
Existing Home Sales – July, 2021
July existing home sales finally registered two straight months of gains. Existing home sales seem to be settling into a comfortable calm although the modest uptick was somewhat undermined by a year-over-year decline in single-family home sales. Moreover, existing home sales remain well off the lofty heights from the immediate wake of the pandemic. The seasonally adjusted annualized sales in July of 5.99M increased 2.0% month-over-month from the upwardly revised 5.87M in existing sales for June.
The National Association of Realtors (NAR) once again pointed to a small increase in inventory as a driver of increased sales. However, the opportunities are happening at the higher end of markets. “Much of the home sales growth is still occurring in the upper-end markets, while the mid- to lower-tier areas aren’t seeing as much growth because there are still too few starter homes available.” Year-over-year sales increased 1.5%, a significant slowing from the previous month’s 22.9% pop.
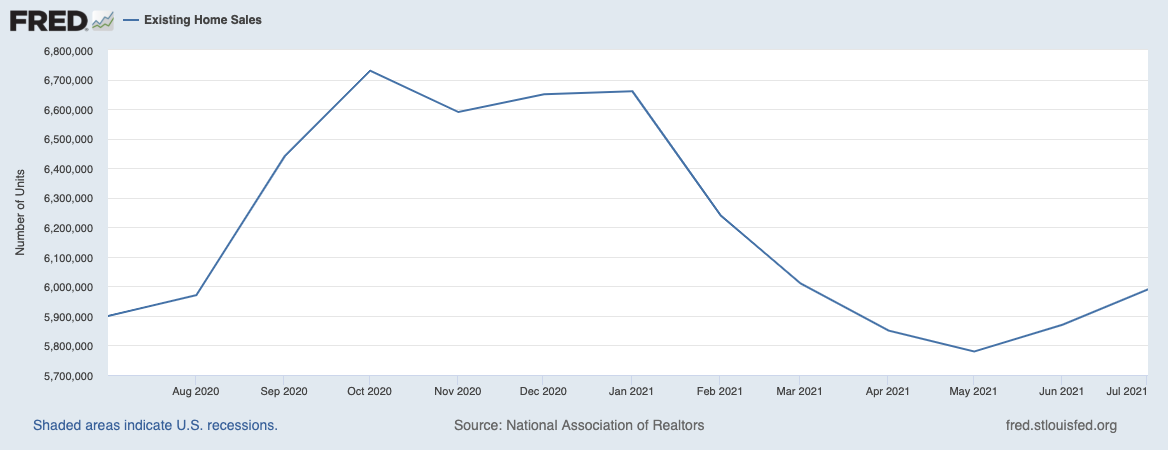
(As of the March, 2018 data, the NAR further reduced historical data to just 13 months. For historical data from 1999 to 2014, click here. For historical data from 2014 to 2018, click here) Source for chart: National Association of Realtors, Existing Home Sales© [EXHOSLUSM495S], retrieved from FRED, Federal Reserve Bank of St. Louis, September 3, 2021.

July’s absolute inventory level of 1.32M homes increased 7.3% from June. Inventory dropped 12.0% year-over-year (compare to June’s 18.8%, May’s 20.6%, April’s 20.5%, March’s 28.2%, February’s 29.5%, January’s 25.7%, December’s 23%, November’s 22%, October’s 19.8%, September’s 19.2% year-over-year declines, unrevised). The inventory situation is further improving ever so slightly, but July’s increase from 2.5 to 2.6 months of sales occurred thanks to the sales revisions for June. “Unsold inventory sits at a 2.6-month supply at the present sales pace, up slightly from the 2.5-month figure recorded in June but down from 3.1 months in July 2020.” The on-going year-over-year decline in inventory is on a 26-month streak.
The average 17 days it took to sell a home tied the all-time record lows set in April, May, and June.
The median price of an existing home pulled back from June’s all-time high to $359,900. Prices have increased year-over-year for 113 straight months, and July’s price jump was a 17.8% year-over-year gain. The median price decreased from June by 3.7%.
First-time home buyers dropped to a 30% share of sales in July, down from 31% in June. The NAR’s 2017 Profile of Home Buyers and Sellers reported an average of 34% for 2017, 33% for 2018, 33% for 2019, and 31% for 2020. The current share is the same as last year’s average and represents a solid floor of demand from first-timers relative to the market. Investors pulled back to a 14% share of sales, down from 17% in May and up from 9% a year ago.
The Northeast took the baton from the West and raced ahead of all other regions for existing home sales. The regional year-over-year changes were: Northeast +12.1%, Midwest -1.4%, South +1.2%, West +23.7%.
All regions registered robust year-over-year price gains: Northeast +23.6%, Midwest +18.5%, South +21.4%, West flat.
Single-family home sales increased 2.7% from June but decreased on a yearly basis by 0.8%. The median price of $367,000 was up 18.6% year-over-year.
California Existing Home Sales – July, 2021
While the NAR celebrated two straight months of slight sequential gains in sales, existing homes sales moved in the exact opposite direction for California. Californian existing home sales dropped sequentially for the third month in a row. Sales have now declined 6 out of the last 7 months. For July, the California Association of Realtors (C.A.R.) reported 428,980 in existing single-family home sales. Sales decreased 1.6% from June and even decreased 2.0% year-over-year. Even prices sequentially declined. At $811,170 the median price decreased 1.0% month-over-month while gaining 21.7% year-over-year. At $394, the price per square foot still set a new all-time high for California. Over 70% of homes sold above asking price. C.A.R. decided to focus on the positives by noting sales were the second highest for a July over the past 6 years.
For April, increasing price pressures prompted C.A.R. Vice President and Chief Economist Jordan Levine to doubt the durability of California’s housing market. For May, Levine projected further slowing in the market. For June, Levine referenced a 6-month downtrend in pending home sales in further confirming his outlook for a slowdown. He took heart in the prospects of a cool-down in prices. In the July Report, C.A.R. President Dave Walsh pointed out that the California market is normalizing from the red hot market that followed the onset of the pandemic.
Inventory increased to 1.9 months of sales in July from June’s 1.7. Inventory decreased year-over-year from 2.1. The narrative of increased listings leading to increased sales once again failed to play out as the dynamics of normalization dominated. Active listings remained at their highest level since last October with a 15.4% month-over-month increase. However, new listings added in the given month actually dropped year-over-year for the first time in 5 months.
New Residential Sales (Single-Family) – July, 2021
The boom in single-family new home sales cooled off a few months ago. In July, the recent decline came to a pause with a 1.0% increase from June sales. The verdict is still out on a comfortable calm for new home sales. The 708,000 in sales were still down 27.2% year-over-year. The boom represents a period where buyers pulled forward a notable amount of demand.

Source: US. Bureau of the Census, New One Family Houses Sold: United States [HSN1F], first retrieved from FRED, Federal Reserve Bank of St. Louis, September 5, 2021.
As I noted in the previous Housing Market Review, the slowdown in sales is an expected result from home builders throttling their sales (LGI Homes is yet one more example). Facing supply chain constraints, builders are also wary of selling construction too early and at sub-optimal prices. An inflationary spiral has forced the market into a slow rebalancing act.
The median home price jumped back to an all-time high. The 5.5% month-over-month increase to $390,500 occurred as sales between $400,000 to $499,999 soared from 17% to 23% of sales. Year-over-year the median price is up 18.4%.
The monthly inventory of new homes for sale declined slightly from 6.3 to 6.2 months of sales. The absolute inventory level of 367,000 was a fourth monthly increase.
Sales in all regions declined significantly year-over-year. The Northeast plunged sharply for the second month in a row with a 47.6% drop. The Midwest plunged 44.1%. The South dropped 28.4%. The West declined 11.9%.
Home Builder Confidence: The Housing Market Index – August, 2021
The National Association of Home Builders (NAHB) reported a 5 point drop in the NAHB/Wells Fargo Housing Market Index (HMI) from July’s 75 level. The HMI is approaching last July’s 72 level. HMI was also 72 in March, 2020 just ahead of the pandemic lockdowns that sent sentiment down to historic lows. In other words, builder’s sentiment has essentially normalized. In April, the NAHB pointed to strong demand as a driver boosting confidence despite supply chain issues. May’s report focused on soaring construction costs. June’s report bemoaned all the issues. For July, the NAHB acknowledged the big drop in sentiment with a healthy dose of optimism: “…our expectation is that production bottlenecks should ease over the coming months and the market should return to more normal conditions.” In other words, a comfortable calm awaits just over the horizon.
This optimism aligns with the generally bullish commentary from home builders in the past month or so. These companies have narratives explaining pricing power, solid plans for negotiating supply chain issues, and robust demand. Perhaps not surprisingly then, the “SF Detached Next Six Months (Seasonally Adjusted)” component of the HMI remained flat with June’s level despite the plunges in the other two components. This component expresses sentiment about future sales and has been relatively stable all year. Clearly, builders are little discouraged by the persistent decline in the traffic of prospective buyers.
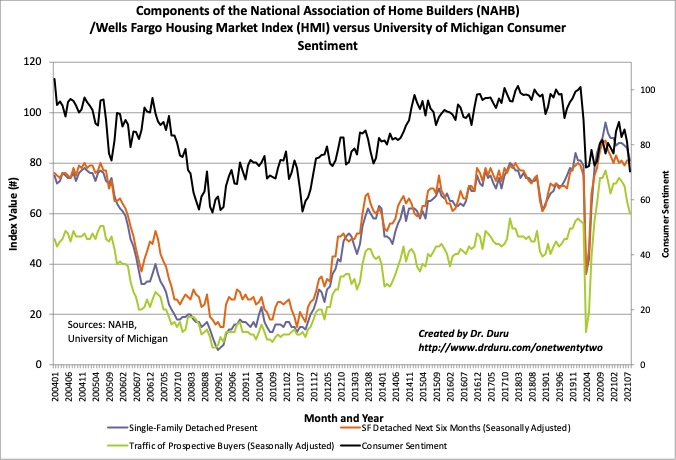
Source for data: NAHB
A plunge in consumer sentiment may belie the resilience in home builder sentiment. Consumer sentiment fell right past the lows from the pandemic-driven lockdowns to levels last seen coming out of the financial crisis. In December, 2011, consumer sentiment sat at 69.9. Surprisingly, this sharp retreat in sentiment had no impact on the stock market in general. Perhaps there is an abiding assumption that consumer sentiment was slammed by the Delta variant of COVID-19 which translates into a temporary disruption. However, fiscal supports for workers and consumers is starting to roll off. Thus, there is no immediate catalyst to boost sentiment like there was last year with major interventions in the economy.
In the last Housing Market Review, I claimed that “sentiment will likely continue drifting lower given slowing new home sales and the necessary time to rebalance the market.” Sentiment may soon stabilize given that two of four regions actually experienced increased sentiment. The Northeast hit a 3 month high with a gain of 3 points. The West clawed up from its low of the year with a 1 point gain. The Midwest and the South drove the declines each with 6 point drops.
Home closing thoughts
Broad-based price increases
The second quarter report on housing prices from the Federal Housing Finance Agency (FHFA) displayed a housing market experiencing broad-based inflationary pressures. Prices have marched higher for 40 straight quarters, essentially ever since the housing market bottomed in 2011. Every single state plus Washington D.C. experienced year-over-year price gains. Similarly, every one of the country’s top 100 metropolitan areas also saw year-over-year price gains. The national year-over-year 17.4% price gain is the largest on record for the FHFA.
The Mountain region has the most interesting market dynamics. People from the Western coast are flocking to the states in this region – Montana, Idaho, Wyoming, Nevada, Utah, Colorado, Arizona, and New Mexico – and driving the biggest price gains among all of the FHFA’s regions. The Mountain region has led all regions in price gains for 15 straight quarters. The second quarter’s year-over-year price jump was 22% for the Mountain region.
Like most economists and market watchers, the FHFA expects these inflationary pressures to cool in the coming months.
A more solid base of demand
Soaring prices remind a lot of folks of the housing bubble that crashed in the financial crisis. However, it is easy to forget that artificial demand from exotic loans to buyers and speculators who otherwise could not afford homes helped to inflate the bubble. This time around, banks are not interested in doling out money to unqualified buyers (indeed, for all practical purposes they are not allowed to do so). Marketplace recently quoted Jessica Lautz with the National Association of Realtors who claimed that “millennials with good credit scores are what’s driving the market now.” Still, the author of the piece could not resist pondering the prospects for a housing correction: “Take away record-low mortgage rates and flexible work from home policies, and you might even see a housing market correction on the horizon. Maybe not a crash, but a soft landing.” Neither of those factors are changing anytime soon.
Be careful out there!
Full disclosure: no positions