
Stock Market Commentary
The stock market melt-up took a one day break. The signs of trouble were ever more clear ahead of the break. Something was wrong with the picture in the stock market. Yet, sellers could barely follow through. The S&P 500 stumbled with a gap down, but buyers stepped right back in at the intraday lows. The buyers just needed the following day to plant the S&P 500 into familiar all-time high territory. The script is also familiar: traders and investors are right back to the regularly scheduled stock market melt-up with shrinking participation.
The Stock Market Indices
The brief bout of selling last week took the S&P 500 (SPY) close to support at its 20-day moving average (DMA) (dotted line below). The index lost 0.9% on that day. Buyers gapped the index the next day to a fresh all-time high like nothing happened.
The NASDAQ (COMPQX) also approached its 20DMA support. Buyers took interest in this level. The tech-laden index ended the week with a fresh closing all-time high and maintained its 20DMA uptrend.
The iShares Trust Russell 2000 Index ETF (IWM) marginally confirmed a 50DMA breakdown in Thursday’s selling. Buyers stepped in and barely gave the bears time to celebrate. IWM closed the week above its 50DMA with a healthy 2.1% gain. The index of small caps remains trapped in a trading range.
Stock Market Volatility
With trouble spreading in the stock market, I gave the volatility index (VIX) one more day to “show off.” Sure enough, the VIX gained 17.3% but could not hold its highs. Faders followed through by plunging the VIX into a full reversal of its gains. The VIX lost 14.8% to close the week and looks ready to churn for a while.
The Short-Term Trading Call For A Melt-Up
- AT40 (T2108) = 43.9% of stocks are trading above their respective 40-day moving averages
- AT200 (T2107) = 72.3% of stocks are trading above their respective 200-day moving averages (TradingView’s calculation)
- Short-term Trading Call: neutral
The persistent weakening in AT40 (T2108), the percentage of stocks trading above their respective 40DMAs, kept me wary of the stock market rally. As trouble spread in the stock market, I claimed the following: “A downtrend remains well intact and the lows of the year are getting beaten over and over again. At some point, a rush to oversold territory seems like it has to come within the next month or two. These lows for AT40 on the year look weaker and weaker as support.” That rush essentially happened the very next day. AT40 gapped down and opened around 27%. Buyers took over from there. By the end of the week, my favorite technical indicator soared all the way back to 43.9%.
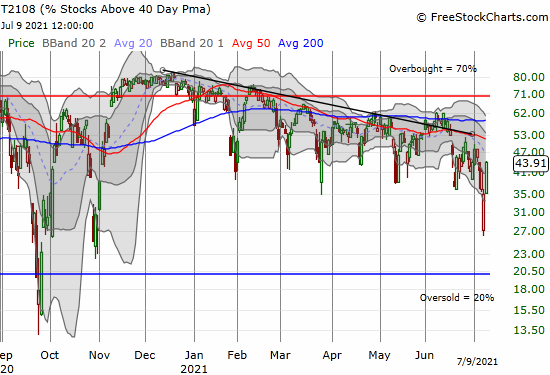
In a bull market, a drop into the 20s is “close enough” to oversold, so I quickly closed several short positions and took profits on put options. I also nibbled away on stocks and call options on my shopping list. The market rewarded my discipline with the return to the regularly scheduled stock market melt-up. While AT40’s surge off the bottom represents a broad base of buying interest, the underlying weakening in market breadth remains.
Even with the S&P 500 and the NASDAQ reaching new closing all-time highs, AT40 lost almost 4 percentage points from the previous week’s close. Moreover, AT200 (T2107), the percentage of stocks trading above their respective 200DMAs, lost almost three percentage points. Both indicators remain stuck in ominous downtrends. As a result, I am keeping the short-term trading call neatly tucked into neutral territory. I am bracing for a true oversold reading in the next month or two.
Stock Chart Video Review
Stock Chart Reviews – Below the 50DMA
Encore Wire Corporation (WIRE)
Encore Wire Corporation (WIRE) manufactures electrical building wires and cables for interior electrical wiring. Accordingly, WIRE could be a housing play. The stock’s valuation remains low at 15.2x trailing earnings, 1.1x sales, and 1.7x book. As the market leaves these kinds of industrial stocks behind, I am looking to buy the dip, hopefully around 200DMA support (the blue line below). In the meantime, WIRE is technically a short given the short-term downtrend following the confirmed 50DMA breakdown. I will not short WIRE because I want to stay focused on this stock as a buying opportunity.
Acuity Brands, Inc. (AYI)
Commercial and industrial lighting company Acuity Brands, Inc. (AYI) confirmed a 50DMA breakdown at the beginning of last week. The stock suffered a 5.8% post earnings loss on the 50DMA breakdown. As a result, AYI has likely topped out for the time being. AYI has already nearly reversed its incremental post-earnings gains. I am watching to see whether it starts to reverse the 13.3% 1-day post-earnings gain from April.
Fluor Corporation (FLR)
Almost two years ago I said the following about Fluor Corporation (FLR): “The on-going collapse in FLR continues to astound me, and I cannot help thinking that several years from now these prices will look like obvious bargains. Otherwise, I am betting on a company that is heading into some kind of complete economic/business calamity.” Since then, I finally gave up on FLR and the stock is trading at the same levels as two years ago. FLR lost 20.4% on May 13th after announcing a private placement of 450,000 shares of a newly created series of convertible preferred stock. FLR has not been the same since.
Technically, FLR is a short with a confirmed 200DMA breakdown. However, the previous two days of defending the 2021 lows looks like a sustainable bottom. Thus, a short has a tight leash: a stop above the 200DMA and take profits close to $16.
Micron Technology (MU)
A 5.7% post-earnings loss ended a brief 50DMA breakout for Micron Technologies (MU). After the stock bounced off 200DMA support, I bought a July 16 $82 / July 23 $80 call spread as a low risk way of playing the modest upside of a challenge of downtrending 50DMA resistance.
U.S. Global Jets ETF (JETS)
During an oversold bounce, bargain hunters may rush for beaten up stocks. U.S. Global Jets ETF (JETS) has under-performed since hitting its last peak in March and looks a bit beaten-up after almost non-stop selling for a month. Buyers stepped in at the test of 200DMA support. I am a buyer here with a tight stop below $23, the intraday low from last week.
United States Steel Corporation (X)
On Wednesday, Credit Suisse claimed steel stocks still have plenty of upside. The analyst took his price target on U.S. Steel Corporation (X) from $35 to $41, apparently a Wall Street high. Since the stock clearly did not respond much to the original $35 target, I am not surprised that the stock only gained 2.0% on the even higher price target. With a gap down the next day, I even bought a few July put options on U. S. Steel. Not long ago, I would have instead bought call options on expectations for a rebound. Sure enough, X jumped 8.4% to close the week just under 50DDMA resistance.
Stock Chart Reviews – Above the 50DMA
Apple (AAPL)
The Apple Trading Model (ATM) is back. Over four weeks of near non-stop buying made buying anywhere a winning strategy. I missed buying into the brief pullback on Thursday because the gap down made Apple (AAPL) look topped out with an abandoned baby top. It was a moment where I mistakenly allowed inserted discretion into the rules of the ATM. So instead of buying outright calls on the cheap on Thursday, I bought a July 16 $150 / July 23 $147 calendar call spread on Friday. AAPL closed the week right at its former intraday all-time high.
BHP Group Limited (BHP)
Diversified commodities company BHP Group Limited (BHP) returned to a bullish position with a gap up over 50DMA resistance. I am a buyer of shares here with an eye to an eventual breakout above the double-top from March and May peaks. My stop loss is a complete reversal of Friday’s breakout.
Tesla (TSLA)
Fortunately, I remained patient through the recent breakout for Tesla (TSLA). Last week’s selling took TSLA from consolidation into a test of converged support from its 50 and 200DMAs. I bought a July 16 $690 / July 23 $690 calendar call spread on Friday’s confirmation of a successful test. I chose this configuration because I expect TSLA to grind slowly higher with $690-700 as a ceiling for at least the coming week.
Fastly (FSLY)
Fastly (FSLY) rebounded off 50DMA support on Thursday and confirmed a successful test with Friday’s 2.6% gain. I am a buyer here with a tight stop below 50DMA support.
Advanced Micro Devices Inc. (AMD)
Advanced Micro Devices Inc. (AMD) went right back to sleep last week including a 4.2% 1-day loss. I did not see news but perhaps the selling was related to the near closing of the deal to buy Xilinx (XLNX). I bought call options on Thursday as I saw buyers taking the stock up from just above 20DMA support. My target for AMD sits at an attempt to reverse last week’s losses.
Be careful out there!
Footnotes
“Above the 40” (AT40) uses the percentage of stocks trading above their respective 40-day moving averages (DMAs) to measure breadth in he stock market. Breadth indicates the distribution of participation in a rally or sell-off. As a result, AT40 can identify extremes in market sentiment that are likely to reverse. Above the 40 is my alternative name for “T2108” which was created by Worden. Learn more about T2108 on my T2108 Resource Page. AT200, or T2107, measures the percentage of stocks trading above their respective 200DMAs.
Active AT40 (T2108) periods: Day #171 over 20%, Day #155 above 30%, Day #1 over 40% (overperiod), Day #10 under 50% (underperiod), Day #22 over 60%, Day #84 under 70%


Black line: AT40 (T2108) (% measured on the right)
Red line: Overbought threshold (70%); Blue line: Oversold threshold (20%). Chart always show the latest download date. Source: FreestockCharts
Source for charts unless otherwise noted: TradingView.com
Grammar checked by Grammar Coach from Thesaurus.com
Full disclosure: long UVXY call spread, long AAPL calendar call spread, long TSLA calendar call spread, long MU calendar call spread, long X puts, long AMD calls
FOLLOW Dr. Duru’s commentary on financial markets via StockTwits, Twitter, and even Instagram!
*Charting notes: Stock prices are not adjusted for dividends. Candlestick charts use hollow bodies: open candles indicate a close higher than the open, filled candles indicate an open higher than the close.