
Stock Market Commentary
I feel like a broken record pointing out the shrinking participation accompanying the stock market’s persistent rally. However, the downtrend in market breadth becomes more and more notable over time. More signals converged this week of eroding underlying conditions despite the all-time highs on the S&P 500 and the NASDAQ. Even the currency and bond markets chimed in to signal that something is wrong with this stock market picture.
The Stock Market Indices
The S&P 500 (SPY) continued its almost predictable stubborn behavior. Not only did the index rebound from a slight bout of the sniffles on Tuesday, but also the S&P 500 pushed on for a new all-time high the next day. The S&P 500 has no oil stains on its sleeves.
The NASDAQ (COMPQX) did the S&P 500 one better. Its Tuesday rebound took the tech-laden index to a fresh all-time high. Buyers bounced back again the next day but could do no more than a flat close.
The iShares Trust Russell 2000 Index ETF (IWM) is again diverging from its bigger cousins. Sellers pushed IWM downward each day this week. IWM closed the day below its 50-day moving average (DMA) (the red line below) with a 0.9% loss. At least this time around I was not fooled into chasing IWM into chasing a phantom breakout from the trading range. IWM starts off the string of blemishes that say there is something wrong with this stock market picture.
Stock Market Volatility
Something is wrong with the picture when the volatility index (VIX) surges while the S&P 500 and the NASDAQ remain chill. The VIX gained 19.4% and even closed near its high. However, it stopped just short of the important 20 level of “elevated” volatility. With this latest bounce, the VIX continued a pattern I have noted of plunging into a consolidation and then surging all over again for a brief spurt. If past is prologue, then the VIX has maybe one more day to show off. Unless the VIX soars past the last high, I will continue to hold my September UVXY call spread as a hedge.
The Short-Term Trading Call While Something Is Wrong
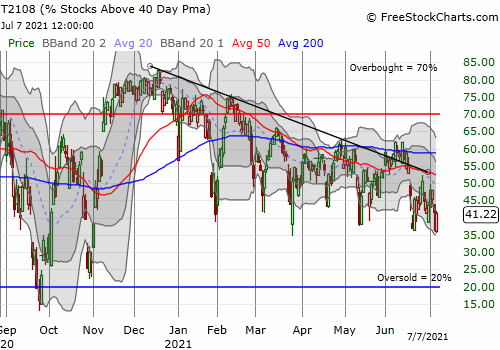
- AT40 (T2108) = 41.2% of stocks are trading above their respective 40-day moving averages
- AT200 (T2107) = 71.1% of stocks are trading above their respective 200-day moving averages (TradingView’s calculation)
- Short-term Trading Call: neutral
AT40 (T2108), the percentage of stocks trading above their respective 40DMAs, lost another 7 percentage points this week despite the levitation of the S&P 500 and the NASDAQ. Something is wrong with this picture. If only AT40 closed notably down at least one of the last two trading days, I would have declared a bearish divergence; I could have done so on Monday. Still, AT40 adds one more blemish to suggest there is something wrong with the stock market. A downtrend remains well intact and the lows of the year are getting beaten over and over again. At some point, a rush to oversold territory seems like it has to come within the next month or two. These lows for AT40 on the year look weaker and weaker as support. Of course, if support holds, I expect a rebound at least back to the former downtrend (black diagonal line below).
AT200 (T2107), the percentage of stocks trading above heir respective 200DMAs, is still keeping me wary. This longer-term measure of breadth in the stock market closed at 71.1%, an eye-popping 8-month low. While 71.1% seems high, the situation is clearly precarious given the downtrend all year. Moreover, AT200 is now officially working on a complete reversal of its November breakout. See the chart at the end of this post.
At the time of writing the Australian dollar is plunging against the Japanese yen (AUD/JPY). This breakdown in risk appetite further confirms for me that something is wrong with the picture in the stock market. AUD/JPY is trading at a 5-month low and has fully confirmed its 50DMA breakdown. (See Why the Australian Dollar and Japanese Yen Matter for Stock Traders to understand the importance of AUD/JPY as an indicator of risk-on, risk-off sentiment).
Stock Chart Reviews – Below the 50DMA
Wynn Resorts Limited (WYNN)
So many reopening trades stumbled and tumbled this week. Wynn Resorts Limited (WYNN) is a stock taking a particularly hard beating. WYNN accelerated to the downside the last two days and almost tested 200DMA support. I am carefully watching this trading action. I prefer to buy a confirmed test of 200DMA support. However, I will go short on a confirmed 200DMA breakdown as long as AT40 is not “too close” to oversold trading conditions.
Stock Chart Reviews – Above the 50DMA
iShares 20+ Year Treasury Bond ETF (TLT)
The economy is supposedly barreling through a robust recovery, and yet bond yields are rushing lower. Something is wrong with this picture! I heard that perhaps a big short squeeze is on for the crowded trade shorting bonds out of inflation expectations. Even if this explanation holds, the market should not have enough participants interested in buying bonds for a squeeze with a strong recovery and inflationary pressures ahead. I think it is very possible that the bond market is warning of trouble ahead.
Still, I took profits on my TLT call spread. I held on during the last surge, but I was compelled to exit here at resistance and with Federal Reserve meeting minutes getting released. The Fed minutes turned out to be a non-event.
Be careful out there!
Footnotes
“Above the 40” (AT40) uses the percentage of stocks trading above their respective 40-day moving averages (DMAs) to measure breadth in he stock market. Breadth indicates the distribution of participation in a rally or sell-off. As a result, AT40 can identify extremes in market sentiment that are likely to reverse. Above the 40 is my alternative name for “T2108” which was created by Worden. Learn more about T2108 on my T2108 Resource Page. AT200, or T2107, measures the percentage of stocks trading above their respective 200DMAs.
Active AT40 (T2108) periods: Day #169 over 20%, Day #153 above 30%, Day #13 over 40% (overperiod), Day #8 under 50% (underperiod), Day #20 over 60%, Day #82 under 70%


Black line: AT40 (T2108) (% measured on the right)
Red line: Overbought threshold (70%); Blue line: Oversold threshold (20%). Chart always show the latest download date. Source: FreestockCharts
Source for charts unless otherwise noted: TradingView.com
Grammar checked by Grammar Coach from Thesaurus.com
Full disclosure: long UVXY call spread
FOLLOW Dr. Duru’s commentary on financial markets via StockTwits, Twitter, and even Instagram!
*Charting notes: Stock prices are not adjusted for dividends. Candlestick charts use hollow bodies: open candles indicate a close higher than the open, filled candles indicate an open higher than the close.