
Stock Market Statistics
- AT40 = 79.6% of stocks are trading above their respective 40-day moving averages (DMAs) (Day #10 overbought)
- AT200 = 77.7% of stocks are trading above their respective 200DMAs (7 1/2 year high)
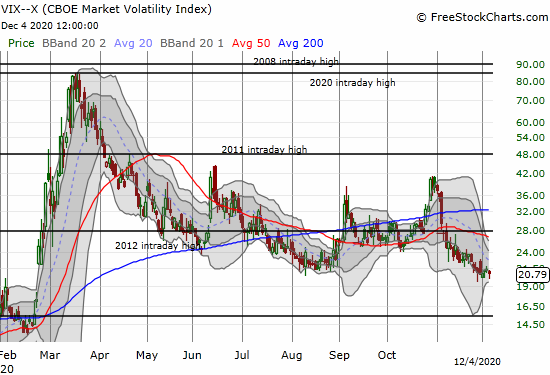
- VIX = 20.8
- Short-term Trading Call: neutral
Stock Market Commentary
A week ago, the overbought stock market stretched for a fresh rally. The trading action last week turned that stretch into a bridge to a fresh set of all-time highs. The stock market stretched into an extended overbought rally. These price moves provide a fresh reminder that overbought conditions are not automatic bearish or sell signals.
The Stock Market Indices
In my last Above the 40 post, I claimed that the S&P 500 (SPY) looked ready to “sneak its way to the top of its upper Bollinger Band (BB).” The sneak transformed into an all-out sprint. The week closed with a 0.9% gain that tapped the upper-BB. The index delivered a friendly knock at the door of extended gains.

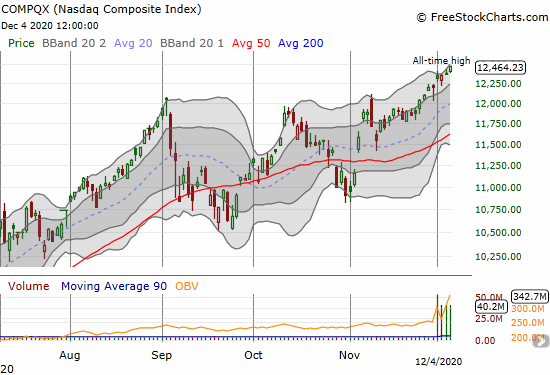
The NASDAQ (COMPQX) put aside all pleasantries and launched into its upper-BB on Tuesday of last week. Tech buyers have been aggressive enough to keep the tech-laden index hitting the upper-BB on each trading day in December so far.
Stock Market Volatility
The volatility index (VIX) continues to churn around the 20 threshold. The VIX remains the last obstacle between a drift upward through extended overbought conditions and a relentless push. If the VIX breaks below 20, I fully expect an on-going downtrend back to the now long-forgotten 15.35 pivot. Such a downtrend would be a freshly bullish development. However, since the VIX continues to linger at the 20 threshold, I am keeping my peripheral vision on alert for a “last gasp” surge in volatility. As a reminder, traders conventionally treat the 20 level as a threshold defining “elevated” volatility conditions.
The Short-Term Trading Call: Extended Overbought Rally

AT40 (T2108), the percentage of stocks trading above their respective 40DMAs, closed at 79.6% for the second straight week. After languishing marginally for much of the week, my favorite technical indicator took a leap to make it back to the previous week’s close. AT200 (T2107), the percentage of stocks trading above their respective 200DMAs, closed at a fresh 7 1/2 year high. AT200 confirmed the strong underlying trading conditions that have coalesced into an extended overbought rally. More and more stocks continue to enter longer-term bullish territory.
At this point, only a correction out of this an extended overbought rally can flip my trading call back to bullish. On the other hand, I am nowhere close to interested in the bearish case. Sellers have a LOT to prove to undermine the current technical strength of the stock market. They first need to bring this an extended overbought rally to a definitive end.
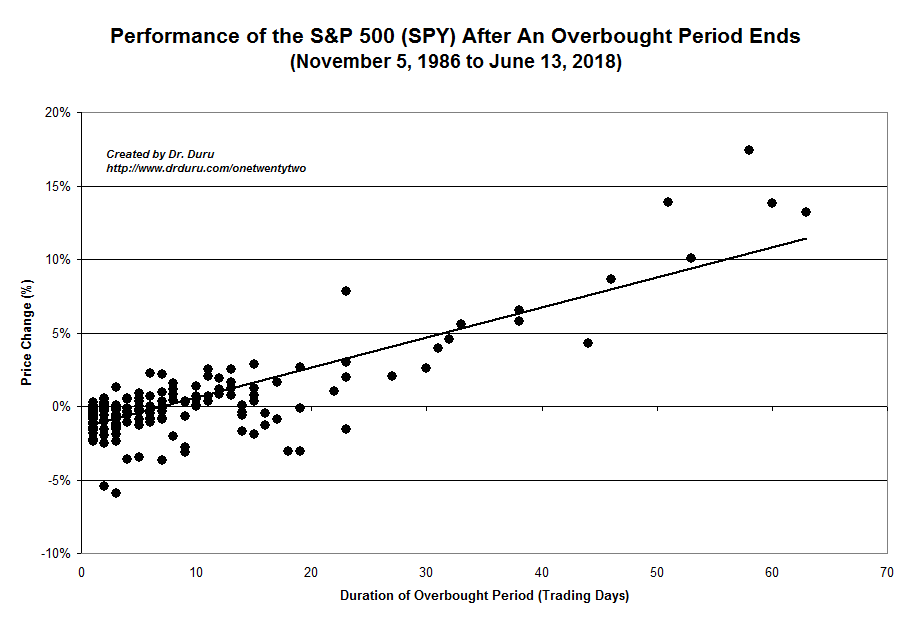
The S&P 500 is on day #15 of overbought conditions. The index has 3.2% in gains since overbought trading resumed on November 13th. The chart below shows that the S&P 500 is about five trading days away from erasing all but the most extreme case for a negative return to the overbought period.
Stock Chart Video Review
Stock Chart Reviews – Below the 50DMA
Nikola (NKLA)
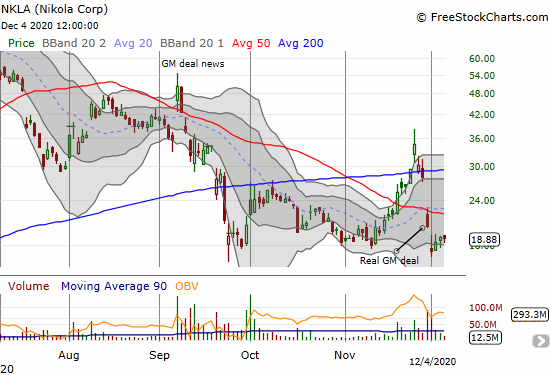
My low risk trade on Nikola (NKLA) came right at the stock’s recent peak. The subsequent 4-day plunge nearly split the stock in half and included a greatly reduced deal with General Motors (GM). Over that period, I flipped put options twice, took profits on the short call, and ended up with two Dec $15 puts and my original shares. I am now facing the need to plan for what to do, if anything, after these last tranche of puts expire. NKLA has hope if it somehow holds current support. If not, I see no point in continuing to speculate on NKLA. A break of this support opens a near bottomless pit for this controversial EV company.
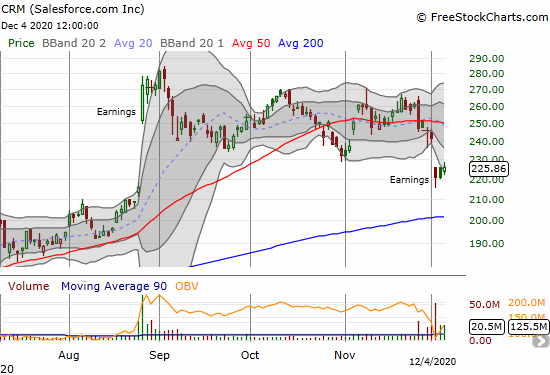
Salesforce.com (CRM)
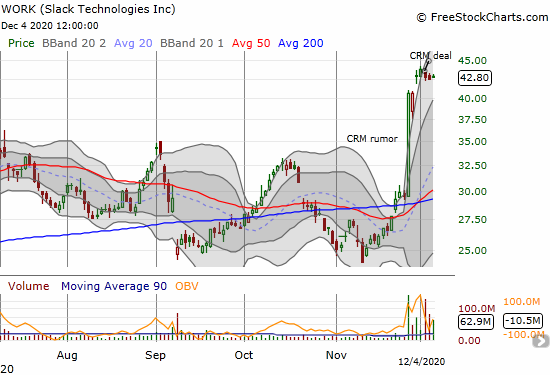
Shortly after Slack Technologies (WORK) reported September earnings, I wrote an early eulogy for the company. I completely forgot to take into account the potential willingness of some big tech company to overpay for Slack’s future. Salesforece.com (CRM) nominated itself for the position.
CRM promptly lost 5.4% on rumors of the deal to acquire WORK. As part of my on-going disbelief, I bought CRM shares into the dip. I assumed that once the company disavowed the rumors, the stock would rebound quickly. Instead, CRM confirmed the rumors by announcing the deal alongside its latest quarterly report. Investors proceeded to pound the stock even more. CRM is a software behemoth so further growth gets harder and harder to accomplish. Clearly, the company is trying to buy its way to more growth. For Slack, this deal is exactly what the doctor ordered.
Stock Chart Reviews – Above the 50DMA
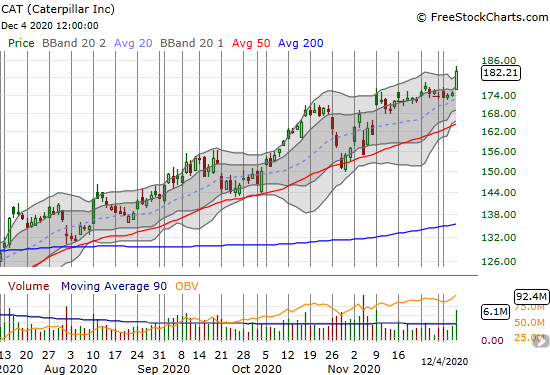
Caterpillar (CAT)
The industrial plays had another good week. After listlessly trickling around, Caterpillar (CAT) woke up again with a 4.3% gain on Friday. I was ready with a fistful of call options expiring the following Friday and took profits. I remain primed to buy into the next entry point – buy the dips from here…
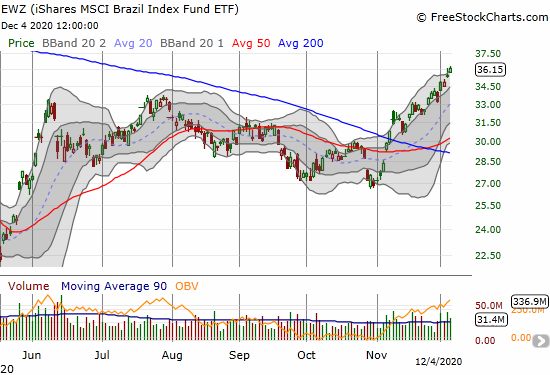
iShares MSCI Brazil Index Fund ETF (EWZ)
At the beginning of October, I targeted iShares MSCI Brazil Index Fund ETF (EWZ) for a fresh buy as part of my rule to buy 20% pullbacks. EWZ proceeded to rebound before triggering the rule. Overhead resistance at the 50DMA held, and EWZ traded marginally lower toward the end of October. Yet, EWZ still did not quite trigger the rule. The Brazilian ETF has not looked back since. I should have been less strict on the rule (EWZ made it to a 19.8% pullback), and I should have been willing to buy the 200DMA breakout last month. EWZ is part of a surging trade in emerging markets as the U.S. dollar (DXY) gets crushed in currency markets.
Microstrategy Inc (MSTR)
Speaking of a U.S. dollar getting crushed…Microstrategy (MSTR) is riding the surge in Bitcoin (BTC/USD) as a way to protect its balance sheet. The Business Analytics software company is one of the more fascinating recipients of Bitcoin spoils. The company’s CEO, Michael Saylor, invested the $500M in cash on the balance sheet in Bitcoin to protect against currency debasement.
The interview below on CNBC’s Fast Money was quite intriguing. The CEO would not admit it, but his company has essentially become a Bitcoin investment vehicle which happens to sell software on the side.

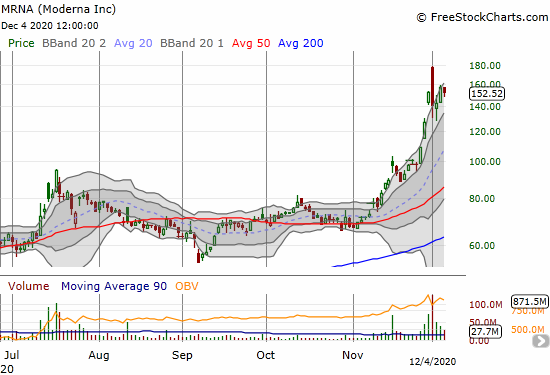
Moderna (MRNA)
Speaking of parabolic run-ups, Moderna (MRNA) came alive again last month and lately accelerated higher on what I interpret as different flavors of the same news: a highly effective vaccine against the coronavirus (COVID19) is on its way. I bought a calendar put spread at the $130 strike at the end of what turned out to be the second day of a 3-day parabolic rise. The subsequent bearish engulfing top put the spread back into play. I decided to hold for follow-through. Instead, MRNA pulled off an impressive recovery. The speculators are strong in this one.
Slack Technologies Inc (WORK)
Some last words on Slack Technologies (WORK)…The stock rebounded smartly from its last post-earnings sell-off (in September). I was not surprised when the stock fell right back to those lows. However, looking back, WORK was yet one more demonstration of the value in buying into 200DMA breakouts. Last month’s 200DMA breakout would have positioned a trader for the CRM deal. That surge more than makes up for the false 200DMA breakout in October.
Fastly (FSLY)
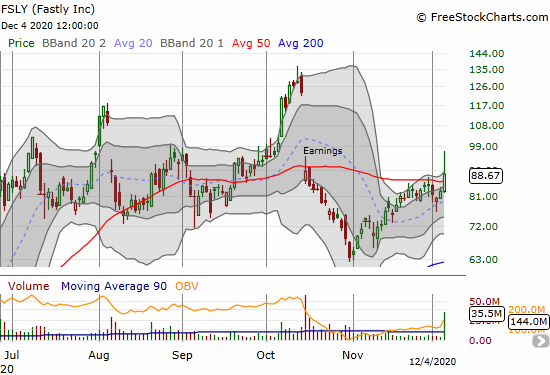
Speaking of buyouts of extremely expensive companies….Fastly (FSLY) pulled off a 50DMA breakout on the backs of M&A rumors. I happened to catch the news alert early enough to buy just as FSLY broke out above its 50DMA. That breakout, along with a surge in call option volume, convinced me to jump into the fray. However, I played it with a covered call position in case the rumors fall apart in the coming week. Even without an imminent buyout, FSLY is looking good again. I did not expect a recovery anytime soon after October’s post-earnings collapse (the label “earnings” should read “earnings warning”).
Nordstrom (JWN)
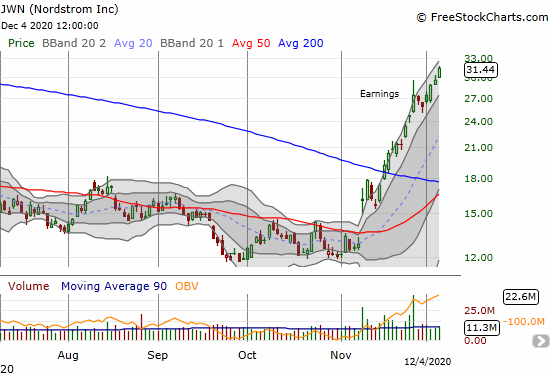
The rise in Nordstrom (JWN) remain relentless. I finally had to relent and get a position done. I bought shares and sold a December call option against it. Hopefully, the stock delivers a pullback. If a pullback does not happen in the near-term, at least I will sneak out a bit of profit. Since the 200DMA breakout about three weeks ago, JWN has gained 65.5%. Have I mentioned the benefits of buying 200DMA breakouts before…?
— – —
FOLLOW Dr. Duru’s commentary on financial markets via email, StockTwits, Twitter, and even Instagram!
“Above the 40” uses the percentage of stocks trading above their respective 40-day moving averages (DMAs) to assess the technical health of the stock market and to identify extremes in market sentiment that are likely to reverse. Abbreviated as AT40, Above the 40 is an alternative label for “T2108” which was created by Worden. Learn more about T2108 on my T2108 Resource Page. AT200, or T2107, measures the percentage of stocks trading above their respective 200DMAs.
Active AT40 (T2108) periods: Day #38 over 20%, Day #22 above 30%, Day #21 over 40%, Day #20 over 50%, Day #19 over 60%, Day #15 over 70%
Daily AT40 (T2108)
")
Black line: AT40 (T2108) (% measured on the right)
Red line: Overbought threshold (70%); Blue line: Oversold threshold (20%)
Weekly AT40 (T2108)

*All charts created using FreeStockCharts unless otherwise stated
The T2108 charts above are my LATEST updates independent of the date of this given AT40 post. For my latest AT40 post click here.
Be careful out there!
Full disclosure: long UVXY, long MRNA put, long NKLA shares and puts, long CRM shares and calls, long JWN and short call, long FSLY shares and short call
*Charting notes: FreeStockCharts stock prices are not adjusted for dividends. TradingView.com charts for currencies use Tokyo time as the start of the forex trading day. FreeStockCharts currency charts are based on Eastern U.S. time to define the trading day.