
Stock Market Statistics
- AT40 = 76.6% of stocks are trading above their respective 40-day moving averages (DMAs) (Day #6 overbought)
- AT200 = 71.8% of stocks are trading above their respective 200DMAs (near 3-year high and holding breakout above post financial crisis downtrend)
- VIX = 23.7
- Short-term Trading Call: neutral
Stock Market Commentary
The stock market started last week with a bang and ended with a whimper. The week started with another “good news Monday” as Moderna (MRNA) announced a 94.5% effectiveness for its coronavirus vaccine. MRNA gained 9.6% on the day but faded well off its highs. MRNA filled the rest of the gap up in two more trading days. The S&P 500 (SPY) was down for the week at the close Wednesday and ended the week slightly lower on Friday.
The Stock Market Indices
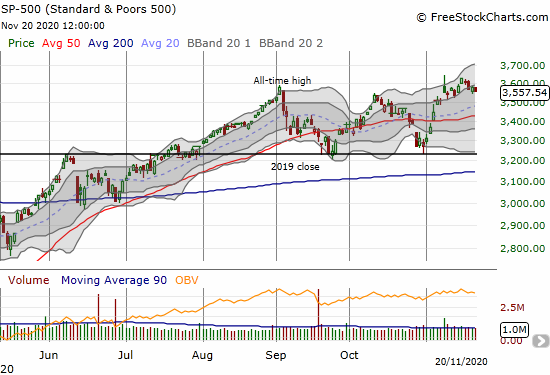
The bang took the S&P 500 (SPY) to a new (marginal) all-time high but not a new all-time high. The index looks ready for extended churn for Thanksgiving week as it closed below its lower Bollinger Band (BB) for the first time since early November.
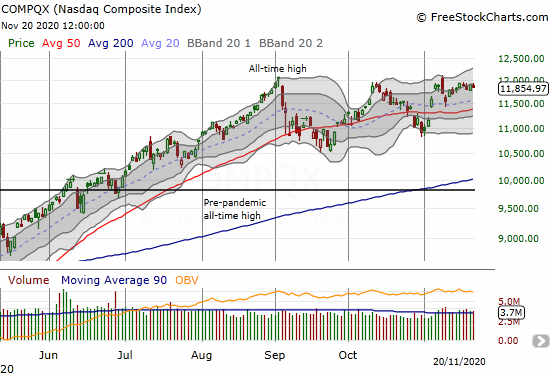
The NASDAQ (COMPQX) did not participate in the week’s bang or the whimper. The tech-laden index just churned listlessly in an extremely tight range all week.
Stock Market Volatility
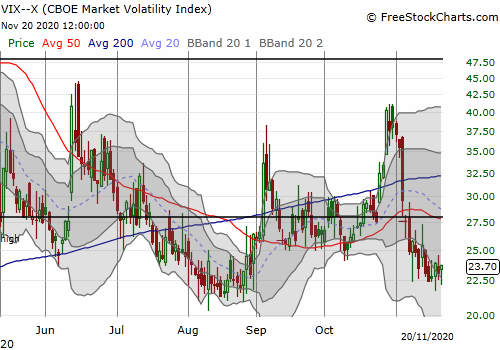
The volatility index (VIX) also stuck to a range all week. Monday’s close was the lowest of the week. From there, the VIX did its best to levitate above the August (and pandemic) lows.
The Short-Term Trading Call: Overbought Despite the Whimper from A Bang

Despite the fade on the S&P 500 and the listlessness of the NASDAQ, stock market breadth improved on balance. AT40 (T2108), the percentage of stocks trading above their respective 40DMAs, closed with a net gain for the week at 76.6%. My favorite technical indicator stayed overbought the entire week. This resilience implies that the trades on a reopening economy remain alive and well.
The short-term trading call sits comfortably at neutral. I see little reason to get aggressive on the long side. I am also quite content to wait for the overbought period to end before contemplating a change to the trading call (to some flavor of bearish).
Stock Chart Reviews – Below the 50DMA
Home Depot (HD)
Home Depot (HD) hit an all-time high in August. Since then, the stock has pivoted around its 50DMA in a 3+ month long trading range. If not for the big 5.0% loss on the big rotation from two Mondays ago, I would look to buy with the stock near the bottom of the trading range. Instead, I am anticipating an eventual test of 200DMA support.

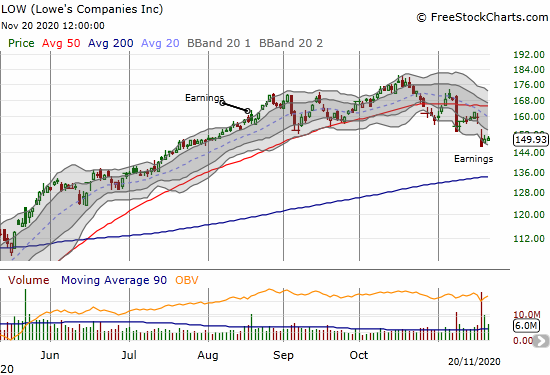
Lowe’s Companies (LOW)
The trading action in Lowe’s Companies (LOW) makes me even more reluctant to rush into HD at this juncture. LOW suffered a massive 8.9% loss on the big rotation Monday. A post-earnings gap down and 8.2% loss definitively confirmed the 50DMA breakdown. LOW now has a short-term downtrend in place and should test its 200DMA support well ahead of HD.
Stock Chart Reviews – Above the 50DMA
Peloton Interactive (PTON)
Peloton (PTON) barely qualified for this section. The stock rallied through the week to close a hair above its 50DMA. A higher close gets me buying the stock and/or call options. The CNBC Options Action gang is already prepared to pounce on PTON by going short a put spread.

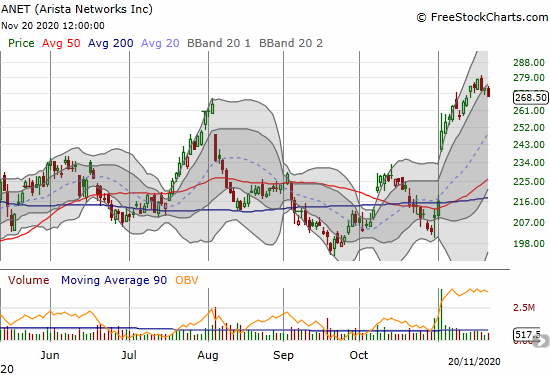
Arista Networks Inc (ANET)
Cloud networking company Arista Networks Inc (ANET) gapped up and gained 15.4% post-earnings to start November trading. Buyers finally slowed down this week. With a close below the upper-BB, I am looking for a pullback toward the uptrending 20DMA for a buying opportunity.
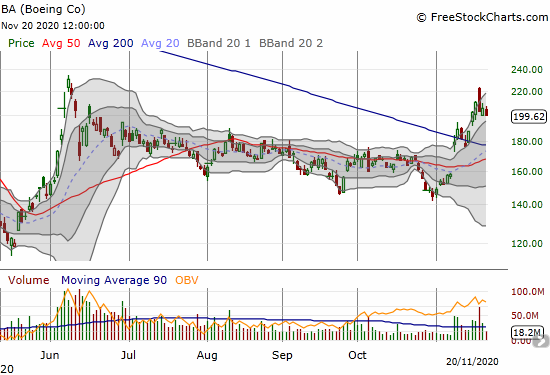
Boeing (BA)
Plane manufacturer Boeing (BA) received good news on Wednesday with certification of the much maligned 737 Max. The stock initially responded with a bang and a strong gap up. Sellers stepped in from there and closed BA with a whimper and a loss on the day. This is a poor reaction further accentuated by Friday’s 2.9% loss. Still, I decided to jump in with a weekly $220 calendar call spread with the short side expiring this coming Friday. I am looking for BA to mostly churn this coming week before resuming its upward momentum for a punch through the June high.
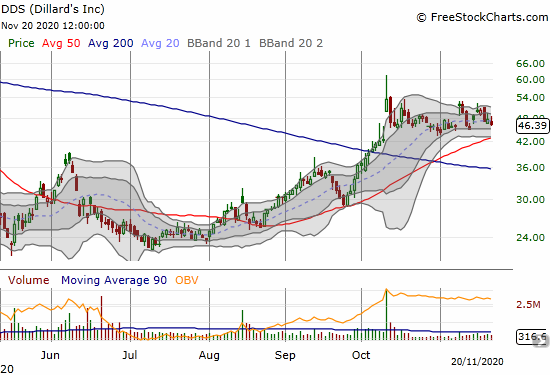
Dillard’s Inc (DDS)
Ever since department store Dillard’s Inc (DDS) gained 27.0% in mid-October, the stock has failed to make further progress. This trading action looks like a coiled spring. A test of 50DMA support may provide the spark for a relaunch. DDS sprung to life on news that Ted Weschler, and investment manager at Berkshire Hathaway (BRK.A), established a 5.89% stake in the stock.
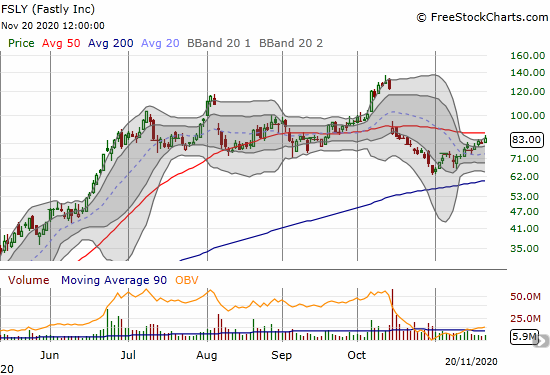
Fastly (FSLY)
Content Delivery Network (CDN) company Fastly (FSLY) is on a comeback trail earlier than I expected. The stock closed the week just under 50DMA resistance. I am a buyer on a close above the 50DMA.
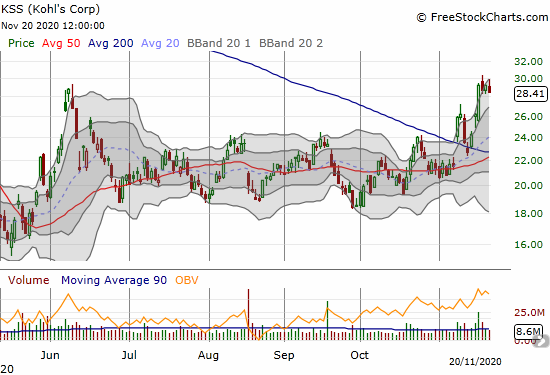
Kohl’s Corp (KSS)
Big box retailer Kohl’s Corp (KSS) got just enough momentum last week to finally overcome the June high for a hot minute. KSS gained 11.6% post-earnings and is a buy on dips from here for aggressive traders. I prefer to wait until a clear hurdle above the June high and last week’s intraday high. Note that 50 and 200DMA supports are converging.
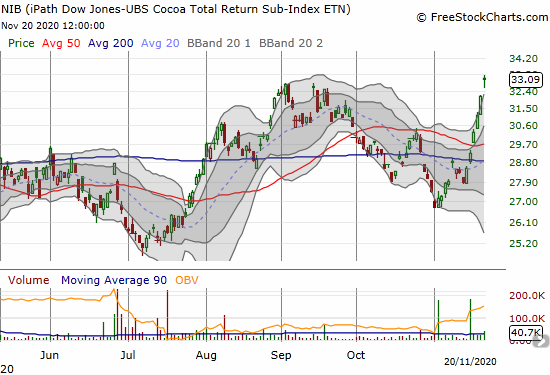
NIB iPath Dow Jones UBS Cocoa Total Return Sub Index (NIB)
Last week was one of those week’s I was glad I maintain a strategy of accumulating NIB iPath Dow Jones UBS Cocoa Total Return Sub Index (NIB) on the dips. The ETN shot straight up as Hershey’s (HSY) bought up cocoa futures in an attempt to avoid paying a price premium to Ivory Coast and/or Ghana. I sold my holdings into Friday’s gap up as I think this frenzy is unsustainable, especially given this run-up will send futures zipping by the premium from the fixed price from the West African governments….if this overshoot has not already happened.
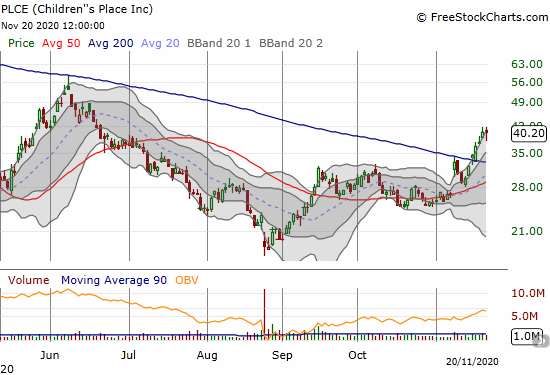
Children’s Place (PLCE)
Clothing retailer Children’s Place (PLCE) confirmed a 200DMA breakout. I am a buyer here with a plan to accumulate down to $35. PLCE “survived” an earnings report on Thursday.
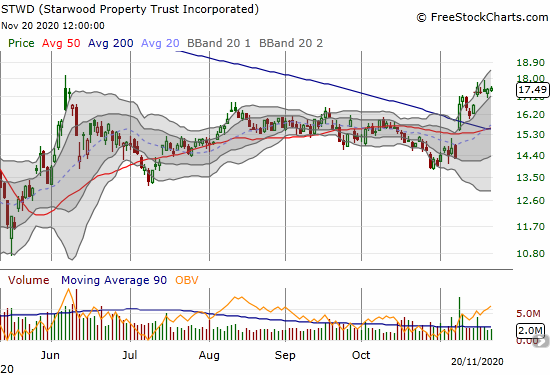
Starwood Property Trust Incorporated (STWD)
Hotel Real Estate Investment Trust (REIT) Starwood Property Trust Incorporated (STWD) woke up with the reopen trade. Monday’s bang delivered a solid confirmation to the 200DMA breakout earlier in the month. I bought shares after the March stock market collapse. I am waiting to buy more after STWD maintains a close above the June high.
Valero Energy (VLO)
Oil refiner and gasoline retailer Valero Energy (VLO) soared 9.3% on Monday’s bang for reopen stocks. The whimper the rest of the week quickly wiped out all the gains. However, the trading action since the 50DMA breakout looks convincing enough to get me re-accumulating shares this week in anticipation of a sustained 200DMA breakout.

— – —
FOLLOW Dr. Duru’s commentary on financial markets via email, StockTwits, Twitter, and even Instagram!
“Above the 40” uses the percentage of stocks trading above their respective 40-day moving averages (DMAs) to assess the technical health of the stock market and to identify extremes in market sentiment that are likely to reverse. Abbreviated as AT40, Above the 40 is an alternative label for “T2108” which was created by Worden. Learn more about T2108 on my T2108 Resource Page. AT200, or T2107, measures the percentage of stocks trading above their respective 200DMAs.
Active AT40 (T2108) periods: Day #29 over 20%, Day #13 above 30%, Day #12 over 40%, Day #11 over 50%, Day #10 over 60%, Day #6 over 70%
Daily AT40 (T2108)
")
Black line: AT40 (T2108) (% measured on the right)
Red line: Overbought threshold (70%); Blue line: Oversold threshold (20%)
Weekly AT40 (T2108)

*All charts created using FreeStockCharts unless otherwise stated
The T2108 charts above are my LATEST updates independent of the date of this given AT40 post. For my latest AT40 post click here.
Be careful out there!
Full disclosure: long UVXY, long BA calls, long STWD
*Charting notes: FreeStockCharts stock prices are not adjusted for dividends. TradingView.com charts for currencies use Tokyo time as the start of the forex trading day. FreeStockCharts currency charts are based on Eastern U.S. time to define the trading day.