
Stock Market Statistics
AT40 = 53.9% of stocks are trading above their respective 40-day moving averages (DMAs) (2-month low)
AT200 = 25.6% of stocks are trading above their respective 200DMAs
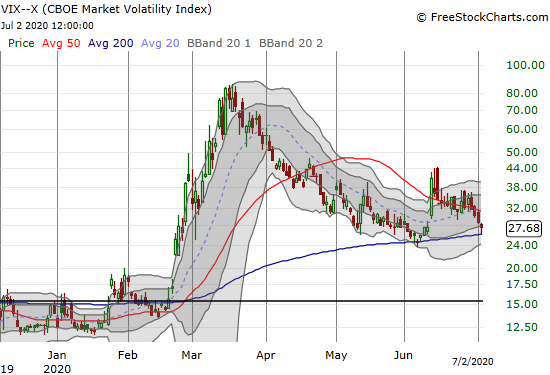
VIX = 34.7
Short-term Trading Call: neutral
Stock Market Commentary
The damage in the stock market the previous week looked strong enough to eventually take trading conditions toward or to oversold levels. The market was on edge, and the S&P 500 (SPY) in particular looked ready to break down.
Instead, the following week a rebound started right from the open with buyers taking the index right to its 200-day moving average (DMA). There was almost no hesitation the rest of the week. On Wednesday, the major indices finished a complete flip from short-term downtrends to short-term uptrends (recall that I ignore the Dow).
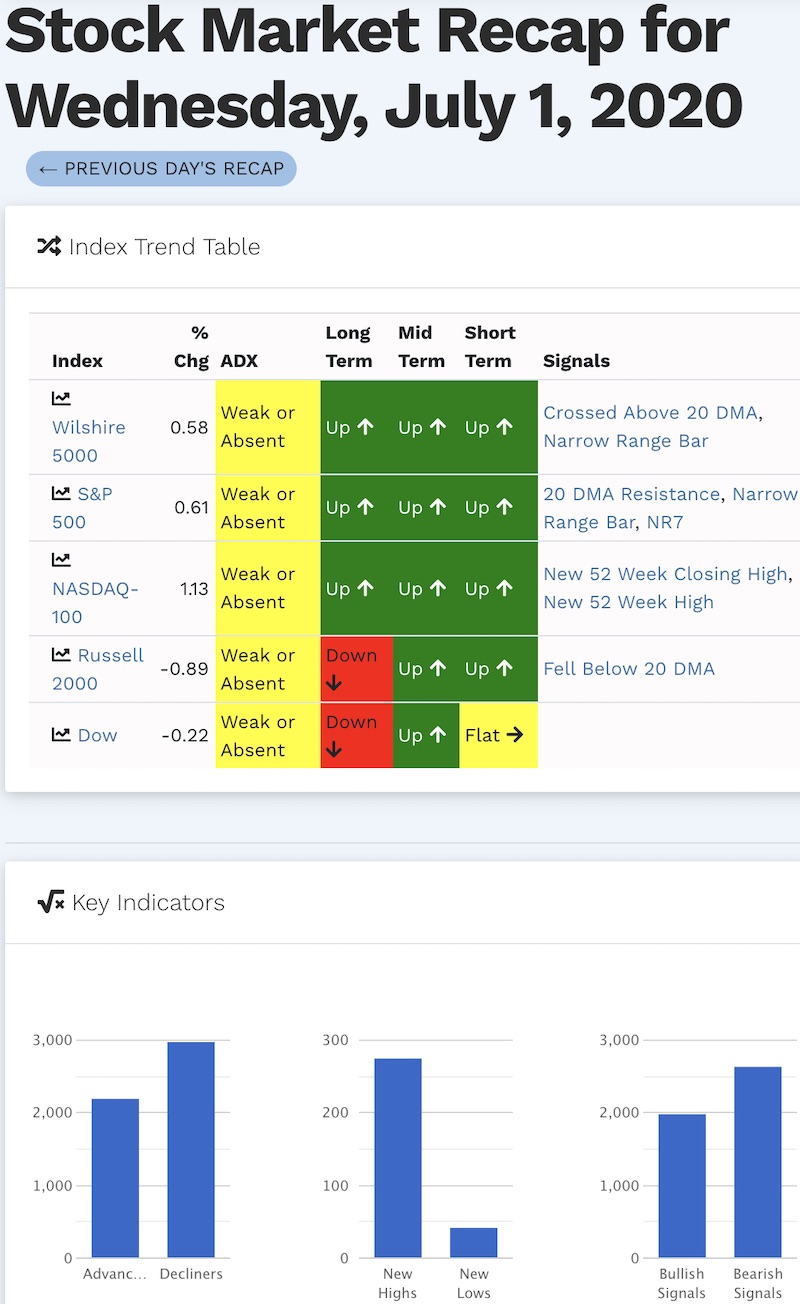
Source: SwingTradeBot.com
The stock market exhibited little hesitation for the entire week even as underlying signals still seemed to lean negatively. The above graphic shows that even on Wednesday decliners far outpaced advancers with bearish technical signals running well ahead of bullish technical signals. The new large gap between new highs and new lows comes from a true two-speed market.
The Stock Market Indices
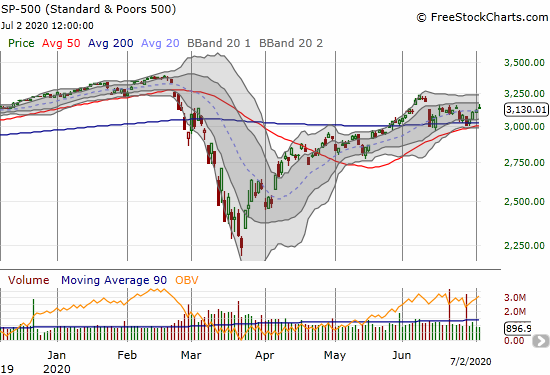
The S&P 500 (SPY) bounced relatively comfortably from 200DMA support. Its 50DMA is close behind to further fortify support levels. Still, the index is on edge as it rallied to and then faded from the ~3160 level. This level has delivered firm resistance since the big gap down on June 11th. This is an index still on edge.
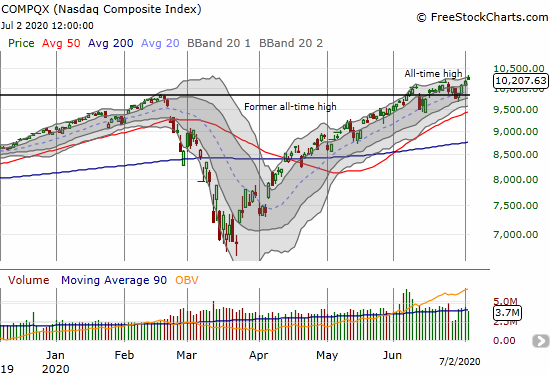
While the S&P 500 churns and struggles to gain fresh momentum, the NASDAQ (COMPQX) notched a fresh all-time high to end the week. Even with a slight intraday fade, the tech-laden index looks like it has a firm grip on upward momentum. The divergence between the S&P 500 and the NASDAQ is the highlight of a two-speed stock market.
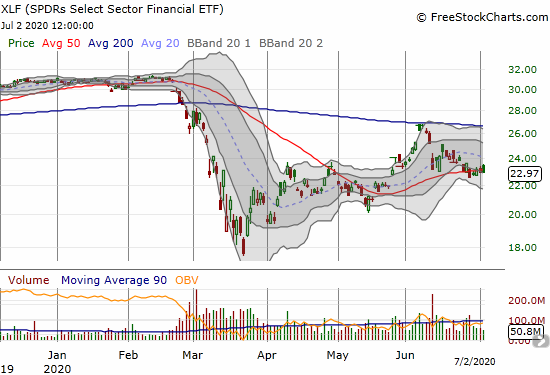
Financials are one of the starkest components of the two-speed stock market. The SPDRs Select Sector Financial (XLF) has numerous flaws. In June, XLF confirmed resistance at its 200DMA which stopped the ETF far short of a recovery from the February/March breakdown. XLF spent all week struggling to hold onto 50DMA support. With a 20DMA turning downward, XLF is likely to suffer a 50DMA breakdown before a 20DMA breakout.
Volatility
The volatility index (VIX) continued its fade from the June 11th 1-day sell-off. The VIX slowly ground lower all week as buyers got more and more comfortable with the stock market. What looked like a launchpad for higher levels in the previous week turned into a slide toward lower levels last week. I am still bracing for at least one more outbursts before the VIX breaks below June’s low (a move that would support bullish sentiments).
The Short-Term Trading Call
A two-speed market offers plenty of bearish and bullish opportunities. As a result I feel quite comfortable keeping the short-term trading call at neutral. I am still in no rush to flip bearish. Even if the S&P 500 breaks down below its converging 50 and 200DMA supports, I expect AT40 (T2108), the percentage of stocks trading over their respective 40DMAs, to be too close to oversold (20%) to make a bearish trading call worthwhile. After all, look at the bounce the stock market managed to pull off with AT40 only getting to 40%!
Economic Reality Index
A two-speed stock market is a good metaphor for the apparent dichotomy between the stock market and the real economy.
A month ago, I pointed out how the March bottom in the stock market well-anticipated the worst data in the jobs market. Since the historic spike in the unemployment rate, the employment picture has slowly but surely improved. The jobs report for June showed the improvement continues in the form of an unemployment rate dropping from 13.3% to 11.1% with total nonfarm payroll employment increasing by 4.8 million. Still, millions of people are desperately waiting for the economic fallout of the pandemic to end even as significant swaths of the stock market are behaving as if a pandemic never even happened.
I will keep an eye on economic reality by comparing continuing unemployment claims to the labor force participation rate. Continuing claims represents the total number of people who are receiving unemployment benefits. The peak in unemployment happened in just two weeks, a slow recovery has started since then. The labor force participation rate measures the percentage of the potential workforce that is actively seeking work. The plunge to 60.2% in April was the lowest since the mid 1970s when women began entering the workforce in historic numbers. The rebound in the participation rate suggests a small percentage of workers are seeing better job prospects.
Together, the continuing claims and labor force participation rate provide a measure of the real economy that matters more to workers than the stock market: are there any jobs available? I strongly suspect that a stall in improvement in these numbers will likewise slow down the stock market’s stubborn advance.
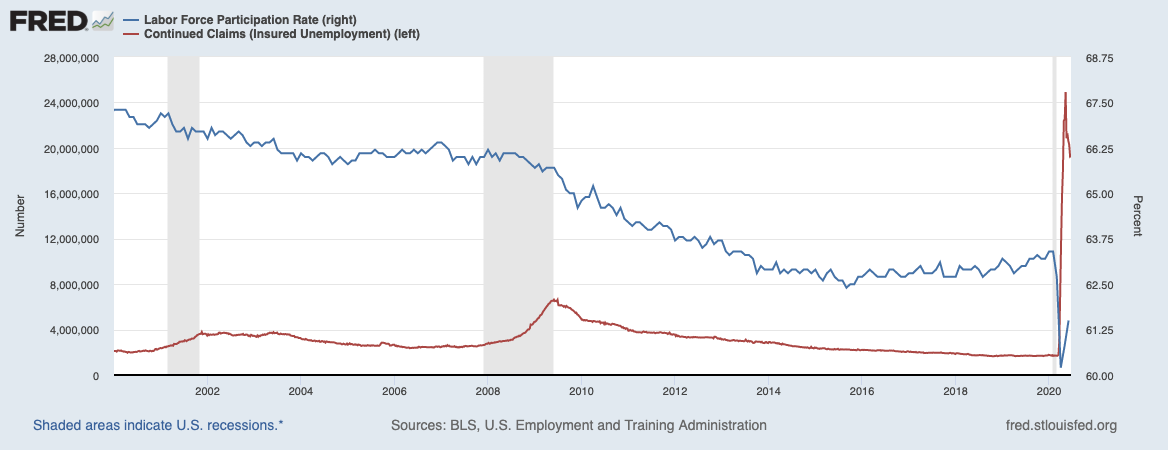
Source: U.S. Bureau of Labor Statistics, Labor Force Participation Rate [CIVPART] and U.S. Employment and Training Administration, Continued Claims (Insured Unemployment) [CCSA] retrieved from FRED, Federal Reserve Bank of St. Louis
Stock Chart Reviews: A Video Summary
Stock Chart Reviews – Below the 50DMA
JPMorgan Chase (JPM)
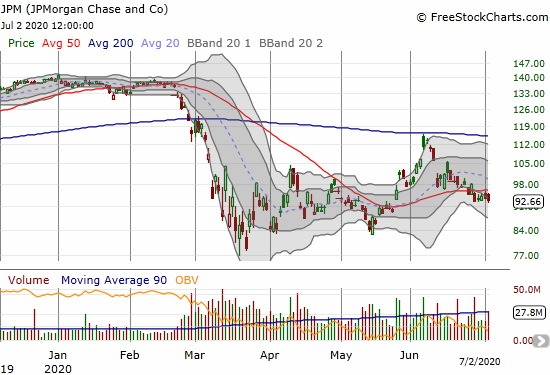
JPMorgan Chase (JPM) mirrors XLF as a major component of the ETF. Still, JPM, looks even more ready than XLF to take a fresh leg downward. JPM broke 50DMA support on June 24th and again on June 26th and has struggled ever since.
The Walt Disney Company (DIS)
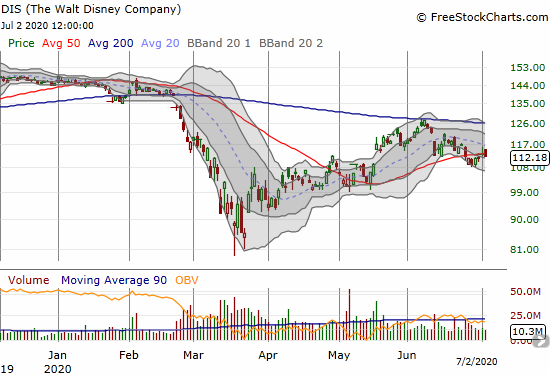
The struggles for The Walt Disney Company (DIS) involve a pivot around its 50DMA. I am seeing more and more stocks churning indecisively like this. A downtrending 20DMA points to a en eventual downward resolution.
Stock Chart Reviews – Above the 50DMA
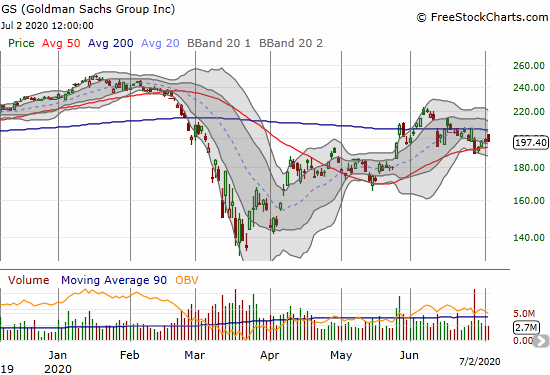
Goldman Sachs (GS)
Goldman Sachs (GS) ended the previous week with an ominous 50DMA breakdown. It started the last week with a gap up that saved the technicals. GS ended the week fading sharply from a gap up and away from 200DMA resistance. Stalemate.
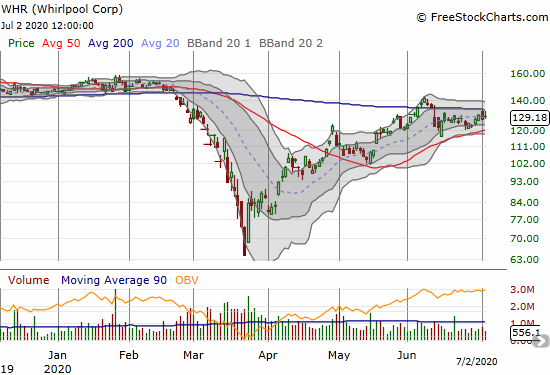
Whirlpool Corp (WHR)
Whirlpool (WHR) is another one of those pivoting stocks waiting for the next catalyst. The stock is twirling around its 20DMA while staying trapped between 200DMA resistance and 50DMA support. The next trade in WHR happens above resistance (buy) or below support (short).
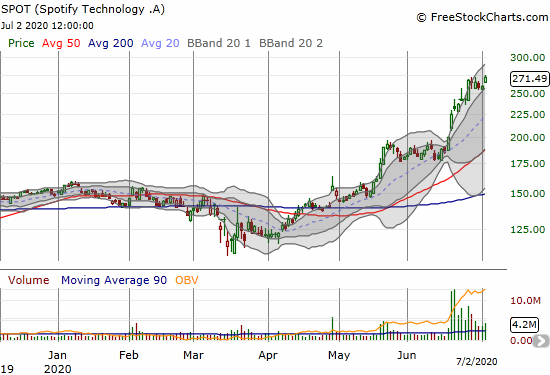
Spotify Technology (SPOT)
I thought Spotify Technology (SPOT) would run out of gas by now. Instead, the stock continues to garner buying support. The on-going run-up is an impressive follow-through to the bullish resolution of the Bollinger Band squeeze. I bought a weekly calendar call spread at the $290 strike. I picked $290 as the approximate point where a continued rally would next hit the upper-BB.
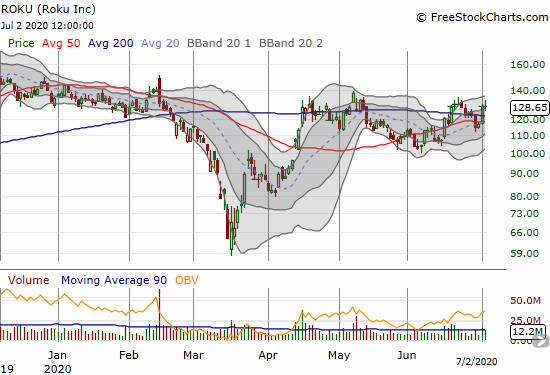
Roku (ROKU)
I do not know what to think about Roku (ROKU). The market seems similarly confused. In early June, the confirmed 50DMA breakdown seemed to announce the “final call” for ROKU. Two 200DMA breakouts later, ROKU is proving its resilience. Yet, the stock seems capped by the $140 level. I am now just watching for a $140 breakout or a $100 breakdown.
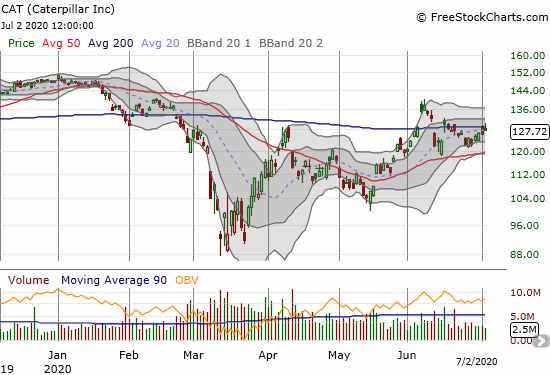
Caterpillar (CAT)
I thought the last swing downward in Caterpillar (CAT) would lead to a fresh test of 50DMA support. CAT stopped short of such a test and ground its way higher to challenge 200DMA resistance one more time. CAT put options are one of my favorite market hedges, but I do not think its worth bothering until the next bearish breakdown in the stock.
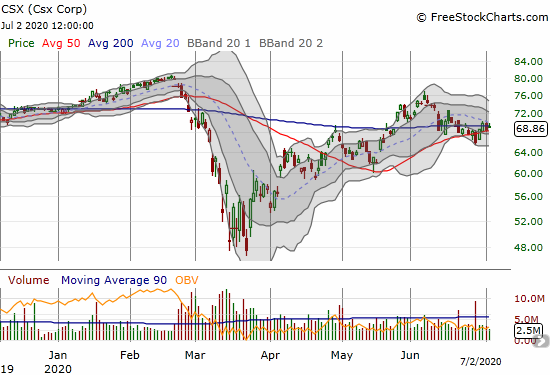
Csx Corp (CSX)
Railroad company Csx Corp (CSX) is very enticing for a buy here at converged 50/200 DMA support. The challenge at the downtrending 20DMA stayed my hand. CSX will be on my buy list on a close above $70. CSX also seems like a good way to play a recovering economy, especially if package shippers are finally turning the corner (see below).
Xilinx Inc (XLNX)
I have patiently waited in a position in Xilinx (XLNX) since buying in December. I doubled down on my position after XLNX’s first test of May support and sold a September $95 call against the entire position. I am now net profitable, but I am holding through at least September when my position might get called away. I originally thought of XLNX as a potential recovery play back to all-time highs around $140; I was looking for a rebound akin to NVIDIA (NVDA). XLNX has a long way to go as it is still trying to work off months-long lower highs and lower lows.
XLNX last closed above its 200DMA in early August so the technical story is improving slowly but surely.

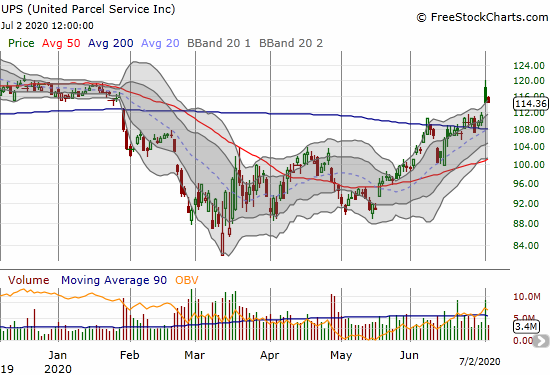
United Parcel Service Inc (UPS)
The United Parcel Service Inc (UPS) gapped up to a 2.9% gain in sympathy with Federal Express (FDX) earnings. The stock traded as high as 7.9% so the strong fade may have carved out a top until UPS can deliver its own strong earnings report. Until then, the stock still looks like it printed a bullish confirmation of its 200DMA breakout.
Stock Chart Spotlight – Bullish Breakout
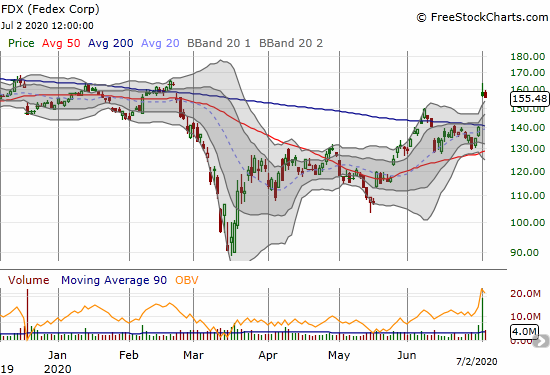
Federal Express (FDX)
Federal Express (FDX) had a strong post-earnings response. The stock finished the day with an 11.7% gain. This was impressive for a stock that peaked in January, 2018 and has had just one other positive positive post-earnings response since at least September, 2017. Given the post-earnings fade continued on Thursday, I am patiently waiting for the next positive sign on FDX before jumping into this bullish breakout setup. I prefer a successful test of 200DMA support, but I will make sure to get a position by the time the stock closes above its post-earnings intraday high of $164.
— – —
FOLLOW Dr. Duru’s commentary on financial markets via email, StockTwits, Twitter, and even Instagram!
“Above the 40” uses the percentage of stocks trading above their respective 40-day moving averages (DMAs) to assess the technical health of the stock market and to identify extremes in market sentiment that are likely to reverse. Abbreviated as AT40, Above the 40 is an alternative label for “T2108” which was created by Worden. Learn more about T2108 on my T2108 Resource Page. AT200, or T2107, measures the percentage of stocks trading above their respective 200DMAs.
Active AT40 (T2108) periods: Day #57 over 20%, Day #51 over 30%, Day #49 over 40%, Day #3 over 50% (overperiod), Day #7 under 60% (underperiod), Day #10 under 70%
Daily AT40 (T2108)
")
Black line: AT40 (T2108) (% measured on the right)
Red line: Overbought threshold (70%); Blue line: Oversold threshold (20%)
Weekly AT40 (T2108)

*All charts created using FreeStockCharts unless otherwise stated
The T2108 charts above are my LATEST updates independent of the date of this given AT40 post. For my latest AT40 post click here.
Be careful out there!
Full disclosure: long UVXY, long SPOT calendar call spread, short TSLA shares long call spread, long XLNX shares and short call
*Charting notes: FreeStockCharts stock prices are not adjusted for dividends. TradingView.com charts for currencies use Tokyo time as the start of the forex trading day. FreeStockCharts currency charts are based on Eastern U.S. time to define the trading day.
My Old Friend. Check out NIO, not my type of stock. I guess you might ask just when will the blow off come.
Wow! I wrote off NIO when it got close to a buck last October! My mistake clearly!
And yes, now I wonder when the blow-off top is coming. Looks like it already came from NKLA. So many speculative stocks everywhere….