
Stock Market Statistics
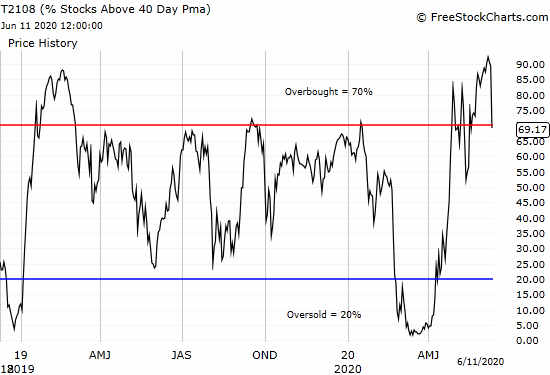
AT40 = 69.2% of stocks are trading above their respective 40-day moving averages (DMAs) (ending 16 days overbought)
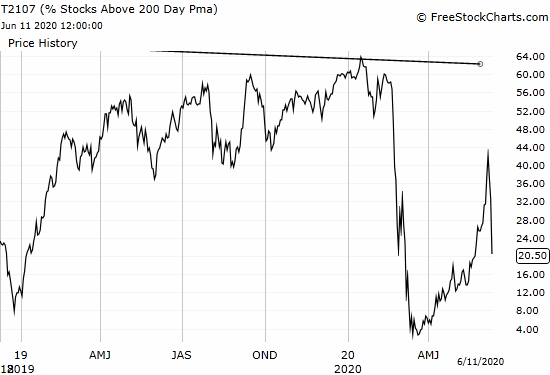
AT200 = 20.5% of stocks are trading above their respective 200DMAs
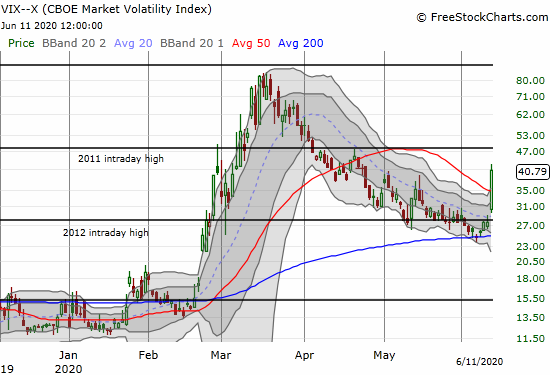
VIX = 40.8 (up 48.0%)
Short-term Trading Call: cautiously bullish
Stock Market Commentary
It was fun while it lasted.
The Federal Reserve delivered its latest pronouncements on monetary policy one day, and the next day financial markets around the world went haywire. The U.S. stock market went from chasing catch-up trades and panic buys to pressing the eject button all at once. Looking back, there were clear warnings going into the sell-off, most of which I noticed but did not act upon in an aggressive manner. Looking forward, there are a few promising signs that I am clutching for now.
The Stock Market Indices
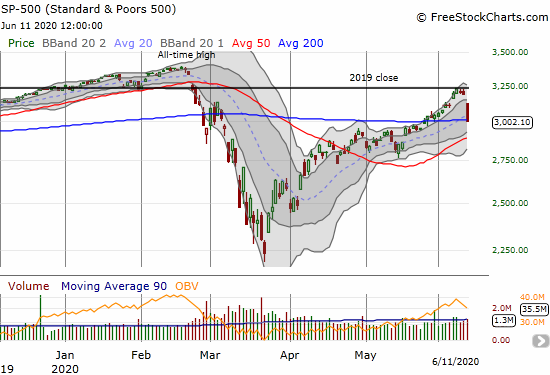
In one fell swoop the S&P 500 (SPY) wiped out its breakout above its 200-day moving (DMA) and poof went 9 days of gains. The move confirmed the 2019 close as resistance. The failure to push through that line for three straight days was a warning sign. The two days of selling after the index hit the 2019 closing price was so small that, by itself, the warning looked minor. Now the index faces a major test in trying to hold onto 200DMA support. Fortunately, 50DMA support awaits below in an uptrend in case the 200DMA gives way. The uptrending 50DMA is a promising sign.
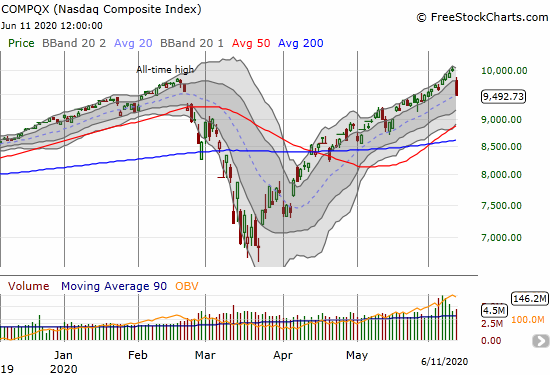
The NASDAQ (COMPQX) delivered no warning. The tech-laden index just suddenly lost 5.3% after a remarkably orderly stair-step to multiple all-time highs. The NASDAQ stopped just short of going parabolic. The index closed right on top of uptrending 20DMA support. This support has held since the NASDAQ broke out above its 20DMA in early April. If this support fails, the NASDAQ has an uptrending 50DMA that looks promising as future support.
The iShares Russell 2000 Index Fund ETF (IWM) delivered a clear warning post-Fed. IWM lost 2.7% on high trading volume. The next day, IWM gapped down, sliced through its uptrending 20DMA and closed with a 7.6% loss. An uptrending 50DMA awaits as promising support.

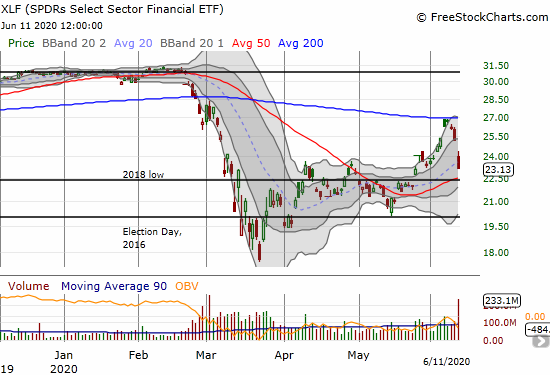
Soaring financials caught me by surprise the previous week. Plunging financials caught me by surprise as well. The SPDR Select Sector Financial (XLF) went from an ominous laggard in mid-May to a parabolic move in June to a spectacular failure at 200DMA resistance. (Once again, a parabolic move ended poorly). XLF lost 3.7% post-Fed and delivered a warning in the form of a confirmation of 200DMA resistance. Like the other major indices, XLF has an uptrending 50DMA offering promising support. The 50DMA also happens to converge with the low from 2018, a line that is becoming a major pivot point.
The Australian dollar versus the Japanese yen (AUD/JPY) performed its traditional role as an early warning system. This telling currency pair served as confirmation of all the other warning signs. This is quite a sharp turn-around from the soaring confirmation the previous week on a new high for the year. At the time of writing, AUD/JPY is turning around with a promising sign on a bounce from its 20DMA. If this move holds up, the U.S. stock market should open in a better mood than how it closed on Thursday…
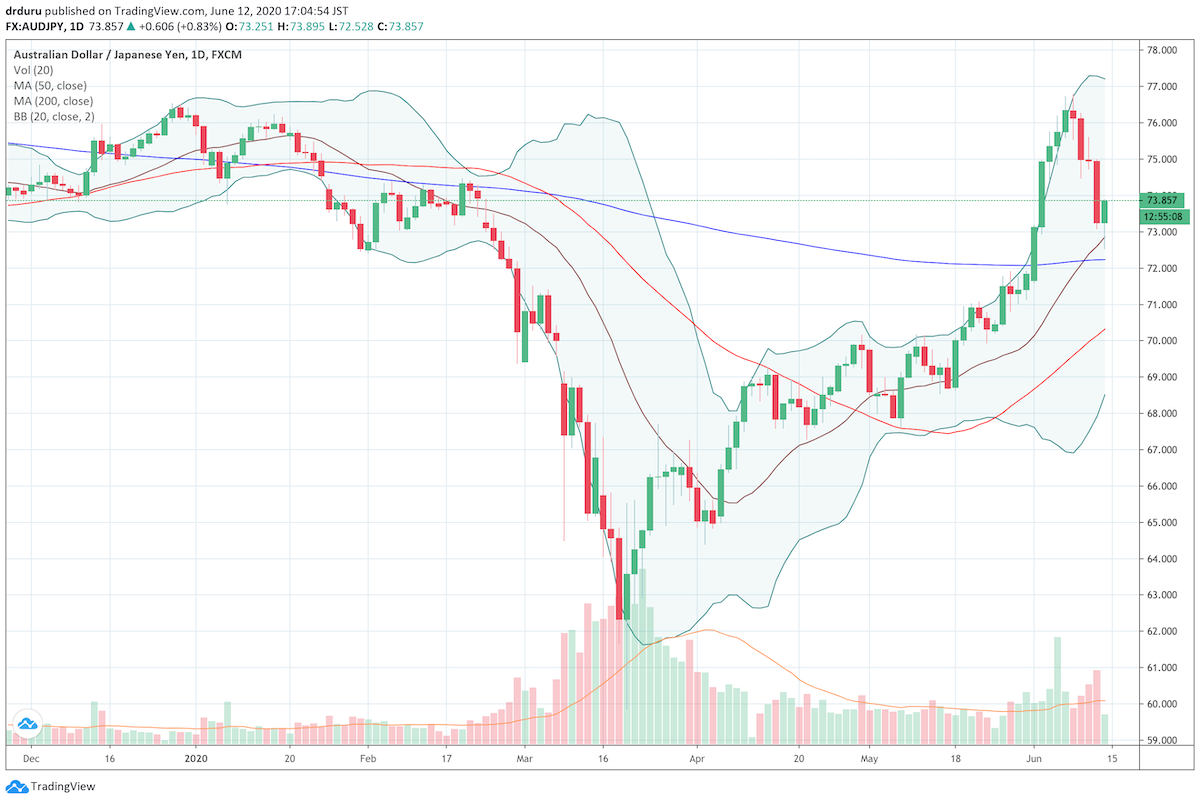
Source: TradingView.com
Volatility
Even the volatility index, the VIX, delivered a warning ahead of the day’s massive sell-off. The VIX crept upward all week and demonstrated a concern for the growing weakness in small caps and financials. The 48.0% gain was stunning. The VIX never gained that much in percentage terms during the entirety of the March stock market crash! I think the VIX is over-extended, and I decided to start shorting the ProShares Ultra VIX Short-Term Futures ETF (UVXY) again. UVXY gained 50.2% on the day which is not even a 1-month high…in other words it is lagging the VIX.
Overbought…No More

AT40 (T2108), the percentage of stocks trading above their respective 40DMAs, was overbought for 16 straight days and 17 of the last 18 trading days. This extended overbought period ended in spectacular style – one big swoosh. I still maintain that the extremes of this extended overbought period are a bullish sign for the stock market for the balance of the year but clearly bumps and bruises await traders going forward.
AT200 (T2107), the percentage of stocks trading above their respective 200DMAs, put on an even more dramatic performance. With small caps and financials wilting AT200 lost 10 percentage points over two days. That move was huge given AT200 closed at 42% at its peak. The plunge to 20.5% covered another 12 percentage points of losses. This loss is sharp and alarming. Ironically, with AT200 so low again, the upside opportunity for buying the dip is strong once again. Under normal circumstances, I would expect traders and investors to pounce on the new “bargains” formed by promising pullbacks.
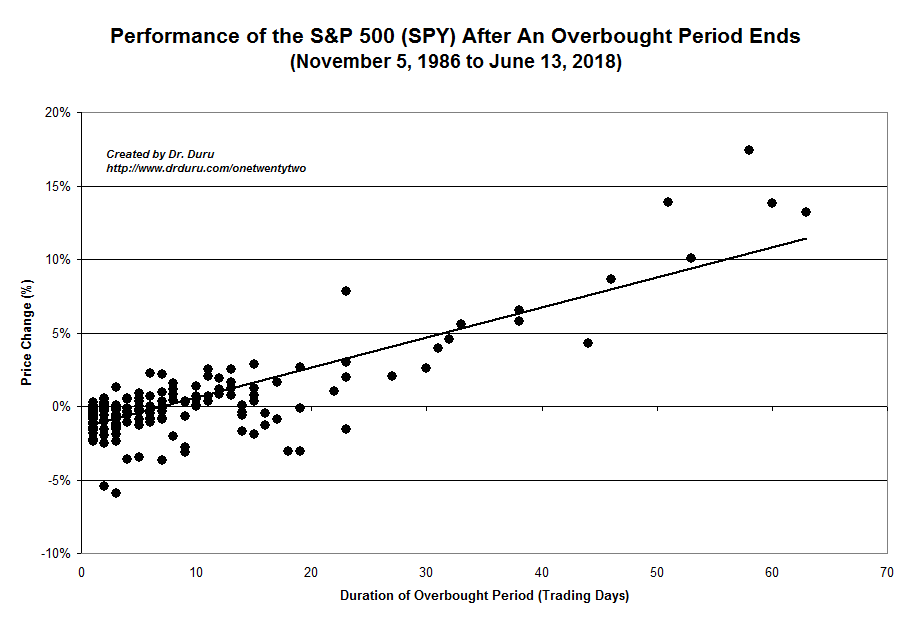
In my previous Above the 40 post, I noted that the S&P 500 was pacing well ahead of its historic performance. The last overbought period started on May 20th. The S&P 500 gained 1.0% for the overbought period. This final performance was a little on the low side but well within historical norms.
The Short-Term Trading Call
With so many converging and confirming warning signs alongside the S&P 500 outpacing its historical overbought performance, I technically should have flipped neutral or cautiously bearish. At least I was in a slow motion mode of taking profits all the way up. I even took profits on my last ProShares Ultra S&P500 (SSO) shares.
I stayed cautiously bullish because I was in a mode of buying the dips. My profit-taking has built up cash waiting to be put to work. A dip has come but thanks to AT40 falling out of overbought conditions, I cannot quite pull the trigger. If AT40 extends further downward along with the S&P 500 confirming its 200DMA breakdown, I will flip neutral. If the S&P 500 saves itself at 200DMA support, I can sit still on my cautiously bullish short-term trading call. Given the promising underlying support from 50DMAs, the window for being bearish looks very narrow. I want to avoid finessing such small windows. Breakdowns below even 50DMA support will turn things definitively bearish.
— – —
FOLLOW Dr. Duru’s commentary on financial markets via email, StockTwits, Twitter, and even Instagram!
“Above the 40” uses the percentage of stocks trading above their respective 40-day moving averages (DMAs) to assess the technical health of the stock market and to identify extremes in market sentiment that are likely to reverse. Abbreviated as AT40, Above the 40 is an alternative label for “T2108” which was created by Worden. Learn more about T2108 on my T2108 Resource Page. AT200, or T2107, measures the percentage of stocks trading above their respective 200DMAs.
Active AT40 (T2108) periods: Day #42 over 20%, Day #36 over 30%, Day #34 over 40%, Day #33 over 50%, Day #18 over 60% (overperiod), Day #1 under 70% (ending 16 days overbought)
Daily AT40 (T2108)
")
Black line: AT40 (T2108) (% measured on the right)
Red line: Overbought threshold (70%); Blue line: Oversold threshold (20%)
Weekly AT40 (T2108)

*All charts created using FreeStockCharts unless otherwise stated
The T2108 charts above are my LATEST updates independent of the date of this given AT40 post. For my latest AT40 post click here.
Be careful out there!
Full disclosure: short UVXY shares
*Charting notes: FreeStockCharts stock prices are not adjusted for dividends. TradingView.com charts for currencies use Tokyo time as the start of the forex trading day. FreeStockCharts currency charts are based on Eastern U.S. time to define the trading day.
Keep in mind that one of the bullish fundamentals that had driven the market to repeated new highs – companies buying back their stock, sometimes borrowing at ultra-low interest rates to do so – has in many cases been suspended. In particular, many dividend-payers who were also buying back stock, have stopped the latter so as to ensure the ability to continue the former.
Fortunately, my thesis has never depended on those fundamentals. 🙂
So the market soared without corporate buybacks right back to all-time highs. Imagine what happens once those buybacks rev back up again…