
AT40 = 34.4% of stocks are trading above their respective 40-day moving averages (DMAs)
AT200 = 43.8% of stocks are trading above their respective 200DMAs
VIX = 15.9
Short-term Trading Call: neutral
Stock Market Commentary
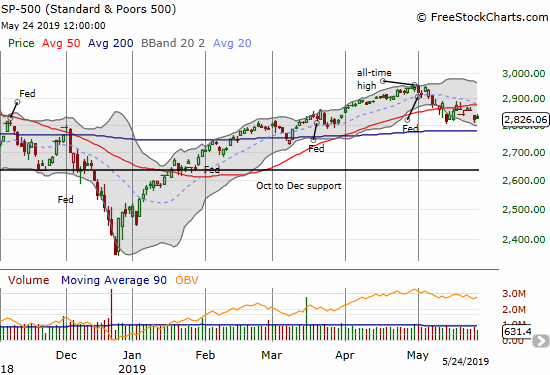
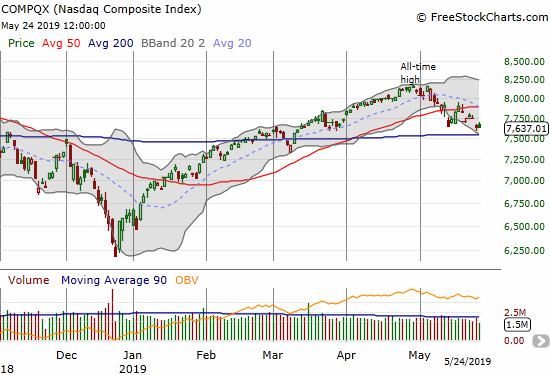
Bearish resistance won the trading battle the previous week. Last week, sellers did their best to follow-through. It was a week of chop that ended with a loss thanks to another Monday gap down and then a gap down on Thursday. The S&P 500 (SPY) held onto support from its lows two weeks prior, but the NASDAQ (NDX) could not quite pull off a convincing test of those March lows. The tech-laden index looks more ready than the S&P 500 for a test of 200DMA support.
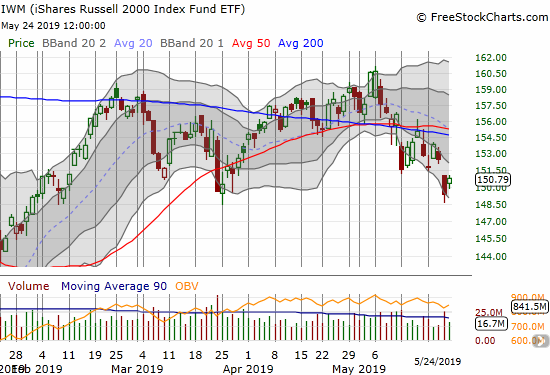
While the S&P 500 and the NASDAQ precariously float above their 200DMAs, the damage deepens for the iShares Russell 2000 ETF (IWM). IWM confirmed its breakdown below its 50 and 200-day moving averages (DMAs). While Friday’s bounce regained the support level from March’s lows, the index of small caps looks like it could be at the start of a more extended downtrend through its lower Bollinger Band (BB) channels.
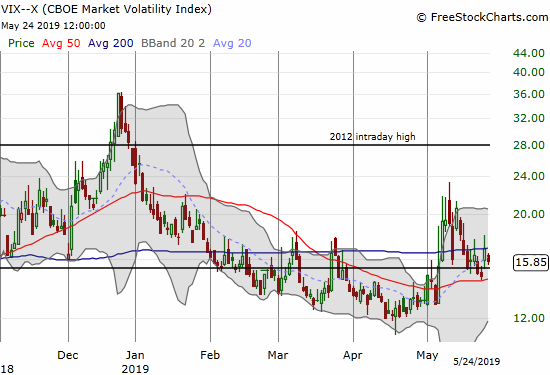
The volatility index (VIX) imploded the previous week. After a breath of life on Monday, the VIX managed to close two straight days below its 15.35 pivot. Thursday’s pop brought the VIX back to some life, but it looks ready for more churn rather than a trade in any particular direction. I used Thursday’s pop to add to my Ultra VIX Short-Term Futures ETF (UVXY) put options just to stay consistent with my new bias to fade volatility run-ups.
AT40 (T2108), the percentage of stocks trading above their respective 40DMAs, closed the week at 34.4%. It is “close enough” to oversold, but the precarious technicals on the major indices are waving me off from making any moves. AT40 has not been this low since January 8th. My favorite technical indicator has drifted lower since double-topping in February in overbought territory. I am amazed the major indices are not a lot lower right now.
AT200 (T2107), the percentage of stocks trading above their respective 200DMAs, is faring better and serves as a reminder of the stock market’s residual bullishness despite the bearish divergences that keep appearing between AT40 and the S&P 500. AT200 peaked in early May. It closed the week at 43.8%, still above the March double-bottom at 38.9%.
The Trade War
While the stock market precariously floats along, the trade war seethes just below the surface. However, slowly but surely it seems the market is starting to recognize the protracted nature of the trade tensions between the U.S. and China. At some point, the market should even stop reacting to positive scripts thrown into the water by the U.S. trade team. At this point, only an actual deal matters.
David Kelly, JP Morgan Asset Management’s Chief Global Strategist, offered an interesting perspective in the wake of a Chinese propaganda video on the trade war that has gone viral as a theme song. Kelly pointed out how China’s position is rooted in the embarrassment it suffered over trade at the hands of the West in the 19th century. The U.S. has made strategic errors in failing to recognize this history. Yet, he also claimed that trade wars are so disastrous that they burn themselves out. I think in our modern context, the burn-out will come in the form of a (mild?) recession and/or a persistent and broad bear market in stocks.
A bi-partisan group of U.S. Senators may also help the marketplace understand the depths of the trade tensions. They provided security briefings to U.S. companies that reportedly explained the deep risks of doing business in China. If this move does not signal the deep trenches of this pitched trade battle, I cannot imagine what else can or will.
In the wake of the most recent escalation of the trade war, Marketplace produced a segment on May 10th called “Farmers hoped for a trade deal. Instead, tariffs went up“. I finally found some farmers who are actually ecstatic over the trade war: garlic farmers. Apparently, there are only three remaining garlic producers in the U.S. The tariffs weighing on imports of Chinese garlic give them new hope.
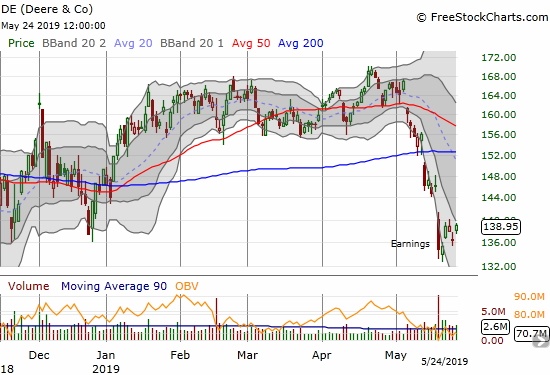
Deere & Company (DE) suffered a big loss in the wake of its earnings report the previous week. I am now keeping an eye on DE as a partial indicator of how seriously the market is taking the trade threat in agriculture. So far, the selling in DE has yet to achieve follow-through. Instead, buyers have rushed in and seem determined to defend a bottom.
Stock Chart Reviews – Bearish
Applied Materials (AMAT)
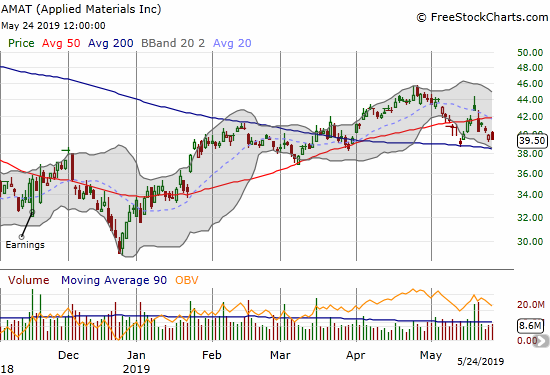
The breakout for Applied Materials (AMAT) in April looked very bullish. A bounce off 200DMA support earlier this month and a subsequent 50DMA breakout gave the brief look of a refresh of bullish momentum. However, the 50DMA breakout turned into a headfake that left behind an abandoned baby top. Given this reversal of momentum, I do not think the imminent retest of 200DMA support will prove successful.
Baidu (BIDU)
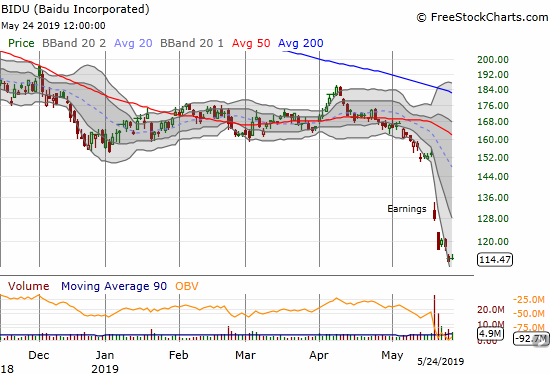
The sellers are not yet through trashing Baidu (BIDU). The stock managed to gap down again after its post-earnings gap down. BIDU closed the week near a 6-year low. I want to consider the stock a steal here, but I am sitting on my hands until other buyers show interest: my celebrate with buyers approach to bottom-fishing.
Nordstrom (JWN)
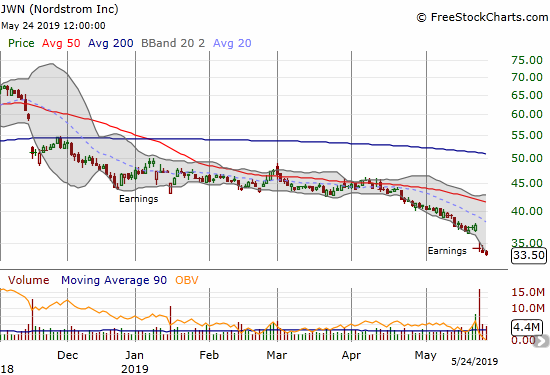
I have long been a fan of Nordstron (JWN), but the stock has not given me any reasons to buy in a very long time. Indeed, JWN has been in a bearish position since its 50 and 200DMA breakdowns last November. The bearishness took a sharper turn downward with last week’s earnings gap down.
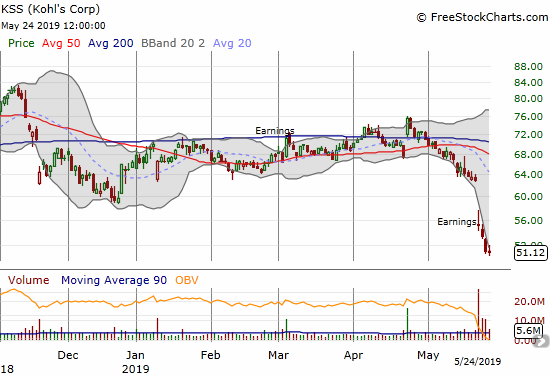
Kohl’s (KSS)
Last week was clearly a bad week for big box retailers. Kohl’s (KSS), another previous favorite of mine, disappointed on its earnings and closed the week at a 2 1/2 year low. This is another stock that looks “cheap” to me, but I am content to sit on my hands for now. For more reference, Dillard’s (DDS), gapped down post-earnings the previous week and is currently struggling to cling to its lows from December. Macy’s (M) is now trading at levels last seen in November, 2017.
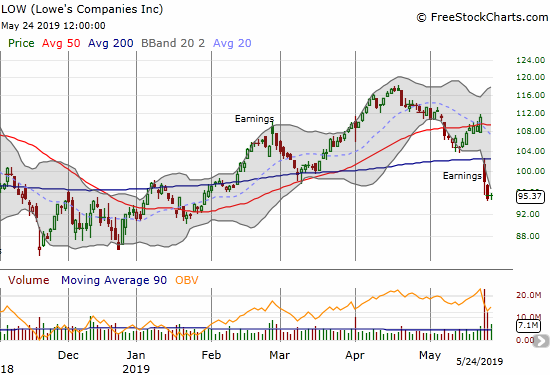
Lowe’s Companies (LOW)
Lowe’s Companies (LOW) looked quite bullish after a very successful test of support in March. The stock hit an all-time high in April. It took just over a month for everything to flip over. LOW is now struggling to repair the damage from a post-earnings 200DMA gap down.
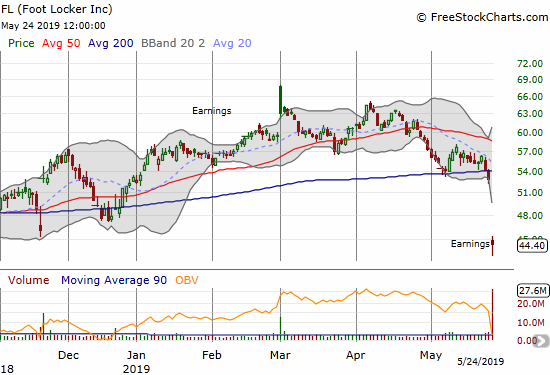
Foot Locker (FL)
I last noted Foot Locker (FL) as a potential buy based if buyers could hold the post-earnings gap and crap at the end of February. A 50DMA breakdown quickly brought the prospects of that trade to an end and flipped FL to the bearish side. Buyers finally stepped in after that breakdown. Friday’s massive post-earnings gap down put an exclamation mark on the bearish implications of earlier trading behavior.
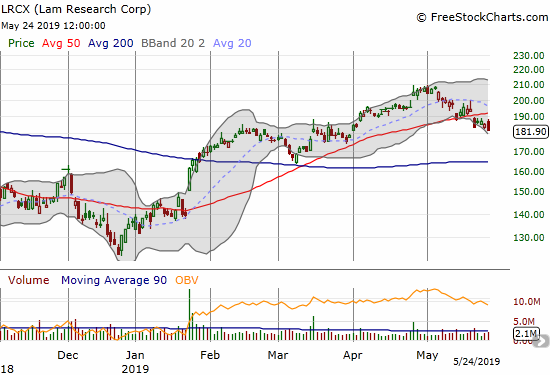
Lam Research (LRCX)
Lam Research (LRCX) is slowly slipping through a bearish breakdown. It may take some time, but a fresh test of 200DMA supoprt looks imminent.
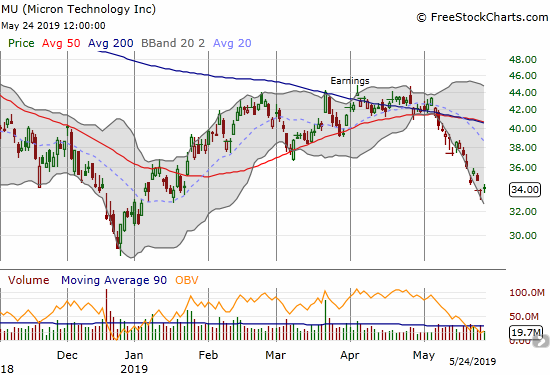
Micron (MU)
Micron (MU) has suffered a persistent decline all month. The breakdown from converged support at the 50 and 200DMAs was an obvious point for shorting the stock, but I never took any action. A retest of the December lows is in play.
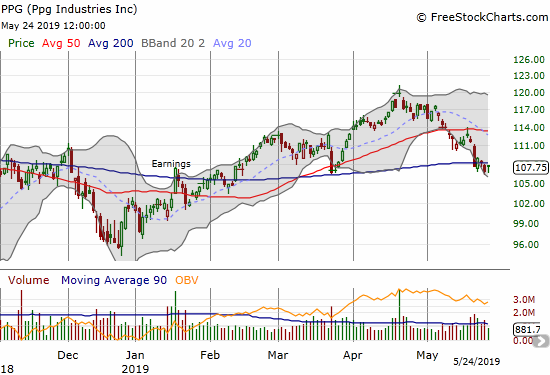
PPG Industries (PPG)
PPG Industries (PPG) broke down below 200DMA support last week, but the stock has churned since then. I wrote about PPG in early October after the company warned about the negative impacts of inflation on its business. The stock has swung wildly since then and currently trades about 8% above that point. The stock looks ready to return to those October levels (December’s sell-off tested those October lows).
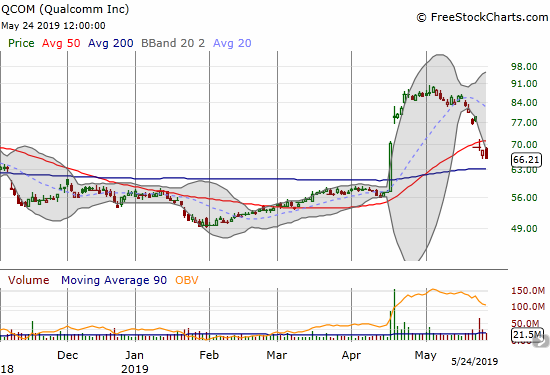
Qualcomm (QCOM)
Qualcomm (QCOM) delivered a major fakeout to traders and investors. Last month’s settlement with Apple (AAPL) generated a breakout and surge that looked like an enduring change of fortune. May’s slight drift lower was a subtle warning for the selling to come. Fresh selling came in the form of an adverse court ruling.
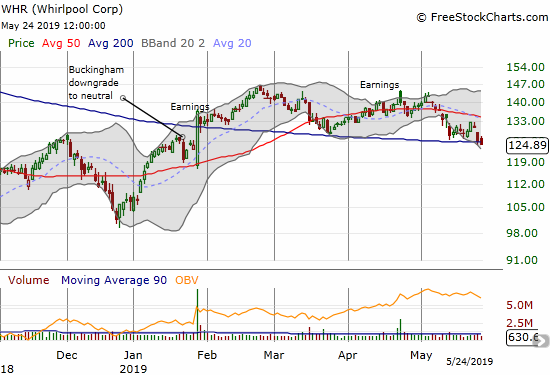
Whirlpool (WHR)
In my last Above the 40 post, I noted how Whirlpool (WHR) held support at its 200DMA while expressing expectations for an eventual breakdown. That breakdown may have started with some small slips to end the week.
Stock Chart Reviews – Bullish
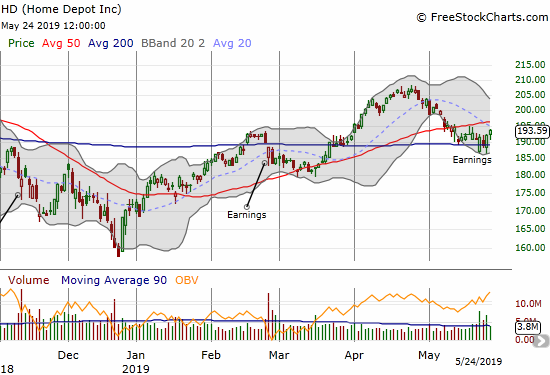
Home Depot (HD)
Unlike Lowe’s (LOW), Home Depot (HD) remains in a bullish position. Its post-earnings gap down initially looked bearish. HD becomes one of the few big box retailers to survive earnings this month.
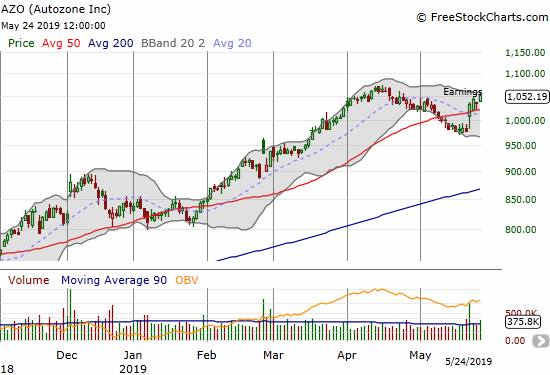
Autozone (AZO)
Autozone (AZO) refreshed itself through earnings and reversed its 50DMA breakdown.
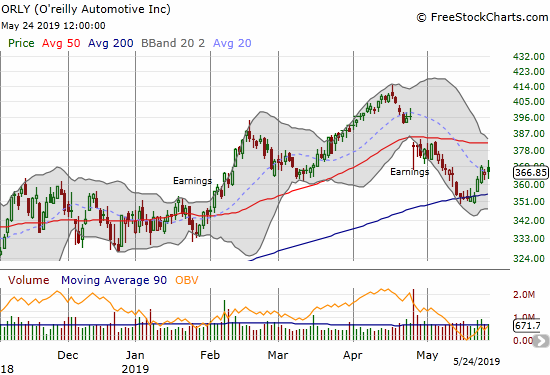
O’reilly Automotive (ORLY)
O’reilly Automotive (ORLY) is still in a precarious position, but the positive earnings from AZO may have revived the stock in sympathy. I am in no rush to get back into ORLY even though the bounce from 200DMA support looks bullish. I am content to wait for the stock to close above its 50DMA again.
— – —
FOLLOW Dr. Duru’s commentary on financial markets via email, StockTwits, Twitter, and even Instagram!
“Above the 40” uses the percentage of stocks trading above their respective 40-day moving averages (DMAs) to assess the technical health of the stock market and to identify extremes in market sentiment that are likely to reverse. Abbreviated as AT40, Above the 40 is an alternative label for “T2108” which was created by Worden. Learn more about T2108 on my T2108 Resource Page. AT200, or T2107, measures the percentage of stocks trading above their respective 200DMAs.
Active AT40 (T2108) periods: Day #95 over 20%, Day #96 over 30% (overperiod), Day #3 under 40% (underperiod), Day #14 under 50%, Day #14 under 60%, Day #57 under 70%
Daily AT40 (T2108)
")
Black line: AT40 (T2108) (% measured on the right)
Red line: Overbought threshold (70%); Blue line: Oversold threshold (20%)
Weekly AT40 (T2108)

*All charts created using FreeStockCharts unless otherwise stated
The T2108 charts above are my LATEST updates independent of the date of this given AT40 post. For my latest AT40 post click here.
Related links:
The AT40 (T2108) Resource Page
You can follow real-time T2108 commentary on twitter using the #T2108 or #AT40 hashtags. T2108-related trades and other trades are occasionally posted on twitter using the #120trade hashtag.
Be careful out there!
Full disclosure: long UVXY puts, long WHR put spread, long AAPL calls and put spread
*Charting notes: FreeStockCharts stock prices are not adjusted for dividends. TradingView.com charts for currencies use Tokyo time as the start of the forex trading day. FreeStockCharts currency charts are based on Eastern U.S. time to define the trading day.
Anyone short big-box retailers is getting rich!
Yes indeed. It was an idea that mostly escaped me. I wrote earlier about my success with puts on BBY which took a plunge ahead of earnings. But I did not refresh the bet into earnings.