AT40 = 78.7% of stocks are trading above their respective 40-day moving averages (DMAs) (11th overbought day)
AT200 = 35.3% of stocks are trading above their respective 200DMAs
VIX = 15.7
Short-term Trading Call: neutral
Commentary
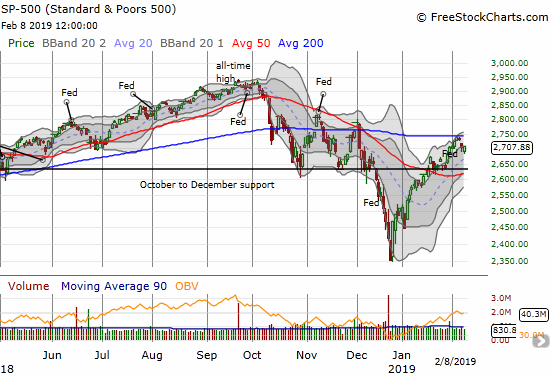
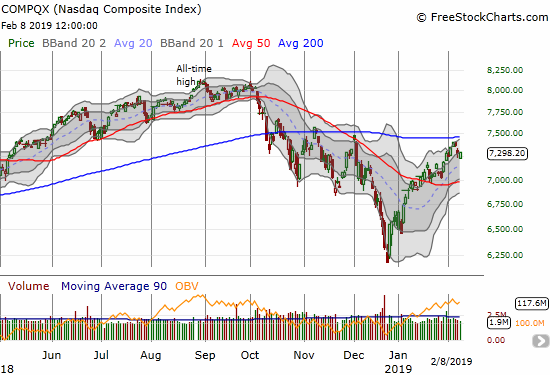
In my last Above the 40 post, I noted the “convenience” test of 200DMA resistance for major indices. The S&P 500 and the NASDAQ failed their tests, but sellers also failed to make a major statement out of the event. After a gap down Friday, buyers stepped right in and drove these indices back to flat on the day and for the week.
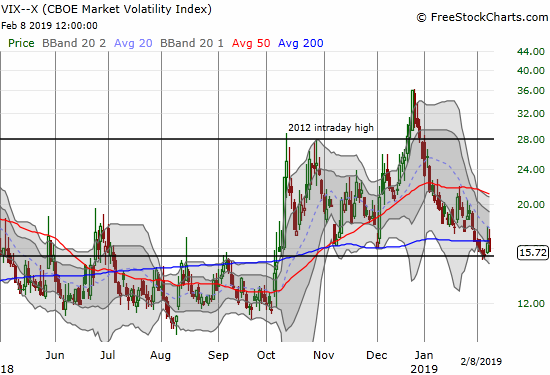
The Thursday gap down caused the volatility index, the VIX, to launch off its 15.35 pivot point, but the volatility faders managed to drive the VIX well off its intraday high. The fade picked up again on Friday with the VIX returning to 15.7 and just above its pivot.
AT40 (T2108), the percentage of stocks trading above their respective 40DMAs, finally dropped out of the 80% overperiod. It closed the week at 78.7%. The overbought period is now 11 days old. The extended overbought period shows little sign of ending soon with AT200 (T2107), the percentage of stocks trading above their respective 200DMAs, falling less than two percentage points from 37.1% to 35.3%. Sellers still have a LOT to prove. As a reminder, I will not flip bearish until AT40 drops out of overbought conditions (trust me, this event WILL happen at some point – see the charts at the end of this post for context).
One very notable change happened to the Semiconductor Hldrs ETF (SMH). I just pointed out the bullish implications of its 200DMA breakout on Wednesday. The rejection at 200DMA resistance for the major indices turned into SMH’s complete reversal of its 200DMA breakout. Now the semiconductor index is clinging to the uptrending upper Bollinger Band (BB) trading channel. I continue to watch this action closely as I used this dip to make fresh plays in semis. Goldman Sachs (GS) added fuel to the fire by downgrading chip stocks on Friday.
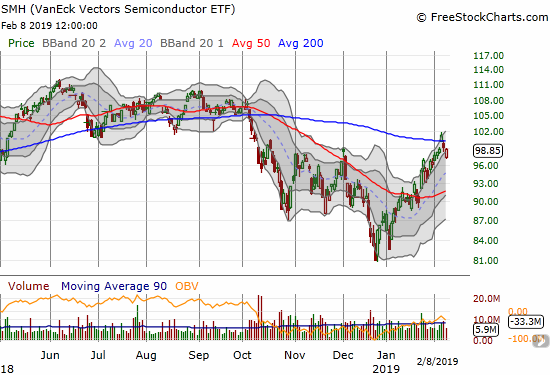
CHART REVIEWS
Guidewire Software (GWRE)
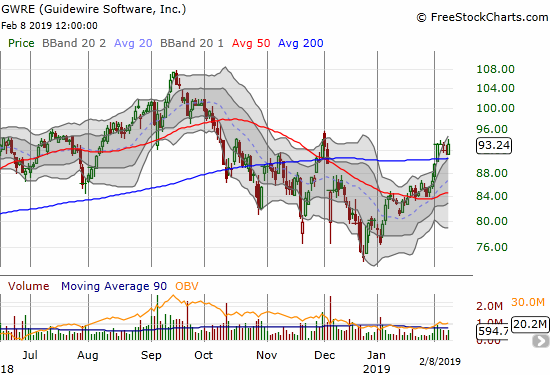
GWRE is an interesting stock I learned about on Nightly Business Report in an interview with Michael Lippert, Portfolio Manager of the Baron Opportunity Fund. The company provides software to the property casualty and insurance industry. Lippert claims the company dominates its industry and has actually never lost a customer. The company’s shift to the cloud will generate deals 2-3x current deal sizes and increase profits by 1.5-2x. I would prefer a minimum 1:1 ratio between incremental deal size and profits, but the chart at least sealed the deal for me. GWRE last week enjoyed a 200DMA breakout and is right on the edge of confirming the move.
Hasbro (HAS)
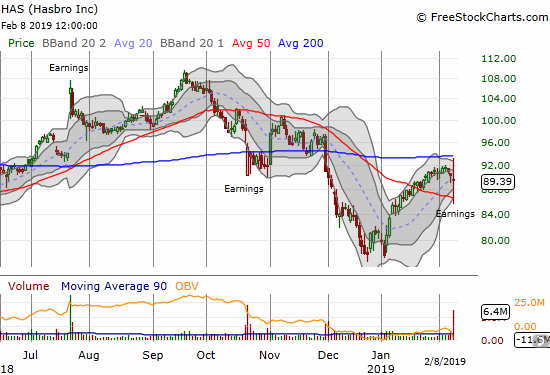
The market did not know what to make of toy maker HAS earnings. The stock perfectly lurched between 50DMA support and 200DMA resistance. I like trading the stock long on a 200DMA breakout or short on a 50DMA breakdown. I will assume the first move will be sustained and will not require confirmation given the coiled spring building inside the current range.
Mattel (MAT)
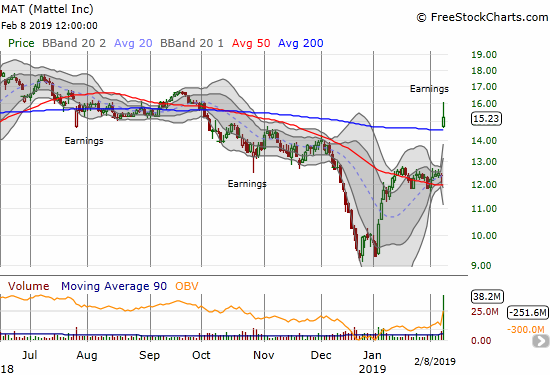
Toy maker MAT reported its earnings as well. The stock received a better reception and launched from 50DMA support to a post-earnings 200DMA breakout. The stock will confirm the breakout on a close above its post-earnings intraday high.
Boeing (BA)
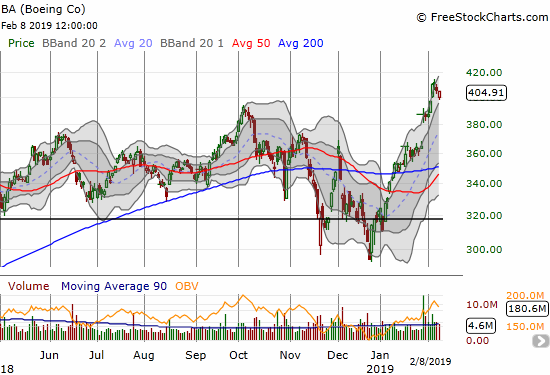
I was skeptical of BA for much of the second half of 2018 and going into this year. With the stock breaking out to new all-time highs, I have taken the stock completely off my radar to use as a hedge against bullishness. Instead, this stock is once again a buy on the dips…for now.
Caterpillar (CAT)
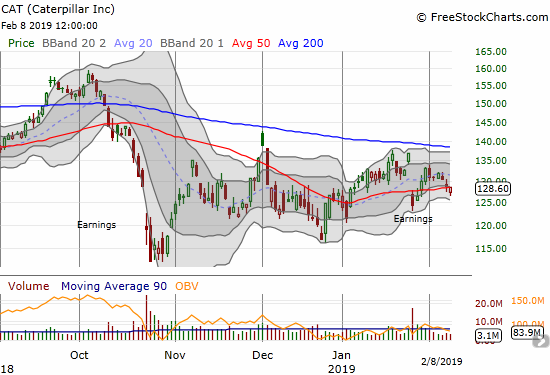
While I took BA off the fade list, I bought puts in CAT just in time. The stock gapped down and traded briefly below 50DMA support on Thursday. I took profits quickly on the position. The stock market is still generally bullish and with my trading call on neutral, I am not interested in holding this kind of hedging position over an extended period of time.
Chipotle Mexican Grill (CMG)
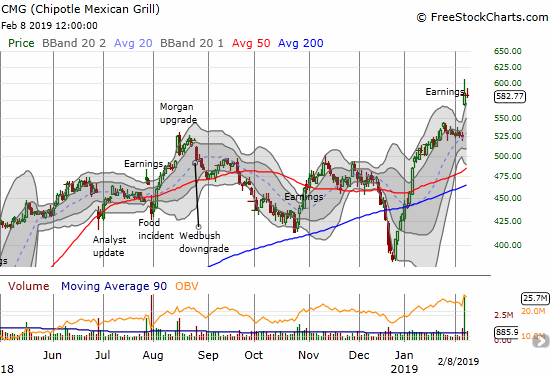
CMG continues to defy my muted expectations. All I can do here is continue to watch in amazement and wonder how and why I managed to miss placing ANY long positions during this amazing run from the December lows.
Electronic Arts (EA)
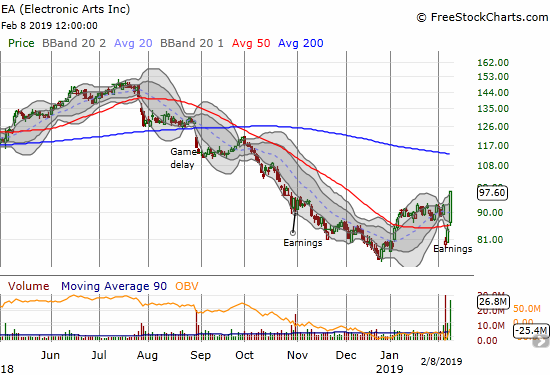
Speaking of amazement and dismay, EA did not even wait for me to warm up the buying trigger that I started building on Wednesday. In my last Above the 40 post, I said “I like the stock as a play to rally at least back to 50DMA resistance if it manages to make a new post-earnings high. A break below December support will be very bearish for the stock.” Not only did EA rally right away to 50DMA resistance before I could even blink, but also on Friday the stock tacked on another 16.1% and closed on its high of the day. The company’s recent challenger to Fortnite reportedly attracted an instant user population of 10M (in 3 days)! The fast launch in the stock looks like an overreaction, so now I go from wary buyer to dip-watcher.
Facebook (FB)
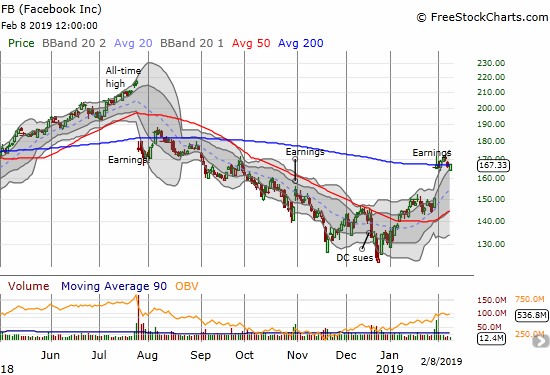
Last earnings I made a bullish case for a pre-earnings play in Facebook. I did not take profits when I had them, and the trade failed to profit after I closed all the positions. Seeking redemption, I used a similar playbook this time around and added selling short a put spread. The trade started going awry when the stock zipped right through the $150 strike of my calendar calls BEFORE earnings. I was left quite dismayed the next day to see the many multiples of increase in the value of the calls after FB popped 10.8% by the close; that is, a straight purchase of calls would have easily become my biggest trade of the year. As in some other busted calendar spreads, I allowed the assignment of the short side and decided to roll through options against that short side after taking profits on the long side. The short put spread expired harmless of course and helped defray the cost of the calendar call gaffe. I added a twist this time by buying more calls than needed for the hedge and taking profits on the “extra” calls.
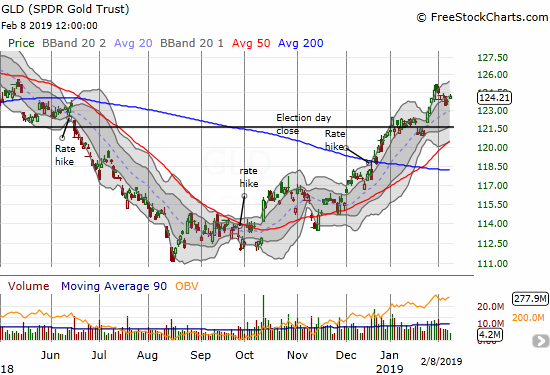
SPDR Gold Shares (GLD)
The U.S. dollar (DXY) regathered itself in the last week and caused a quick top in gold. I quickly bought the dip with call options expiring in March. I now wait for the trade to come back o life.
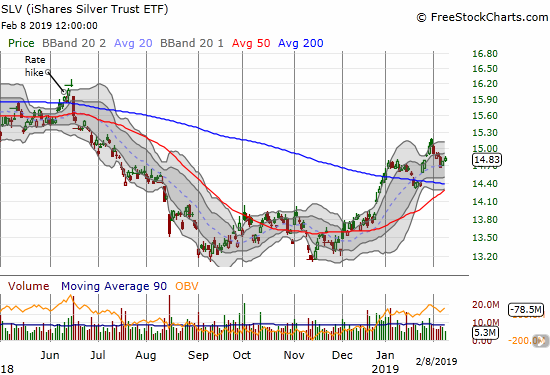
iShares Silver Trust (SLV)
SLV dipped alongside GLD. I decided to jump on March calls on SLV as well even though SLV often under-performs GLD given the drag economic fears can exert. While the U.S. dollar strengthened last week in the face of what looks like a global retreat by central banks, I think the global flight of the doves will soon enough put more air under the wings of precious metals.
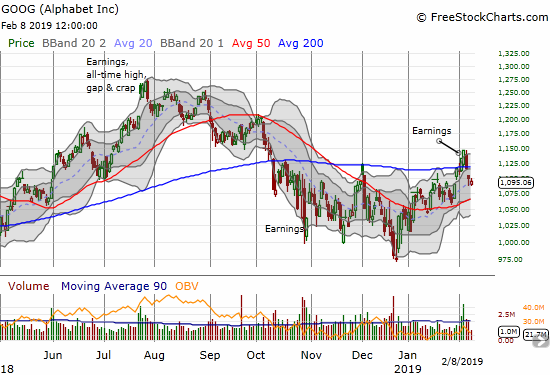
Alphabet (GOOG)
GOOG was one of the rare stocks on my radar that managed to come back strong from an initially poor post-earnings response, to a strong comeback, and right back into the dumps. The gyrations gave me a serious case of whiplash. I had a put spread in play ahead of earnings and thought I was golden when I saw the 3% loss in after-hours. The subsequent 200DMA breakout forced me from bearish to bullish. I did not wait for confirmation and paid the price. I failed to notice the signs that the tide had turned around again. GOOG is now right back into limbo between its 50 and 200DMAs.
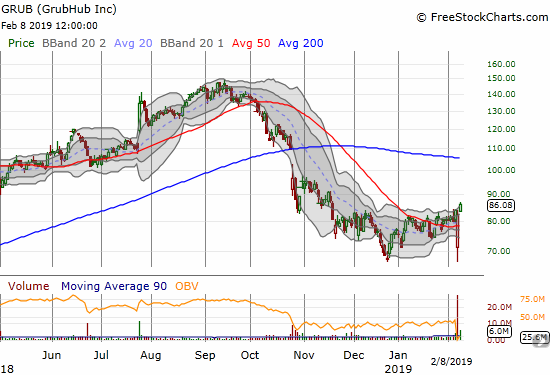
GrubHub (GRUB)
At the beginning of the month, I pointed out GRUB as a potentially explosive stock in the middle of a consolidation phase. Earnings on Thursday took the stock down right to its December low, yet I did not make a move. I figured I would have time to decide on a trade. The market waits for no one: before I realized it, GRUB reversed its entire post-earnings gap down. The stock gained another 4.6% on Friday and closed at a near 3-month high. The stock quickly went from a bearish breakdown to a bullish breakout from consolidation.
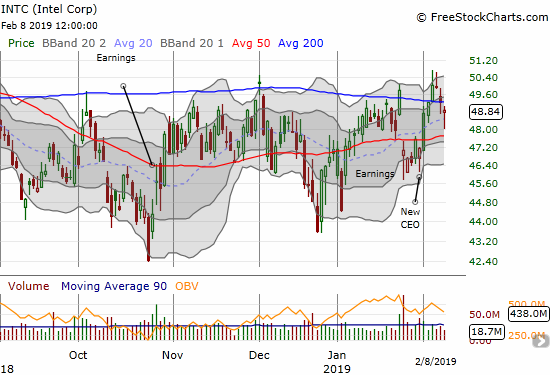
Intel (INTC)
I only had to wait two days for INTC to deliver the next buying opportunity I was seeking. As the stock neared 50DMA support, I loaded up on a fresh batch of call options with March $50s. I like the strong bounce from the intraday lows, but of course the failed 200DMA breakout for SMH is a yellow flag for all semis.
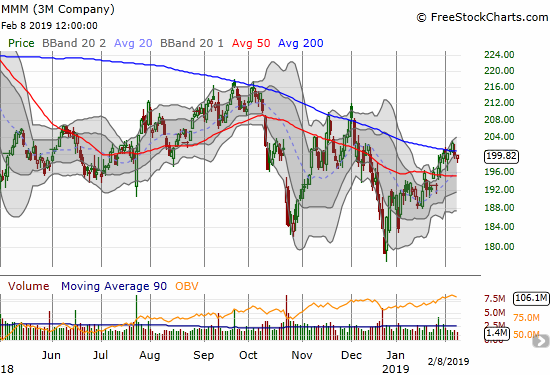
3M Company (MMM)
I am keeping an eye on MMM as it struggles with its downtrending 200DMA. This line has served three times as reliable resistance since October. A confirmed 200DMA breakout would be VERY bullish, but I am leaning toward a fresh sell-off here.
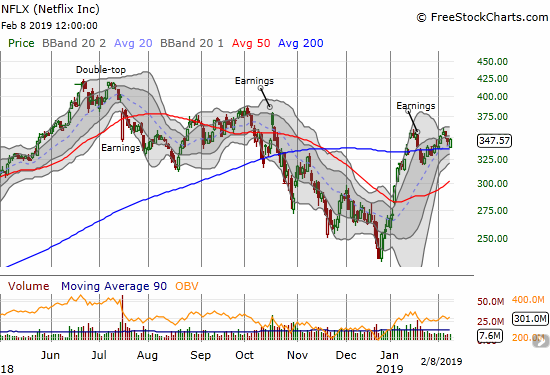
Netflix (NFLX)
I am still waiting patiently for NFLX to start selling off again. On Friday, the stock neatly bounced off 200DMA support. I may be waiting for a while longer…
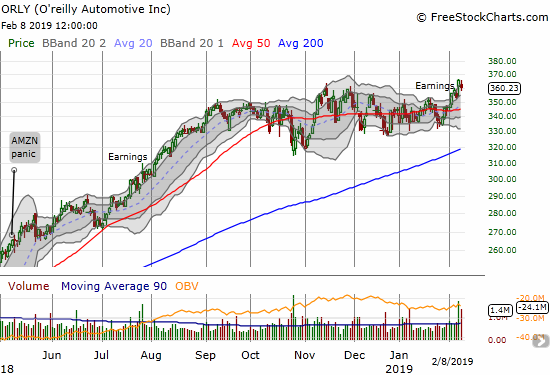
O’reilly Automotive (ORLY)
ORLY is warming up its engines again. Earnings gave it a small boost to new all-time highs. It’s a mild move but a breakout is a breakout in this case. I am looking to buy shares this week.
Children’s Place (PLCE)
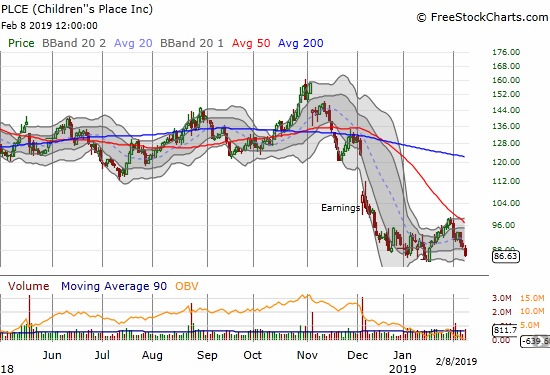
PLCE finally broke out from its trading range, and, as planned, I sold my call options on the test of downtrending 50DMA resistance. I am surprised that the stock headed straight down from there. PLCE looks ready to retest the recent lows. I am content to wait out the resolution of this test before deciding on a next move, if any.
Molson Coors Brewing Co (TAP)
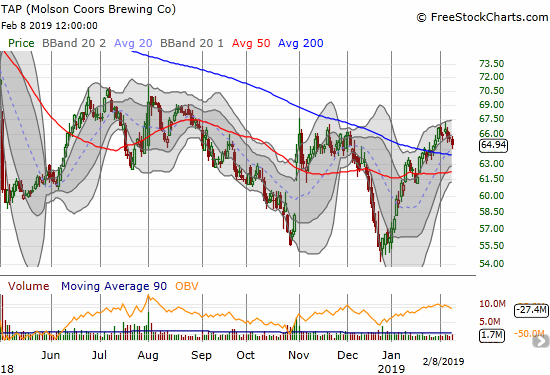
Bud Light caused a stir with a Super Bowl commercial accusing its competitors of stuffing their beers with corn syrup. From the tag line of the YouTube video: “The gang goes on a trek to return a barrel of corn syrup. Because Miller Lite and Coors Light use corn syrup. And Bud Light doesn’t.” Well, the corn syrup looks like it could be good enough to hold a 200DMA breakout. I like buying here with a stop below the 50DMA.
Toll Brothers (TOL)
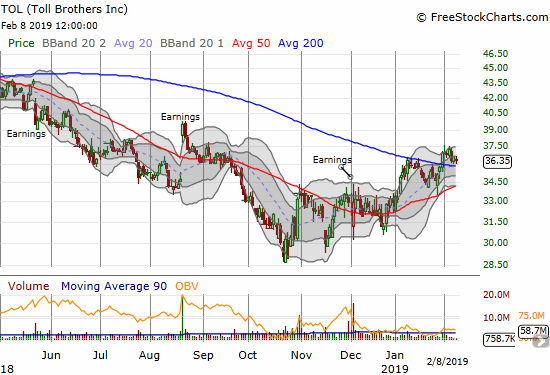
My wary housing watch continues with monitoring TOL’s exploration of 200DMA support. If the stock can survive this test, I can get a lot more bullish on home builders and housing plays.
Tapestry (TPR)
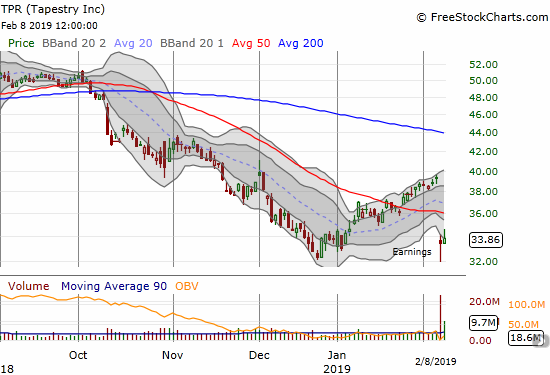
When TPR was just Coach (COH), I used to love trading the stock post-earnings. Now, the company just keeps doing worse. Like so many stocks, TPR rode the wave of blind optimism from the December lows. The stock traded almost steadily upward through its upper Bollinger Band channel…until earnings. Given the bounce from the December low, TPR could be a more sustained buy on a fresh 50DMA breakout.
Twitter (TWTR)
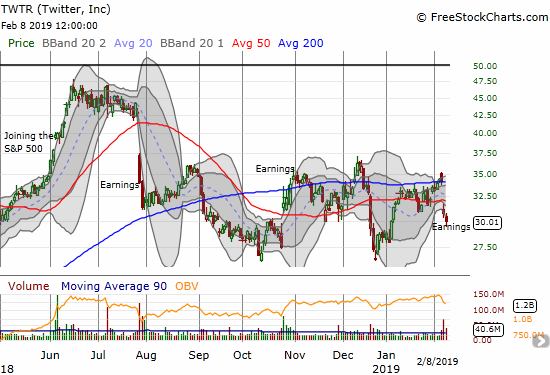
A while back I decided to hold a core position in shares in TWTR; I am officially a fanboy. I am trying to trade around that position on periodic dips like the latest bump from earnings. On Friday, I bought April $32 call options as a play on a bounce back to at least 200DMA resistance.
SPDR S&P Retail ETF (XRT)
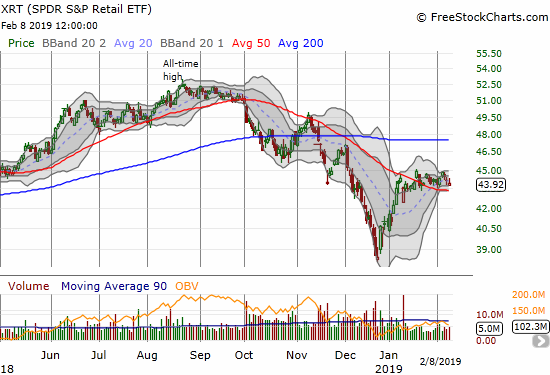
XRT is maintaining its 50DMA breakout with a tepid trading range. The ETF looks tired, and I will not be surprised by a fresh 50DMA breakdown in the coming week or two. Along with home builders and financials and perhaps soon semiconductors, the behavior of retail keeps me cautious and eager to buy hedges in this extended overbought period.
— – —
FOLLOW Dr. Duru’s commentary on financial markets via email, StockTwits, Twitter, and even Instagram!
“Above the 40” uses the percentage of stocks trading above their respective 40-day moving averages (DMAs) to assess the technical health of the stock market and to identify extremes in market sentiment that are likely to reverse. Abbreviated as AT40, Above the 40 is an alternative label for “T2108” which was created by Worden. Learn more about T2108 on my T2108 Resource Page. AT200, or T2107, measures the percentage of stocks trading above their respective 200DMAs.
Active AT40 (T2108) periods: Day #25 over 20%, Day #23 over 30%, Day #22 over 40%, Day #21 over 50%, Day #17 over 60%, Day #11 over 70% (overperiod, 7-day 80% overperiod ended)
Daily AT40 (T2108)

Black line: AT40 (T2108) (% measured on the right)
Red line: Overbought threshold (70%); Blue line: Oversold threshold (20%)
Weekly AT40 (T2108)

*All charts created using freestockcharts.com unless otherwise stated
The T2108 charts above are my LATEST updates independent of the date of this given AT40 post. For my latest AT40 post click here.
Related links:
The AT40 (T2108) Resource Page
You can follow real-time T2108 commentary on twitter using the #T2108 or #AT40 hashtags. T2108-related trades and other trades are occasionally posted on twitter using the #120trade hashtag.
Be careful out there!
Full disclosure: long UVXY calls, long TWTR shares and calls, long INTC calls, long GLD shares and calls, long SLV shares and calls, short FB shares and long calls, short GS
*Charting notes: FreeStockCharts.com stock prices are not adjusted for dividends. TradingView.com charts for currencies use Tokyo time as the start of the forex trading day. FreeStockCharts.com currency charts are based on Eastern U.S. time to define the trading day.
