
AT40 = 27.6% of stocks are trading above their respective 40-day moving averages (DMAs)
AT200 = 25.6% of stocks are trading above their respective 200DMAs (just above a 32-month low)
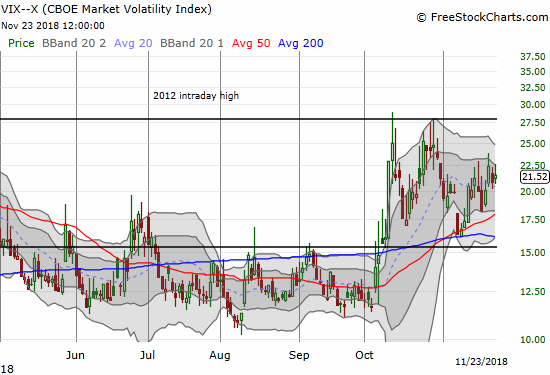
VIX = 21.5
Short-term Trading Call: neutral
Commentary
Last week on November 20th, AT40 (T2108), the percentage of stocks trading above their respective 40-day moving averages (DMAs), dropped close to oversold conditions. At the same time, AT200 (T2107), the percentage of stocks trading above their respective 200DMAs, dropped to a new 32-month low. With a whole host of poor reactions to company earnings reports, the stock market looked like it was barely holding on.
The damage in the breadth indicators took a pause after that day. Over two days, AT40 crawled its way from 23.4% to 27.6%. AT200 increased from 24.7% to 26.4% the next day only to end the week at 25.6%. The struggles of the buyers showed up clearly in the major indices, a small divergence with AT40 that set up a very mild bullish divergence (“very mild” meaning I do not take comfort in the move).
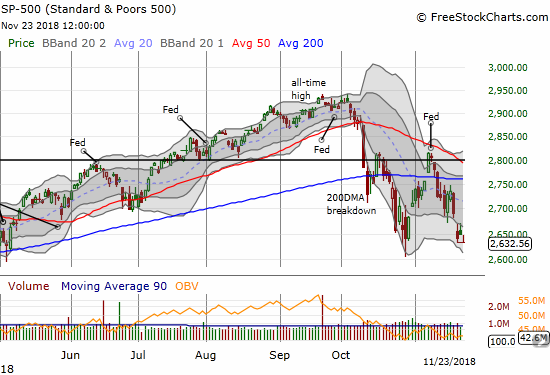
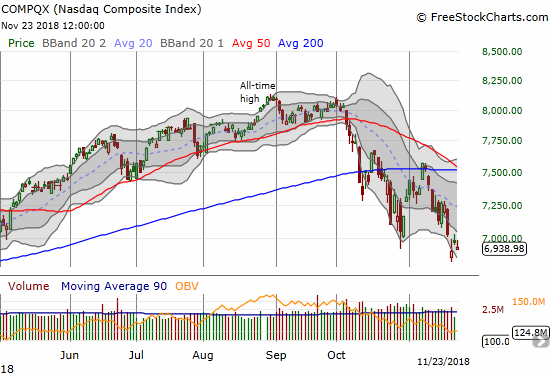
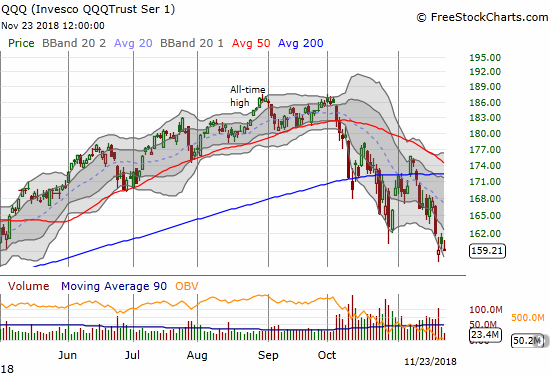
The S&P 500 (SPY) lost 0.7% to close near a new 7-month closing low. The NASDAQ lost 0.5% but avoided a new multi-month low. The Invesco QQQ Trust (QQQ) ended the week even with its near 7-month closing low as it lost 0.7%.
The volatility index, the VIX, ended the week off its recent high but is still at an elevated level (above 20).
The stock market is still in desperate need of positive catalysts to break out of this cycle of selling (could the G20 deliver a Hail Mary save?). While another bullish divergence emerged, I am keeping the short-term trading call at neutral. I downgraded all the way from bullish to neutral a little over two weeks ago because of the 200DMA breakdown for the S&P 500. The trading last week further validated that change. I am still looking for the market to drop into oversold territory to start a fresh bottoming process.
CHART REVIEWS
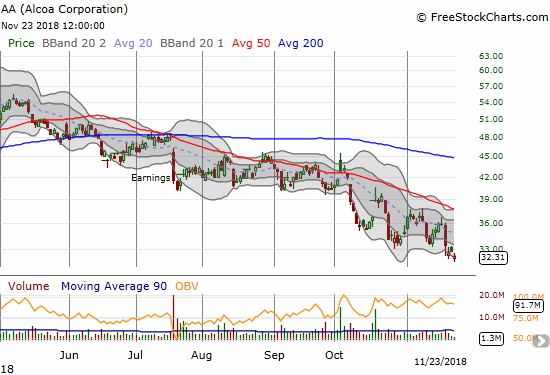
Alcoa (AA)
I accumulated AA earlier this year as a small play to try to ride U.S. tariffs designed to protect American aluminum and steel producers. If those tariffs are helping, I hate to consider how much WORSE off these companies would be without the props. AA experienced a fresh breakdown in October and now trades at a 17-month low.
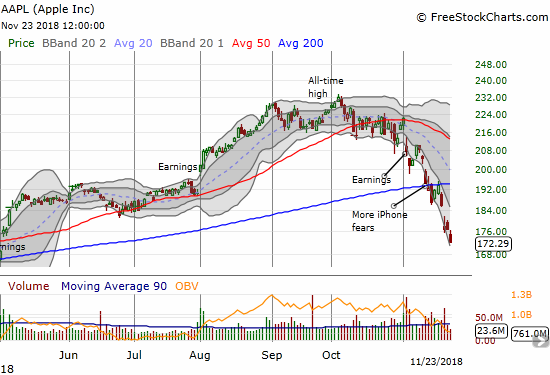
Apple (AAPL)
AAPL still acts like an anchor around the market’s neck. Bad news about iPhone production keeps coming, and the sellers keep selling. With the extended 200DMA breakdown, AAPL looks like it just printed a major top. The August breakout is a distant memory. Tim Cook and company better put that major buyback plan into hyperdrive.
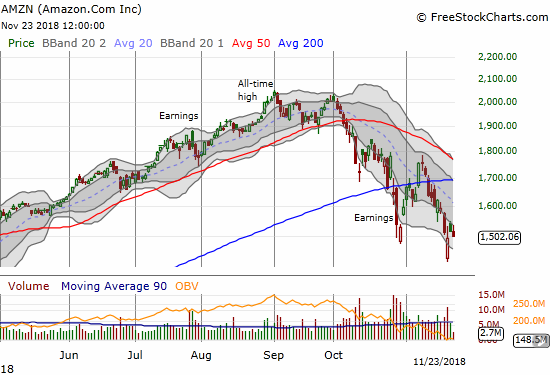
Amazon.com (AMZN)
AMZN is following a steep downtrend off its last high. The pressure remains on the stock despite a sharp and impressive rebound from a huge gap down early in the week. AMZN sagged to end the week.
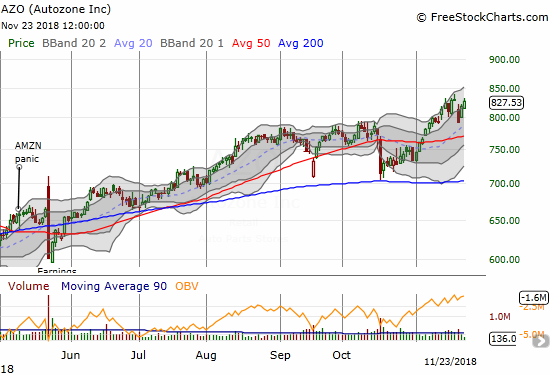
Autozone (AZO)
Auto parts stores are trying to hold the banner for retailers. AZO is fractionally off its all-time high.
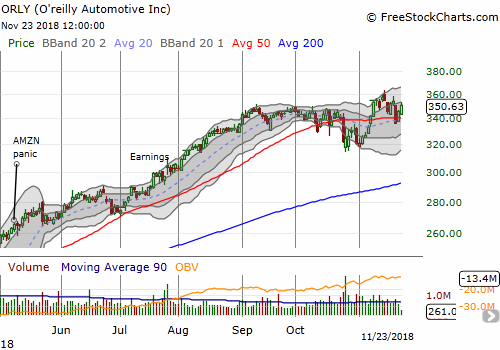
O’Reilly Automotive, Inc. (ORLY)
ORLY is helping AZO carry the banner for retail. However, This auto parts retailer may have stalled out below its all-time high.
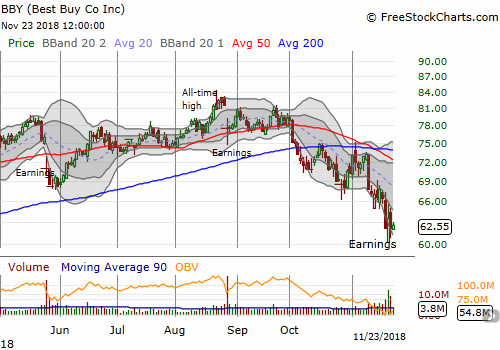
Best Buy (BBY)
BBY initially gapped down post-earnings, but buyers quickly rushed in. Sellers took over again the next day and left BBY stuck in a downward push through its lower Bollinger Band (BB) channel.
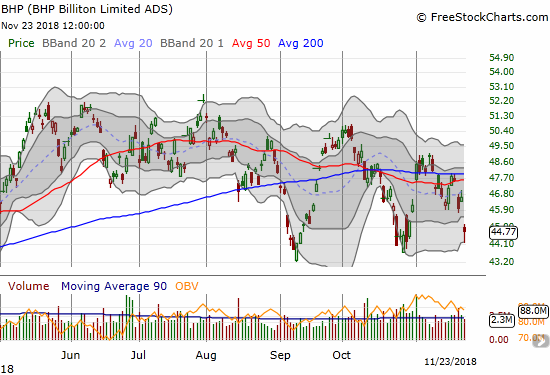
BHP Group (BHP)
BHP gapped down for a 4.0% loss. Overall, BHP is holding up pretty well given the recent sell-offs in commodities. The stock is still holding its recent trading range.
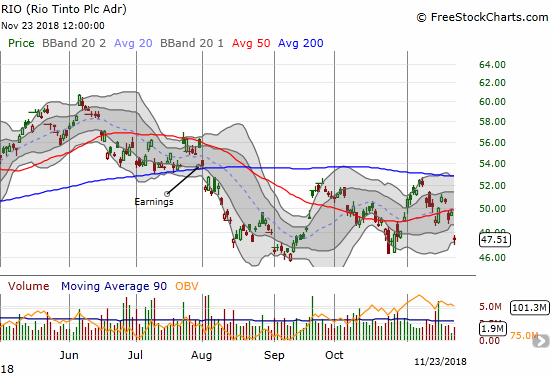
Rio Tinto (RIO)
Like BHP, RIO is doing relatively well considering the current sell-off in commodity prices. Iron ore in particular has tumbled nearly straight down for a week after hitting a topping pattern. I took profits on my put options that were part of the long BHP vs short RIO pairs trade. Ironically, I chose to lean net bullish this round. The BHP calls are very deflated…
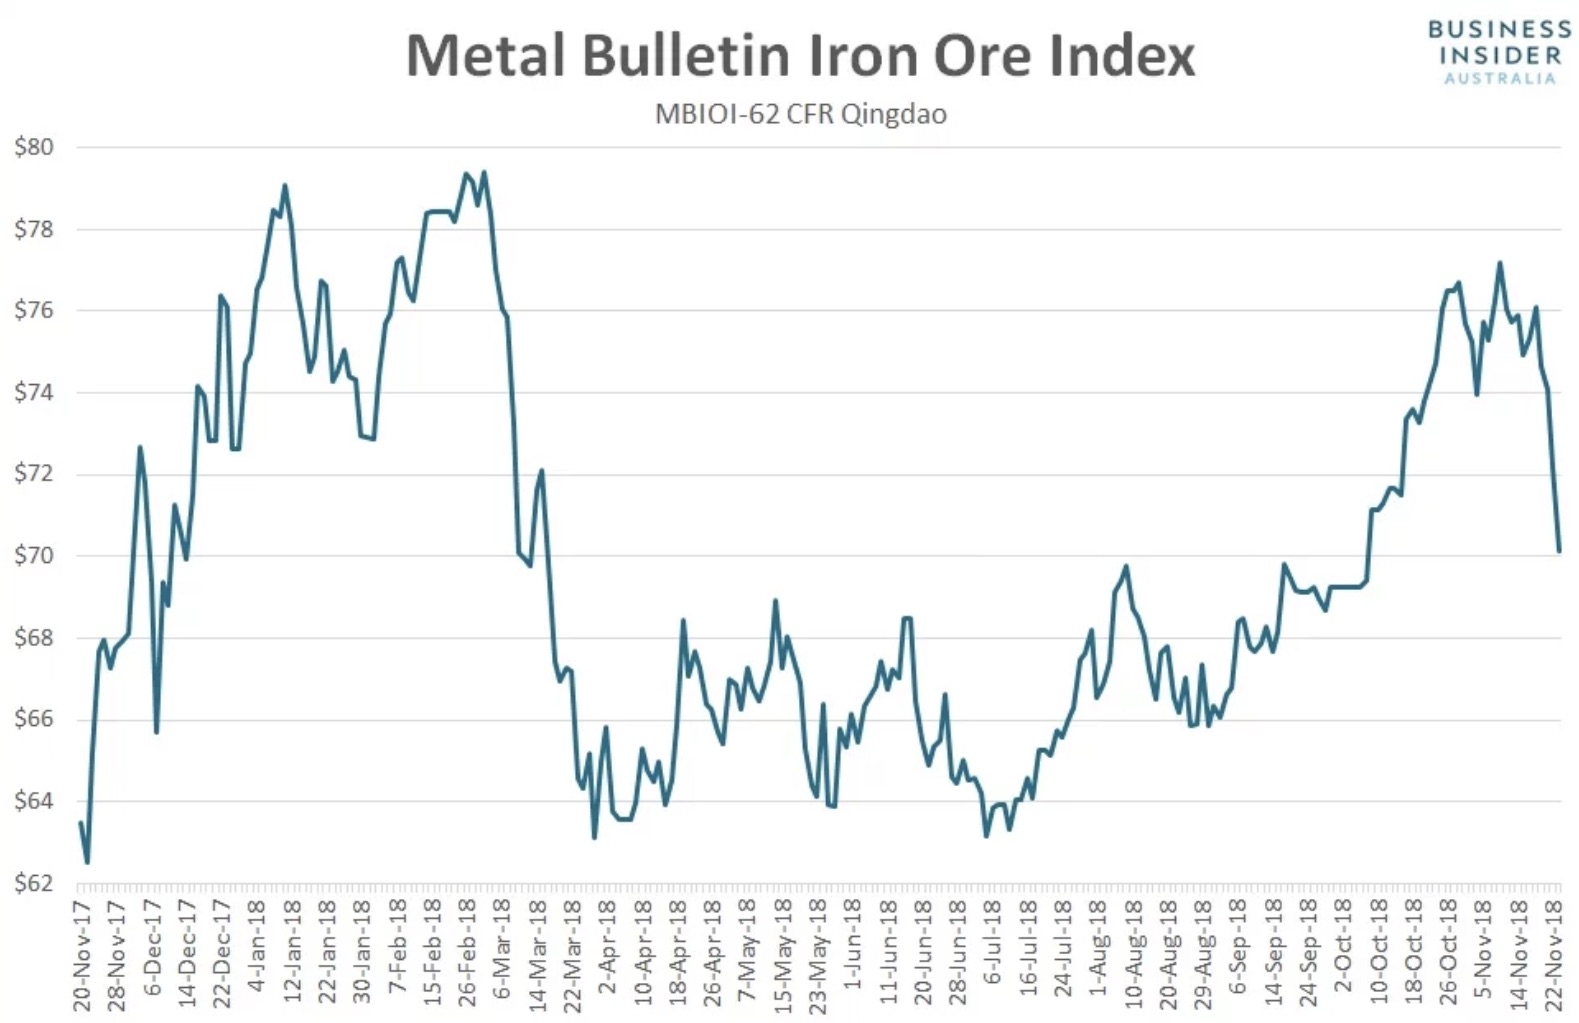
Source: Business Insider Australia
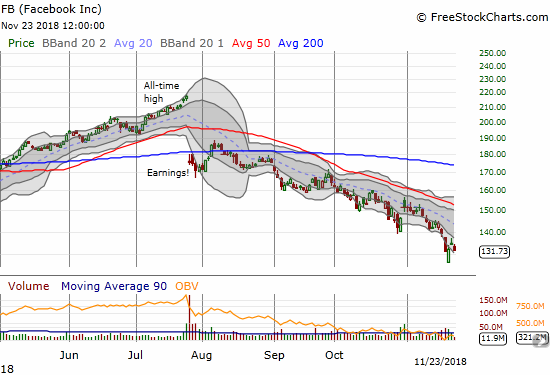
Facebook (FB)
FB is a very broken stock at this point. The relentless selling only took a brief break after the October earnings report.
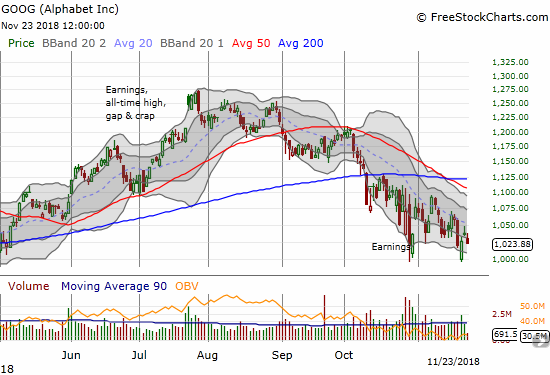
Alphabet (GOOG)
GOOG’s downtrending 20DMA is keeping a tight lid on the stock, but GOOG is faring better than other big cap tech stocks. GOOG is holding a trading range in place for the past month or so.
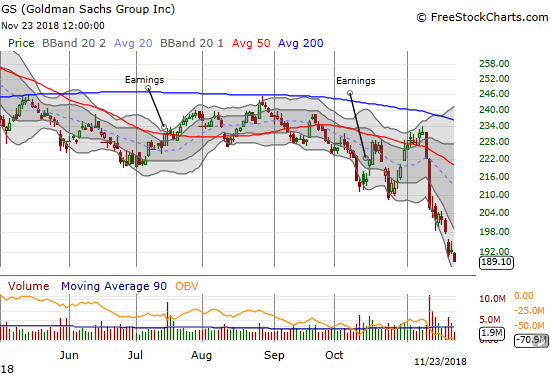
Goldman Sachs (GS)
GS is down 7 of the last 10 trading days. With a 2-year low in place, the GS sell-off looks ever more alarming.
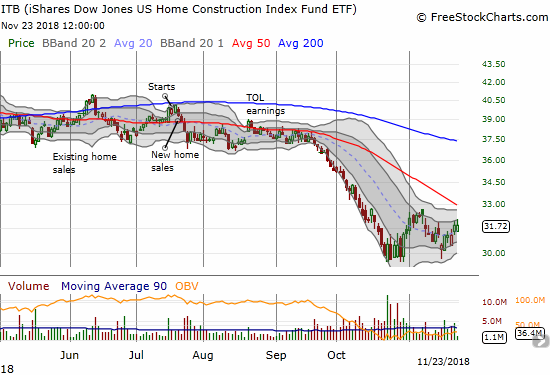
iShares US Home Construction ETF (ITB)
The news for home builders is now undeniably bad. In a classic contrarian move, the buyers are finally stepping into the stocks of builders. All these stocks need now is a more friendly Federal Reserve…something I am guessing buyers are trying to anticipate.
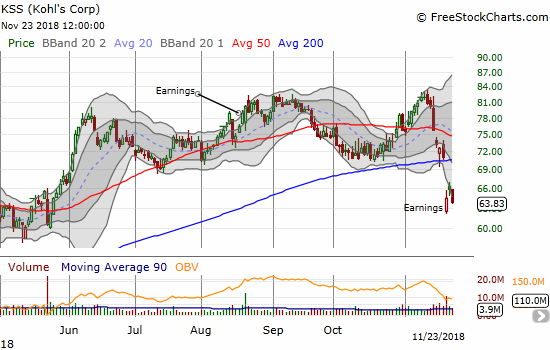
Kohl’s Corporation (KSS)
Welcome to the top in retailers, KSS…
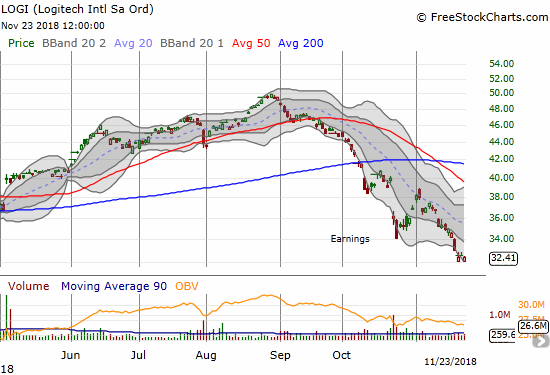
Logitech (LOGI)
I expected LOGI to hold its post-earnings low. Last week blew through that hope.
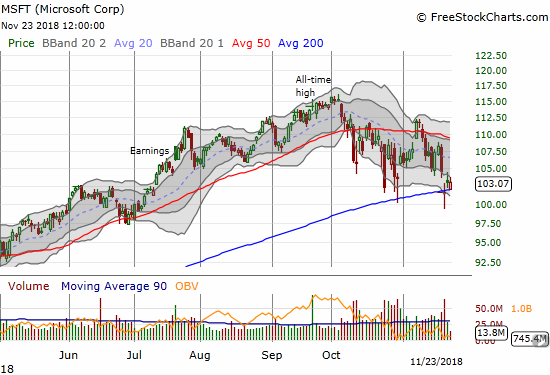
Microsoft (MSFT)
With only 25.6% of stocks trading above their respective 200DMAs, I was surprised to notice MSFT holding its 200DMA support. This levitation is even more impressive given the near relentless selling pressure being suffered by big cap tech stocks. MSFT is at the top of my buying list when the market launches its next rally.
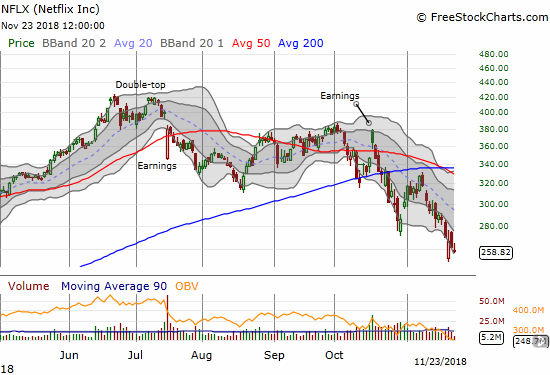
Netflix (NFLX)
The sellers in NFLX returned very quickly after the big rebound. NFLX closed at a 21-month low. I continue to like fading rallies in NFLX.
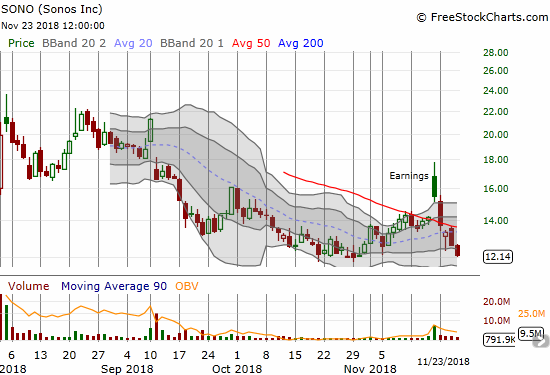
Sonos (SONO)
SONO had a tremendous post-earnings response, but sellers quickly descended upon the stock. In four more trading days, the gap and crap almost became a new all-time low for this recent IPO. I was one of the post-earnings sellers as I was grateful to have those profits. I bought SONO right back after buyers seemed to return two days later.
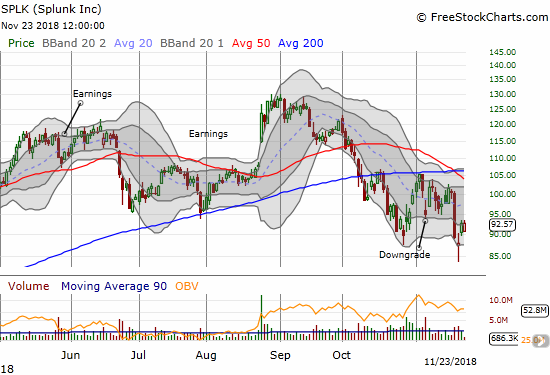
Splunk (SPLK)
SPLK turned in an encouraging bounce last week off its intraday low. The buyers held that support. I am not a buyer, however, as earnings are coming up after hours on November 29th. I will be watching closely!
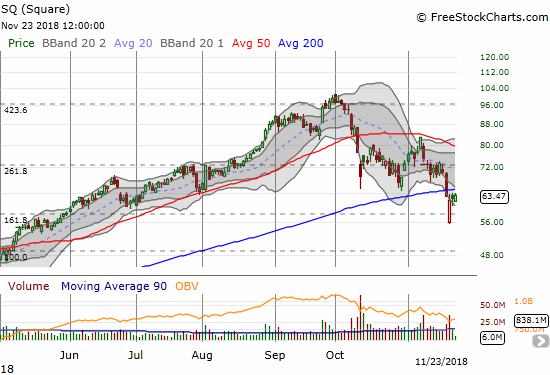
Square (SQ)
SQ looks like it is breaking down. The stock finally gave up its 200DMA support last week. Here is an example of my creeping bearishness. I sold this stock after holding it a long time. The technicals are breaking down, and I want out before a definitive confirmation of the topping pattern. If the sell-off continues I do not see natural support until around $45; that is a price where I would become a very interested buyer. To the upside, a 50MDA breakout would normally get me interested, but this is not a market strong enough to support breakout buys, especially on expensive and/or speculative stocks.
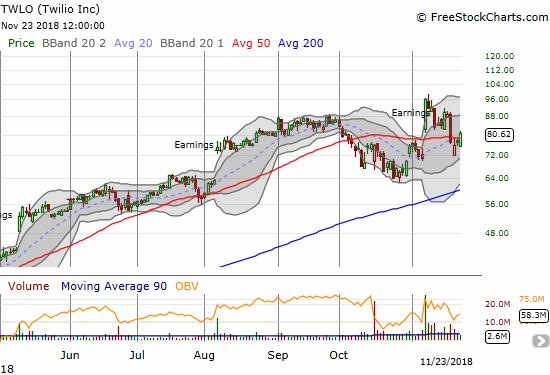
Twilio (TWLO)
The rebirth of TWLO has been impressive. Still, even TWLO succumbed to selling pressure last week. TWLO lost its entire 35.4% post-earnings gain at its intraday low last week. With the stock holding its 50DMA, I have it on my buy list in the case of renewed market strength.
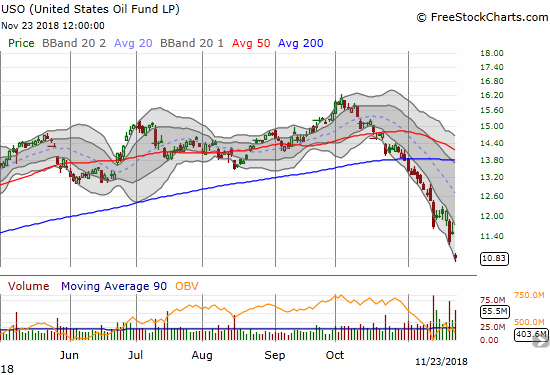
United States Oil (USO)
I wanted to buy puts in USO last week, but the price just did not seem right. I should have just shorted the shares. USO plunged again on Friday to the tune of a 6.0% gap down loss. The plunge in oil is accompanying the broad sell-off in commodities in what looks like a bad sign for the health of global growth.
Energy Select Sector SPDR ETF (XLE)
No surprise that XLE is under pressure: XLE is fighting a weakening stock market and a plunge in oil. Friday’s gap down broke important support and plunged XLE into bearish territory.

— – —
FOLLOW Dr. Duru’s commentary on financial markets via email, StockTwits, Twitter, and even Instagram!
“Above the 40” uses the percentage of stocks trading above their respective 40-day moving averages (DMAs) to assess the technical health of the stock market and to identify extremes in market sentiment that are likely to reverse. Abbreviated as AT40, Above the 40 is an alternative label for “T2108” which was created by Worden. Learn more about T2108 on my T2108 Resource Page. AT200, or T2107, measures the percentage of stocks trading above their respective 200DMAs.
Active AT40 (T2108) periods: Day #16 over 20%, Day #3 under 30% (underperiod), Day #10 under 40%, Day #44 under 50%, Day #60 under 60%, Day #113 under 70%
Daily AT40 (T2108)
")
Black line: AT40 (T2108) (% measured on the right)
Red line: Overbought threshold (70%); Blue line: Oversold threshold (20%)
Weekly AT40 (T2108)

*All charts created using freestockcharts.com unless otherwise stated
The charts above are my LATEST updates independent of the date of this given AT40 post. For my latest AT40 post click here.
Related links:
The AT40 (T2108) Resource Page
You can follow real-time T2108 commentary on twitter using the #T2108 or #AT40 hashtags. T2108-related trades and other trades are occasionally posted on twitter using the #120trade hashtag.
Be careful out there!
Full disclosure: long SSO, long UVXY puts, long NFLX put spread, long GOOG calendar put spread, long AMZN calendar put spreads, long QQQ put, long AAPL calls, long AA, long BBY puts, long BHP calls, long FB calls, long ITB calls, long LOGI, long SONO,
*Charting notes: FreeStockCharts.com stock prices are not adjusted for dividends. TradingView.com charts for currencies use Tokyo time as the start of the forex trading day. FreeStockCharts.com currency charts are based on Eastern U.S. time to define the trading day.
Nice GIF! I came here to see what you wrote about SONO. Stochastic Buy Signal has it on my radar for tomorrow
Thanks for stopping by! 🙂
Looks like I need to buy a lot more SONO! (Buy em all??)