
AT40 = 57.1% of stocks are trading above their respective 40-day moving averages (DMAs)
AT200 = 57.5% of stocks are trading above their respective 200DMAs
VIX = 12.9
Short-term Trading Call: neutral
Commentary
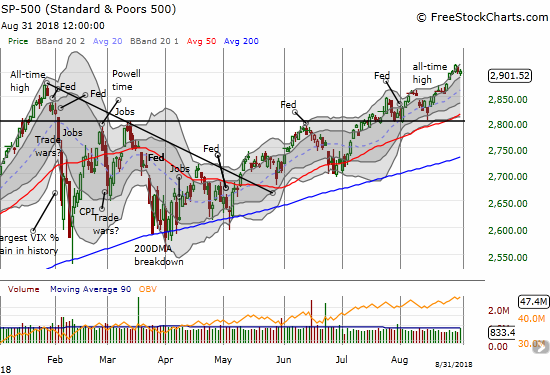
In my last Above the 40 post, I discussed the early signs of a potential run-up driven by the “fear of missing out” (FOMO). The S&P 500 (SPY) closed two more days at or above its upper Bollinger Band (BB). The last close was a new all-time high. The last two days of the month featured some drift back to the bottom of the upper-BB channel that looks like a brief rest waiting for the refueling that can come with the end of summertime trading.
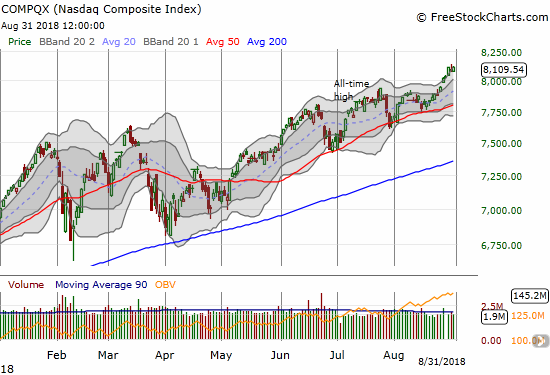
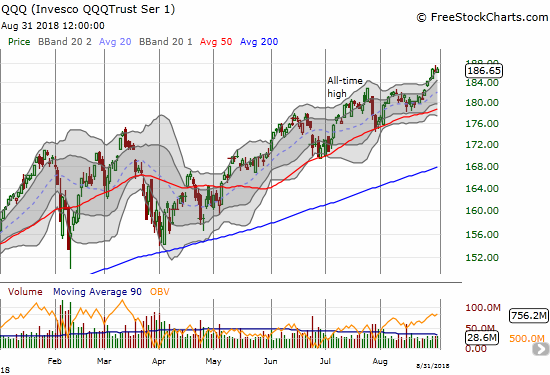
Needless to say, the NASDAQ and the Invesco QQQ Trust (QQQ) are also in fresh run-ups.
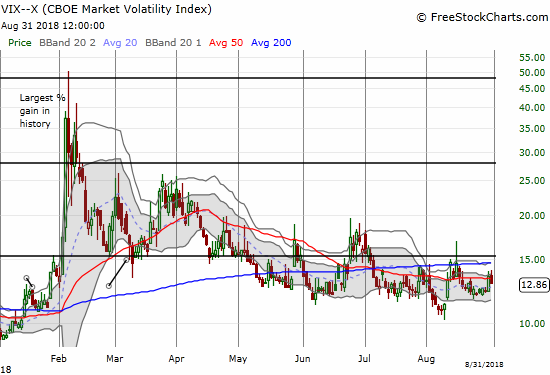
The volatility index did NOT cooperate with the week’s run-up. On Thursday, the VIX jumped 10.4% and even closed near its high of the day. Volatility faders came back the next day and reversed half the gain. Still, post-summer trading will start with a potential resumption of FOMO AND volatility. The small spark in volatility is particularly important because the market is now just 4 trading days from officially ending what looks like a very brief period of extremely low volatility (ELV). I am still refining my understanding of the implications of these periods of ELV.
AT40 (T2108), the percentage of stocks trading above their respective 40-day moving averages (DMAs), took a hit to close out the week. The drop back to 57% is more evidence that my favorite technical indicator is not confirming the market’s overall bullishness. Underneath, there is still enough undertow to seed the next pullback. I am keeping the short-term trading call at neutral out of deference to price momentum. More importantly, if the buyers return after this Labor Day weekend, there is considerable runway between here and an overbought reading for AT40 (above 70%). I cannot even think about bearishness until/unless AT40 fails at the overbought threshold or falls below it. I do not quite have enough evidence to make a bet on a pullback from here to uptrending 50DMA support.
The Australian dollar is offering its own version of caution but political turmoil is clouding this usually reliable signal of the market’s appetite for risk-taking. In the wake of political tumult in the country, the Aussie plunged against major currencies. The weakness took the currency to a new 22-month low against the Japanese yen. AUD/JPY has now broken down below what was a wide 5-month trading range. At the time of writing, the Reserve Bank of Australia (RBA) is within hours of issuing its latest pronouncements on monetary policy. This event should either confirm the breakdown or trigger the next bounce off lows for AUD/JPY. I am getting ready to trade the aftermath after the dust settles a bit.
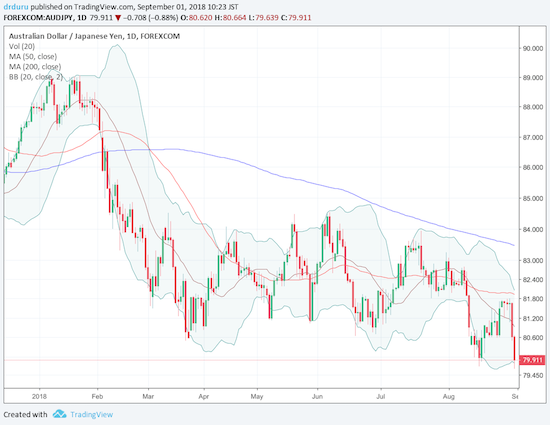
Source: TradingView.com
The U.S. dollar index is offering its own separate opinions. Last week closed with a bounce after optimism over the end of trade war risks proved premature. When President Trump promised on Thursday to follow-through on another $200B in tariffs on China, it caused enough jitters to send the VIX up and the S&P 500 down. Still, last week’s action slightly reduced my bullishness on the dollar given how ready the market appears to sell the dollar on any bit of dollar-negative news.
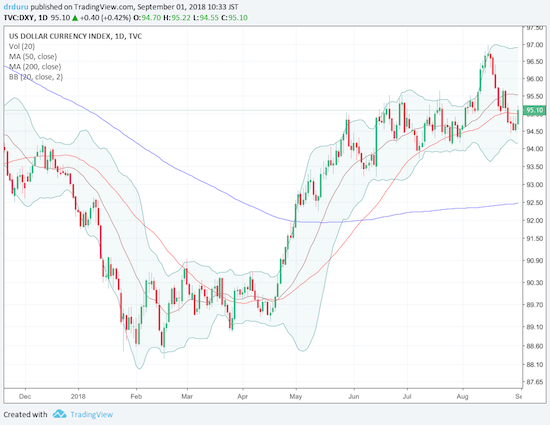
Source: TradingView.com
The bounce in the dollar included a bounce against the Mexican peso. The trade setup fading USD/MXN against its 200DMA worked out well but only as quick swing trades. I am now playing fades with the USD/MXN pulling away from its 200DMA as support. This trade is more risky, but I like the position as a small hedge against my dollar-bullishness that will delivery good carry.
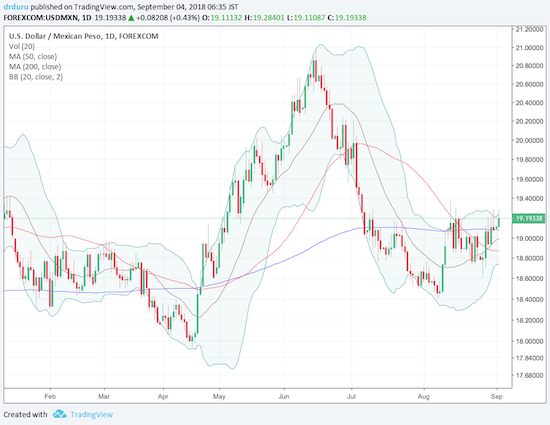
Source: TradingView.com
CHART REVIEWS
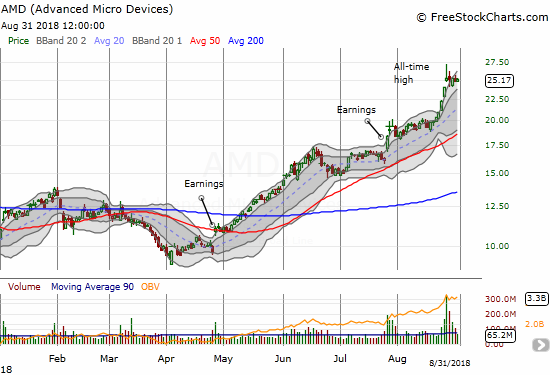
Advanced Micro Devices (AMD)
I earlier made a case for a blow-off top in AMD. Sellers ALMOST followed-through on the pattern, but they only closed Monday’s gap up on an intraday basis. Wednesday’s gap down was immediately met by buyers. Buyers subsequently failed to restart upward momentum, so AMD is now stuck in a stalemate. I positioned for a blow-off top, but a move back to the upper-Bollinger Band will suggest the market’s readiness to continue the (parabolic) march toward infinity.
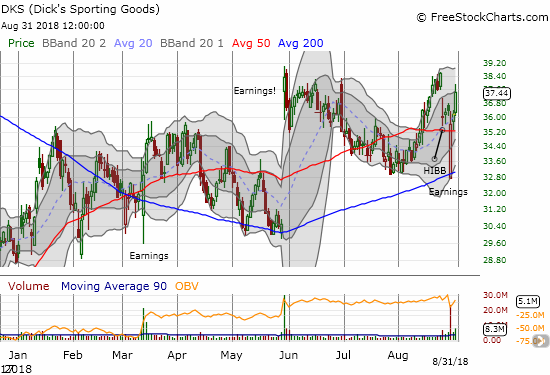
Dick’s Sporting Goods (DKS)
DKS gapped down hard in response to its earnings last week, but 200DMA support proved up to the task. This rebound makes a bottoming in DKS even more convincing.
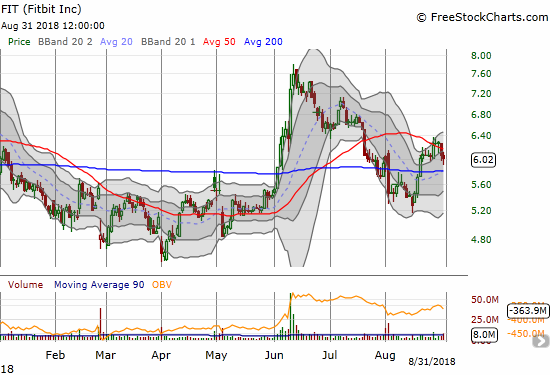
Fitbit (FIT)
In June, FIT caught my attention as a potential catch-up play for money managers who do not want to chase the major indices higher. As luck would have it, FIT peaked out the next day. In two months, FIT finished reversing its entire breakout. The stock is back to struggling, and I am looking for salvage value in the call options I accumulated during the reversal.
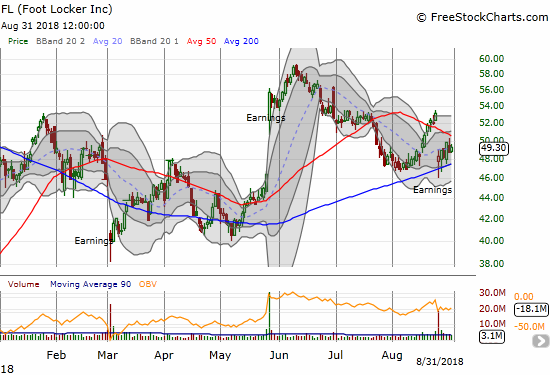
Footlocker (FL)
With 12% of its float sold short, FL looked poised to be another retailer with an outsized post-earnings surge….especially with a 50DMA breakout ahead of the report. Instead, FL gapped right back down to 200DMA support. A grinding recovery off that support seems underway. Accordingly, I am holding onto a bullish, hedged pre-earnings position I put on ahead of earnings.
While the first week of September offers the end of summertime trading and the beginning of more “normalcy”, this time also marks the period where I get more distracted with sports. Feeding my habit will be live football streamed on Yahoo Sports…
— – —
FOLLOW Dr. Duru’s commentary on financial markets via email, StockTwits, Twitter, and even Instagram!
“Above the 40” uses the percentage of stocks trading above their respective 40-day moving averages (DMAs) to assess the technical health of the stock market and to identify extremes in market sentiment that are likely to reverse. Abbreviated as AT40, Above the 40 is an alternative label for “T2108” which was created by Worden. Learn more about T2108 on my T2108 Resource Page. AT200, or T2107, measures the percentage of stocks trading above their respective 200DMAs.
Active AT40 (T2108) periods: Day #135 over 20%, Day #104 over 30%, Day #99 over 40%, Day #12 over 50% (overperiod), Day #2 under 60% (underperiod), Day #55 under 70%
Daily AT40 (T2108)
")
Black line: AT40 (T2108) (% measured on the right)
Red line: Overbought threshold (70%); Blue line: Oversold threshold (20%)
Weekly AT40 (T2108)

*All charts created using freestockcharts.com unless otherwise stated
The charts above are my LATEST updates independent of the date of this given AT40 post. For my latest AT40 post click here.
Related links:
The AT40 (T2108) Resource Page
You can follow real-time T2108 commentary on twitter using the #T2108 or #AT40 hashtags. T2108-related trades and other trades are occasionally posted on twitter using the #120trade hashtag.
Be careful out there!
Full disclosure: long SPY puts, long UVXY calls, long AMD puts, long FIT calls, long DKS and short call, short USD/MXY, net long U.S. dollar, long FL shares and put and short call spread
*Charting notes: FreeStockCharts.com stock prices are not adjusted for dividends. TradingView.com charts for currencies use Tokyo time as the start of the forex trading day. FreeStockCharts.com currency charts are based on Eastern U.S. time to define the trading day.