
I saw a flicker of hope for home builders in the May Housing Market Review. Traders decided to snuff that flicker out very quickly afterward. When I wrote June’s housing market review and described a “struggling flicker,” the iShares US Home Construction ETF (ITB) was once again bouncing off the bottom of 2018’s trading range. Almost like a cycle, a month later the July Housing Market Review came just as ITB tested the bottom of the range once again. Since then, ITB recorded a fresh 2018 and 10-month low in a pattern that has driven a large divergence with the S&P 500 (SPY): ITB is down 13.7% year-to-date while the S&P 500 is just off its all-time high with a 8.5% year-to-date gain.
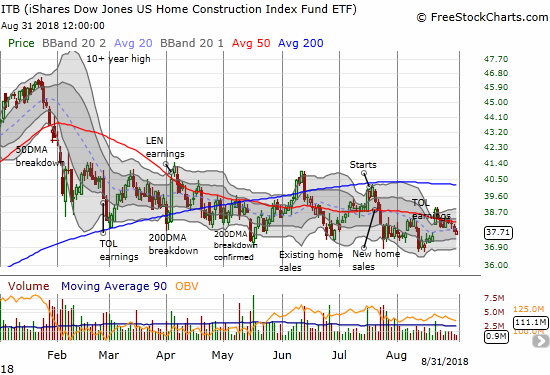
Source: FreeStockCharts.com
Soon after that new low, ITB experienced a jolt from a (surprisingly) positively received earnings report from Toll Brothers (TOL). Unfortunately, existing homes sales data the next day immediately cooled off the enthusiasm. TOL, and ITB in general, is still struggling to recover that brief upward momentum.
New Residential Construction (Single-Family Housing Starts) – July, 2018
While housing starts surged in May and left no doubt that home builders were confident as ever, the subsequent plunge in housing starts in June appeared to temper that enthusiastic interpretation. A small increase in July seems to have stabilized things for now.
Single-family housing starts for June were revised slightly downward from 858,000 to 854,000, ending three straight months of significant upward revisions. July starts increased month-over-month by 0.9% to 862,000, barely off the lowest level of the year. On an annual basis, single-family housing starts increased 2.7%. This small increase erases the previous month’s first year-over-year decline since August, 2016.
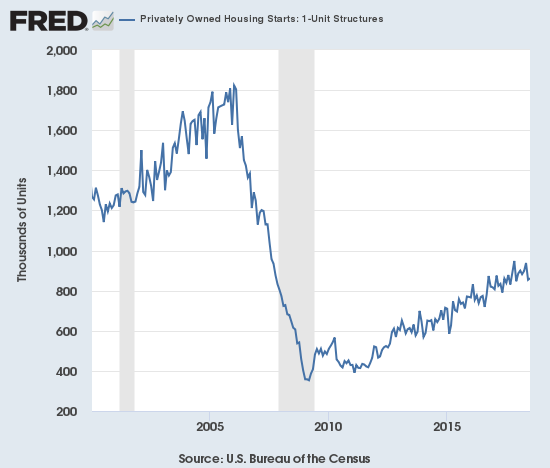
Source: US. Bureau of the Census, Privately Owned Housing Starts: 1-Unit Structures [HOUST1F], retrieved from FRED, Federal Reserve Bank of St. Louis, September, 2018.
Over the 8 months prior to May, regional year-over-year changes in starts exhibited wide dispersion. For May, housing starts were very strong across the board. For June, the Midwest stood out as a large loser. For July, the wide dispersion returned. The Northeast, Midwest, South, and West each changed -2.9%, 18.1%, -0.4%, 3.1% respectively. In other words, the headline bump up in starts was largely driven by the strong bounceback in the Midwest and is not quite as good as it looks on the surface.
Existing Home Sales – July, 2018
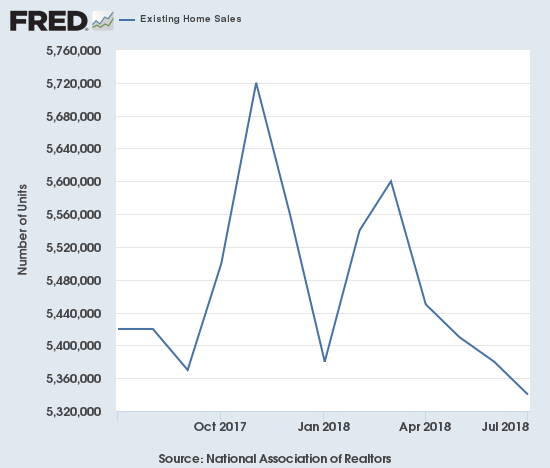
A fourth straight month-over-month decline and a fifth straight month of year-over-year declines in sales for existing homes helped confirm the dampened mood for the stocks of home builders. The news was bad enough to begin a sharp erosion of enthusiasm over earnings from Toll Brothers (TOL) the day before.
The February existing sales numbers ended a 2-month sales decline and softened a bit my alarm bells. In March, monthly sales continued to increase, but the year-over-year change was a decrease. For April, both monthly and year-over-year changes were declines. May recorded similar declines and put existing home sales right back in “yellow” cautionary territory. June and July’s double whammies of monthly and annual declines put existing home sales in “red” territory.
The seasonally adjusted annualized sales in July of 5.34M were down 0.7% month-over-month from 5.38M in sales for June (unrevised). Year-over-year sales decreased 1.5% and once again stayed consistent with the trend of decelerating existing home sales.
(As of the March, 2018 data, the NAR further reduced historical data to just 13 months. For historical data from 1999 to 2014, click here. For historical data from 2014 to 2018, click here)
Source for chart: National Association of Realtors, Existing Home Sales© [EXHOSLUSM495S], retrieved from FRED, Federal Reserve Bank of St. Louis, September 2, 2018.
The routine description for existing sales is usually sales decline because of a shortage of inventory and sales increase in spite of inventory shortages. Sales have not increased for months, so the National Association of Realtors (NAR) took another deep dive on affordability issues which are driven by limited inventory availability. The NAR even blamed a rise in mortgage rates for exacerbating the affordability issue, an effect builders have largely dismissed to-date.
“Too many would-be buyers are either being priced out, or are deciding to postpone their search until more homes in their price range come onto the market…
In addition to the steady climb in home prices over the past year, it’s evident that the quick run-up in mortgage rates earlier this spring has had somewhat of a cooling effect on home sales…This weakening in affordability has put the most pressure on would-be first-time buyers in recent months, who continue to represent only around a third of sales despite a very healthy economy and labor market.”
Ironically, the NAR also claims that demand is highest among first-time buyers in “most areas.” Demand is apparently showing up in Minneapolis, Minnesota thanks to healthier inventory levels. During the press conference the NAR noted that inventory increases in that market helped drive the increase in demand. In its last press conference, the NAR pointed optimistically to inventory increases in Seattle and Denver. I am assuming the expected increase in demand has yet to materialize there.
The “cross-over” in June when inventory increased year-over-year for the first time since June, 2015 looks like a one-time event for now. The 1.92M existing homes represents a seventh straight monthly increase and is 0.5% above June’s inventory. However, last July’s inventory was at the same level. The supply crisis continues to run deep at 4.3 months of supply at the current sales rate, the same as the 4.3 from the prior month and a year ago.
The share of sales going to first-time buyers increased from 31% last month to 32% this month. This share was 31% in May, 33% in April, 30% in March, 29% in February and November was 33%. So while the NAR raises alarms about first-time buyers – for example, in June’s report: “The abrupt hike in mortgage rates this spring, along with price appreciation and competition being the strongest in the entry-level part of the market, is why first-time buyers are not as active as they should be and their participation remains below its historical average” – I still think there is more noise than signal in these data. The share percentage is just bouncing around. Last September was the first time in two years where the share dropped below 30%.
The average share for first-time homebuyers for 2016 was 35%. The NAR’s 2017 Profile of Home Buyers and Sellers reported an average of 34% for 2017. Investors purchased 13% of homes in July, the same as 13% in June. Investor sales averaged a share of 15% in 2017 and 14% in 2016.
Existing home sales decreased across all regions. The NAR blamed the large monthly drop in the Northeast of 8.3% as being the big drag on aggregate existing home sales, but the West’s year-over-year drop is more notable (month-over-month the West actually increased 4.0%): Northeast -1.5%, Midwest -0.8%, South -0.4%, West -4.0% year-over-year. As usual, regional sale fluctuations had no relationship to the on-going price run-ups. May’s price decline in the Northeast was a true outlier. The year-over-year price changes for July were relatively robust: Northeast 6.8%, Midwest 2.5%, South 2.7%, West 5.1%. If not for the relatively steady first-time homebuyer numbers, I would have assumed that higher-end homes are increasingly dominating existing home sales.
July’s 4.5% year-over-year increase in the overall median price of an existing home delivered the 77th consecutive month with a year-over-year increase. The median price of $269,600 is significantly lower than June’s $276,900 and ends three straight months off new all-time highs.
Single-family sales declined 0.2% on a monthly basis and decreased on a yearly basis by 1.2%. The median price of $272,300 was up 4.6% year-over-year.
New Residential Sales (Single-Family) – July, 2018
In February, new home sales barely eked forward. New home sales were resurgent in March. April sales did not keep pace on a monthly basis but delivered a strong year-over-year performance. In a stark contrast to existing home sales, new home sales from May to July have increased in each month on a year-over-year basis. The good news on new home sales failed to stem the follow-on selling in home builders that came from the previous day’s bad news on existing home sales. I can only assume investors are more focused on the on-going declining trend from the last peak set in November, 2017. That peak was special because prior peaks in the post-recession recovery period occurred around the Spring selling season; in other words, November is starting to look like an absolute and not just seasonal or cyclical peak until proven otherwise.
The Census Bureau revised June sales of new single-family homes upward from 631,000 to 638,000, ending three straight months of sizable downward revisions. New home sales for July decreased 1.7% month-over-month and surged 12.8% year-over-year to 627,000. Year-over-year gains regularly hit double digits since 2012; last November’s 26.6% jump was the highest since February, 2015 when new home sales soared 29.8% year-over-year. May broke a string of four months of single-digit gains which represented a concerning deceleration in new home sales. That deceleration continued with June’s numbers. July delivered a much needed return to double-digit growth, but that November peak still sticks out like a sore thumb.
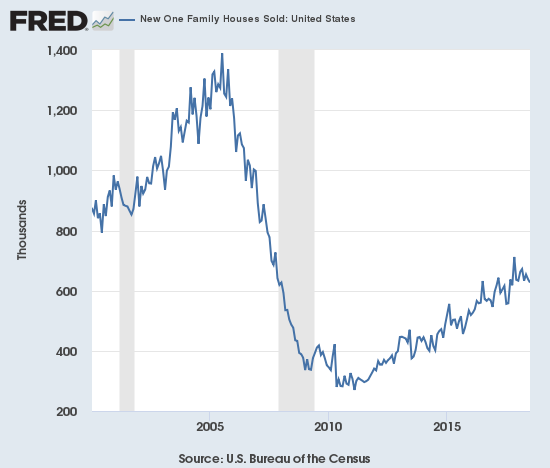
Source: US. Bureau of the Census, New One Family Houses Sold: United States [HSN1F], retrieved from FRED, Federal Reserve Bank of St. Louis, September 2, 2018.
In December, the inventory of new homes dropped to 5.2 months of supply. A market for homes is in balance at 6 months of supply. February’s inventory stood at 5.9 months. It proceeded to decline as low as 5.2 in May. For June, inventory jumped back up to 5.7 days of sales, and in July inventory effectively returned to balance at 5.9. This balance stands in contrast to the NAR’s persistent pleas with home builders do more building.
May’s median price of $313,000 was an actual year-over-year decline. The average price also declined 2.6% year-over-year. June delivered a second straight set of declines. July’s prices bounced back a bit: the median price increased 1.7%, and the average price increased 5.9% year-over-year.
The increase in new home sales would have been even better if not for a plunge in sales in the Northeast of 44.2% year-over-year. The other three regions all increased impressively: Midwest 18.2%, South 17.2%, West 18.5%. The Northeast has been extremely volatile for many months now. While the Midwest and the South continued streaks of multi-month growth, the West’s gains come as a sharp bounceback from a 15.0% year-over-year drop in June.
Home Builder Confidence: The Housing Market Index – August, 2018
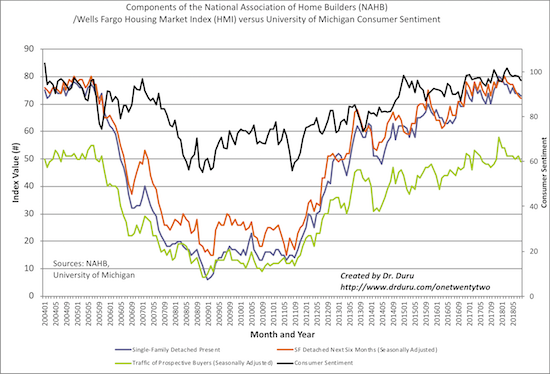
In the April housing market review, I explained why I would not have thought much of March’s slight decline in the Housing Market Index (HMI). At 70, the HMI was still higher than it was for most of 2017. For July, the HMI stayed at 68 for the second straight month. However, the HMI dropped another point in August. While the NAHB cleverly called 67 a “solid reading”, I am very circumspect given the declining existing home sales data and investor skepticism toward the stocks of home builders. HMI is at a new low for 2018. Together the components of HMI still show a pattern of languishing in 2018 and increase the significance of the HMI’s slip to 67. Two factors exist that may allay alarm over 2018’s HMIs: 1) in 2017 the HMI was also slipping to a low around this time (September, 2017 was the nadir for last year at 64), 2) the 69.3 average HMI for 2018 is still higher than 2017’s average of 67.8. I choose to be wary.
The statement from the NAHB in May was very positive with a big caveat for rising prices. For June, the NAHB made an even bigger issue of lumber prices by shining a spotlight on trade actions that drove those prices higher. For August, the NAHB singled out the drivers of poor affordability: “…builders continue to monitor how tariffs and the growing threat of a trade war are affecting key building material prices, including lumber. These cost increases, coupled with rising interest rates, are putting upward pressure on home prices and contributing to growing affordability challenges…” I am now scratching my head over the way affordability issues do not seem to impede new home sales like they are doing to existing home sales. I am surprised that the NAHB did not at least acknowledge the speculator plunge in lumber futures which reversed all of 2018’s gains. Lumber prices should be much less of an issue now.
Source: NAHB
While the overall HMI only dropped by a point, the regional HMIs experienced some dramatic and troubling shifts. The Northeast plunged from a revised 56 to 47, its lowest reading since a 46 in June, 2017. Given the drops in existing and new home sales in the Northeast, builders seem to be confirming that something is significantly wrong in the Northeast market. The Midwest dropped from a revised 63 to 58, the region’s lowest reading since a 58 in October, 2016. The South increased from 70 to 72 and the West stayed flat at 74 to prevent the HMI from suffering a more telling drop for August. The South is the only region with an HMI that is not at a 2018 low.
Needless to say, home builder sentiment will be a key tell in the coming months. If the HMI does not begin a recovery, I will expect a poor start to the seasonally strong period for home builder stocks (November through March/April).
Parting thoughts
The NAR and the NAHB are making louder noises about home affordability and for good reason. Affordability has been a persistently growing issue in the housing market for years. Unfortunately, affordability has no near-term solution with a strong economy pushing interest rates higher, stubbornly anemic wage growth, and on-going supply constraints in major housing markets. The process looks like it is grinding its way to a resolution to the downside.
In August, the NAHB released a telling report titled “Housing Affordability plunged to 10-year low in the second quarter.”
“57.1 percent of new and existing homes sold between the beginning of April and end of June were affordable to families earning the U.S. median income of $71,900. This is down from the 61.6 percent of homes sold in the first quarter that were affordable to median-income earners and the lowest reading since mid-2008.”
California remains ground zero for affordability problems. Even small markets in California offer homes largely unattainable by local families.
“San Francisco, for the third straight quarter, was the nation’s least affordable major market. There, just 5.5 percent of the homes sold in the second quarter of 2018 were affordable to families earning the area’s median income of $119,600.
All five least affordable small housing markets were also in the Golden State. At the very bottom of the affordability chart was Salinas, where 9.8 percent of all new and existing homes sold were affordable to families earning the area’s median income of $69,100.”
The poor affordability metrics threaten to grind the housing market into a slowdown. The notable slowing in existing home sales could be the first sign of a reluctant march toward balance. For now, home builders continue to adjust relatively well to the changing economics of the housing market. With the seasonally strong period for home builder stocks still two months away, I am bracing for a fresh round of weakness as investors get increasingly nervous about the warnings in the housing data.
Be careful out there!
Full disclosure: long ITB calls