
AT40 = 58.4% of stocks are trading above their respective 40-day moving averages (DMAs)
AT200 = 56.3% of stocks are trading above their respective 200DMAs
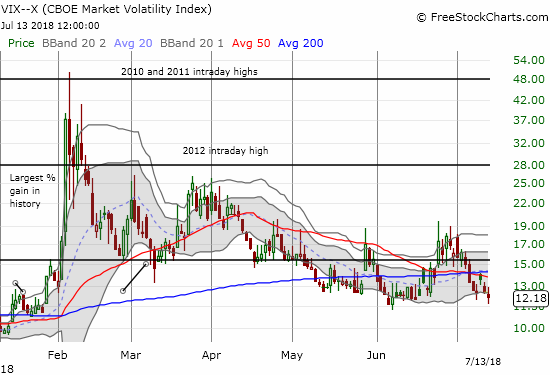
VIX = 12.2
Short-term Trading Call: neutral
Commentary
On Tuesday, July 10th, AT40 (T2108), the percentage of stocks trading above their respective 40-day moving averages (DMAs), rose as high as 68.8% – just over a point away from the 70% overbought threshold. AT40 closed that day at 65.5%. That small fade was good enough to flash bearish signs, so I immediately scaled into call options on ProShares Ultra VIX Short-Term Futures (UVXY) and S&P 500 (SPY) put options. The next day, AT40 dropped sharply to a 57.5% close as the S&P 500 (SPY) sold off slightly by 0.7%. It was a surprisingly shallow decline given the drop in AT40. Taking my cue from earlier brief dips, I took my profits in both the SPY puts and UVXY calls. Sure enough, sellers gave way to buyers the very next day. The S&P 500 continued its rally by ending the week closing above the 2800 mark for the first time since the February swoon began.
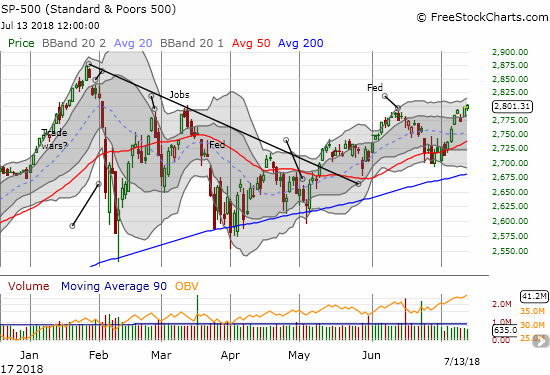
The index’s rally left AT40 behind. My favorite technical indicator went almost nowhere and closed the week at 58.4%. This mild bearish divergence helps maintain my skepticism over the market rally.
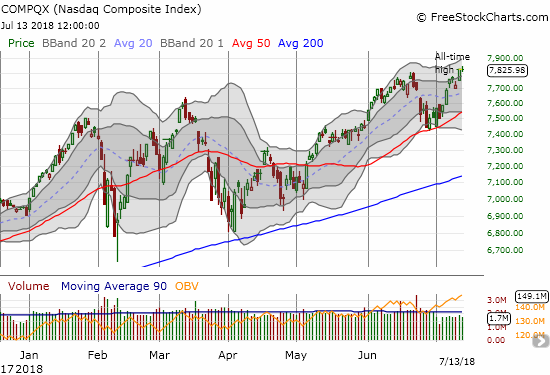
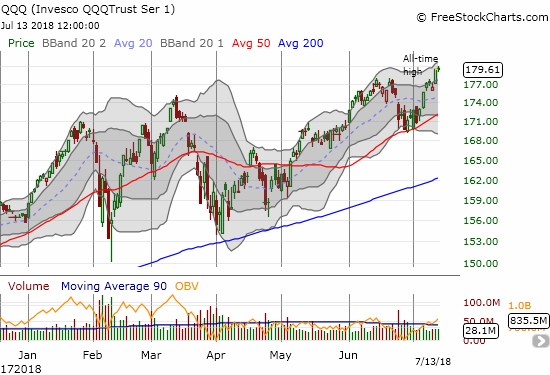
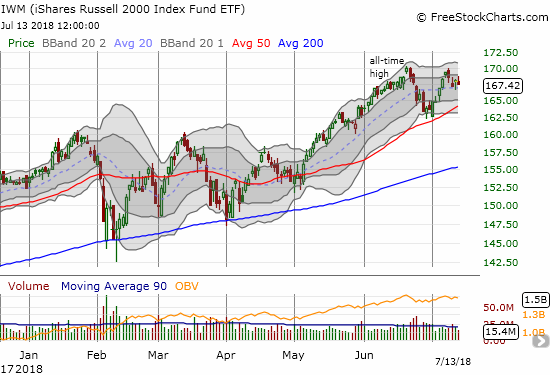
The NASDAQ and Invesco QQQ Trust (QQQ) closed the week at fresh all-time highs. Unlike previous tech-laden rallies, the iShares Russell 2000 ETF (IWM) lagged behind. In fact, not only did IWM fail to make a new all-time high, the index of small caps essentially confirmed the week’s failed attempt to challenge the all-time high set in June.
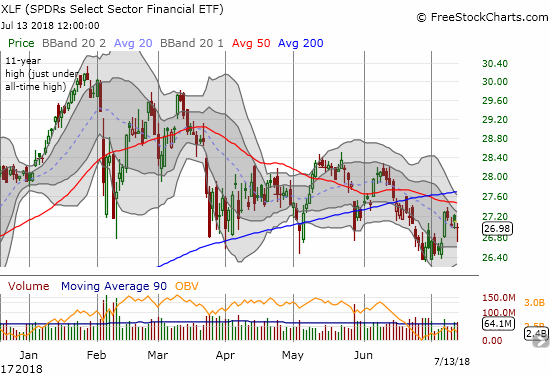
Financials continue to underperform. After starting the week with a strong rally, the Financial Select Sector SPDR ETF (XLF) quickly fell behind the market again. At one point on Friday, XLF completed a full reversal of Monday’s gains in the wake of poor responses to earnings from the likes of Citigroup (C), JPMorgan Chase (JPM), and Wells Fargo (WFC).
The volatility index, the VIX, fell right back to the 12 level. Market protection through put options are cheap again (meaning undervalued). I expect the VIX to cycle higher at least once from current levels between now and the end of the summer trading season. A drop into extremely low volatility levels (below 11) will change my forecast.
My skepticism aside, I am impressed with the market’s resilience in the face of a worsening trade war and worsening relations between the Trump administration and the U.S.’s traditional allies. I can only imagine how much higher the market could presumably go without these headwinds. The current earnings season should be telling. If company executives act like the stock market and decide on balance to largely ignore and downplay potential impacts from the escalating trade war, traders and investors will likely get further emboldened to take the market higher. If the earnings reports are full of tempered expectations in order to avoid the risks of nasty downward adjustments of guidance later in the year, then the bearish signal from AT40 will receive important follow-through. I fully expect the downside case.
I am maintaining a neutral short-term trading call because the major indices bounced back so quickly from AT40’s failure. A swing into and out of overbought conditions will still get an automatic bearish trading call.
CHART REVIEWS
Earnings season is underway. For the next few weeks, the most interesting charts will come post earnings reports. I have two of particular interest for this post.
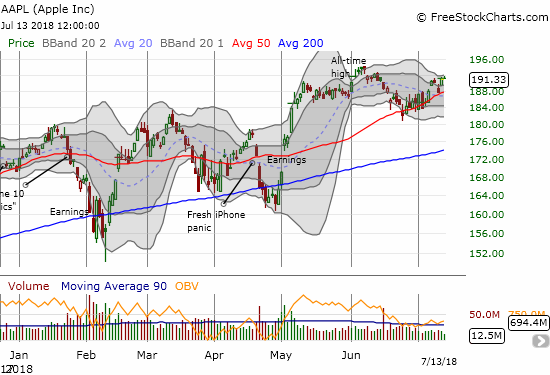
Apple (AAPL)
In my last Above the 40 post, I said the following about AAPL: “I will not be surprised if AAPL falls right back to 50DMA support at some point this week. Note that I failed to get a fill for my weekly call option trade, so I will likely be a buyer on the next AAPL dip.” The market delivered. I loaded up on calls when AAPL retested 50DMA support. I was rewarded the very next day with a large gap up and a new high for the week. I took profits. On Friday, I bought calls for the coming week. Still, AAPL is slightly lagging the tech indices. Will it be a drag or can it play a little catch-up ahead of earnings?
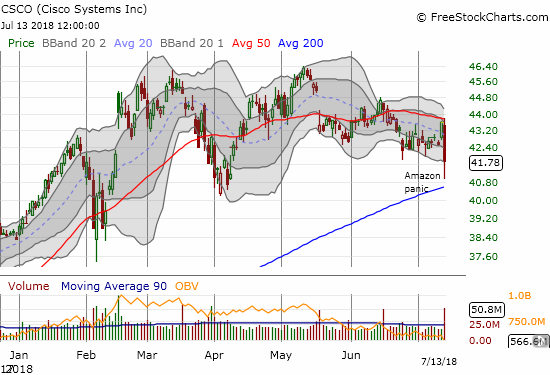
Cisco (CSCO)
Just call it the Amazon.com (AMZN) Panic Trade. CSCO is the latest victim as rumors spread that AMZN might make a move into networking gear. While such a move seems like a great complement to AMZN’s web services, I am highly skeptical CSCO needs to worry much for quite some time. I loaded up on call options as CSCO bounced away from 200DMA support. I did not make moves on fellow competitors Juniper Networks (JNPR), down 2.3%, or Arista Networks (ANET), down 4.3%.
— – —
FOLLOW Dr. Duru’s commentary on financial markets via email, StockTwits, Twitter, and even Instagram!
“Above the 40” uses the percentage of stocks trading above their respective 40-day moving averages (DMAs) to assess the technical health of the stock market and to identify extremes in market sentiment that are likely to reverse. Abbreviated as AT40, Above the 40 is an alternative label for “T2108” which was created by Worden. Learn more about T2108 on my T2108 Resource Page. AT200, or T2107, measures the percentage of stocks trading above their respective 200DMAs.
Active AT40 (T2108) periods: Day #100 over 20%, Day #69 over 30%, Day #64 over 40%, Day #7 over 50% (overperiod), Day #3 under 60% (underperiod), Day #20 under 70%
Daily AT40 (T2108)
")
Black line: AT40 (T2108) (% measured on the right)
Red line: Overbought threshold (70%); Blue line: Oversold threshold (20%)
Weekly AT40 (T2108)

*All charts created using freestockcharts.com unless otherwise stated
The charts above are my LATEST updates independent of the date of this given AT40 post. For my latest AT40 post click here.
Related links:
The AT40 (T2108) Resource Page
You can follow real-time T2108 commentary on twitter using the #T2108 or #AT40 hashtags. T2108-related trades and other trades are occasionally posted on twitter using the #120trade hashtag.
Be careful out there!
Full disclosure: long UVXY calls, long AAPL calls, long CSCO calls
*Charting notes: FreeStockCharts.com stock prices are not adjusted for dividends. TradingView.com charts for currencies use Tokyo time as the start of the forex trading day. FreeStockCharts.com currency charts are based on Eastern U.S. time to define the trading day.