
AT40 = 63.6% of stocks are trading above their respective 40-day moving averages (DMAs)
AT200 = 60.3% of stocks are trading above their respective 200DMAs
VIX = 9.6 (volatility index)
Short-term Trading Call: cautiously bullish
Commentary
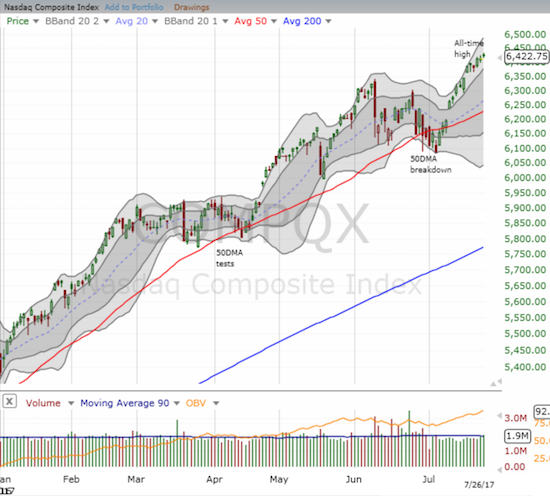
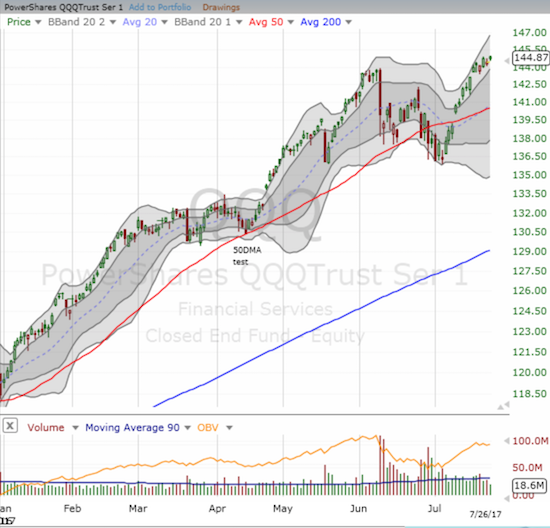
The stock market had a relatively bland day that matched a relatively bland statement on monetary policy from the Federal Reserve. The S&P 500 (SPY), the NASDAQ, and the PowerShares QQQ ETF (QQQ) all made VERY marginal new all-time highs. AT40 (T2108), the percentage of stocks trading above their relative 40-day moving averages (DMAs), even closed right where I left it last Friday in my last Above the 40 post. AT200 (T2107), the percentage of stocks trading above their respective 200DMAs, also closed where it ended last week. The volatility index, the VIX, closed just 0.2 above its Friday close.
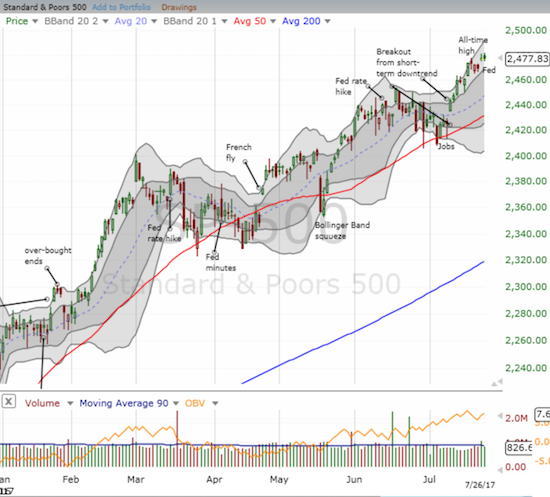
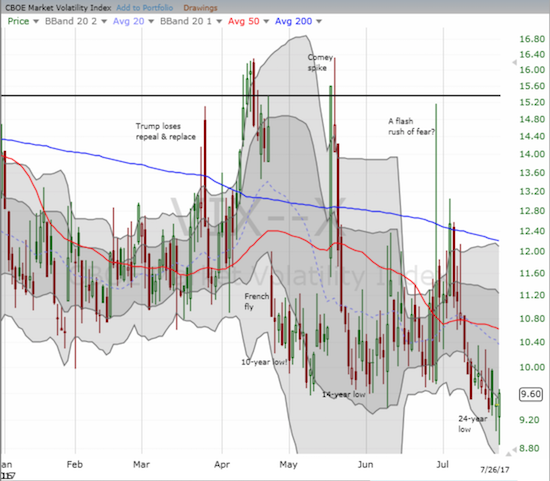
While the closes were unremarkable, the paths to these closes DO interest me. The major indices are still on general uptrends defined by their upper-Bollinger Bands (BBs). The S&P 500 is threatening to break through the ceiling I expected for the next few months. Over the last three trading days, the VIX closed at levels lower than only one other trading day since 1990. Today’s intraday low set a new record for this time period. Yet, as all looks calm and peaceful, AT40 struggled again to break into overbought territory: it faded from the edge of 70%. Yesterday, AT40 faded from a high of 68.7% to close at 66.8% and continued the fade today with a close at 63.6%. So the caution that I expressed earlier remains.
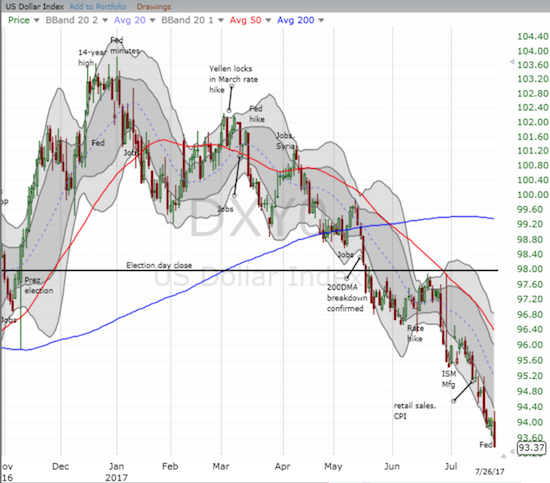
The U.S. dollar index (DXY0) betrayed the calm of the day by losing another 0.8% and closing at its lowest level since early May, 2016. I guess the Fed did not give traders any reason to stop selling the dollar as they have done relatively consistently for most of 2017. It is possible to torture the Fed’s statement and tease out a driver like an implicitly more dovish inflation outlook. However, since the Fed said it “expects to begin implementing its balance sheet normalization program relatively soon, provided that the economy evolves broadly as anticipated,” I think the teases are a wash. Regardless of the headlines of the moment, the main story remains the dollar’s descent for most of 2017.
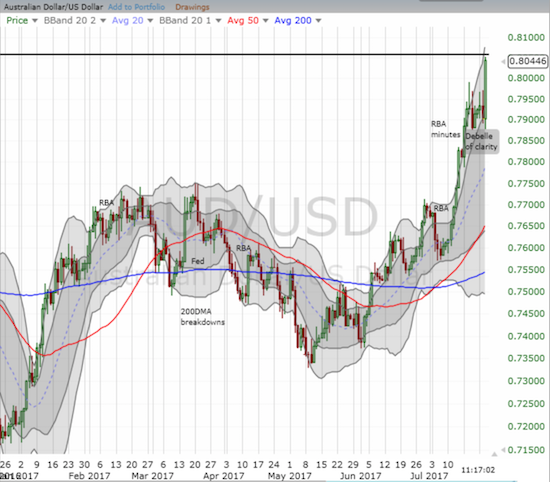
One important consequence of the dollar’s fresh weakness is the renewed strength in the commodity complex which in turn breathed fresh life into the Australian dollar (FXA). At the time of typing, AUD/USD got an additional boost during Asian trading and zipped past the 0.80 mark. I am fading anew per my assessment that the Reserve Bank of Australia has absolutely no interest in doing anything, like a rate hike, that would further strengthen the currency. (As a reminder, I am no longer bearish the Australian dollar, but I am still being opportunistic with shorts if the setup arises).
Chipotle Mexican Grill (CMG)
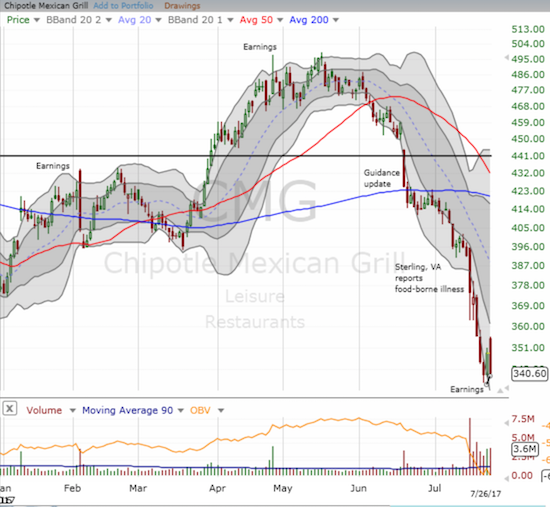
The earnings trade on CMG did not play out as I had hoped. I was looking for a big (upside) move. Instead CMG opened weakly and closed right at its recent low. The move was perfect for imploding the value of call and put options.
The previous day, I positioned for earnings when my conditional order to buy a $370 strike call option triggered once CMG surpassed its Monday high. While the upward momentum was enough to generate a small gain, I decided to hold and sell an out-of-the-money $390 strike call option against my profitable call and then use that premium to buy an out-of-the-money $315 strike put option. While the weak post-earnings open told me CMG was likely in trouble, I decided to sit on my hands and wait out the day. In after hours, CMG fell another 1.8% or so on news of a subpoena connected with the Sterling, VA incident. I think this is a short-term buyable dip given this subpoena looks like standard practice, but I will wait to see buyers show up. From the related 10Q filing:
“On January 28, 2016, we were served with a Federal Grand Jury Subpoena from the U.S. District Court for the Central District of California in connection with an official criminal investigation being conducted by the U.S. Attorney’s Office for the Central District of California, in conjunction with the U.S. Food and Drug Administration’s Office of Criminal Investigations. The subpoena requires the production of documents and information related to company-wide food safety matters dating back to January 1, 2013. We received a follow-up subpoena on July 19, 2017 requesting information related to illness incidents associated with a single Chipotle restaurant in Sterling, Virginia. We intend to continue to fully cooperate in the investigation. It is not possible at this time to determine whether we will incur, or to reasonably estimate the amount of, any fines or penalties in connection with the investigation pursuant to which the subpoena was issued.”
Ulta Beauty (ULTA)
My latest trade in ULTA offset the losses on CMG.
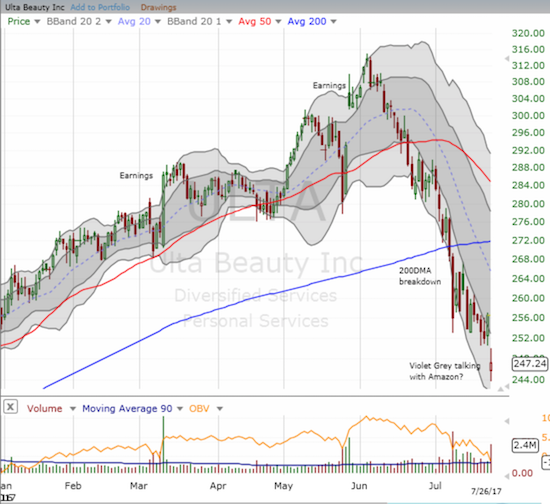
In my last Above the 40 post, I noted the bearish implications of ULTA’s post-earnings downtrend and even hazarded a guess that investors were trying to ease out of the stock ahead of the Amazon Panic contagion. Sure enough, today came news that competitor Violet Grey may be in talks with Amazon.com (AMZN). Frankly, given the stock’s breathtaking rise, I assumed that ULTA has no serious competitors. If this news is credible, then there is yet one more reason for investors to stop paying up for this momentum stock. I sold my put options into the dip (I had to wait out an initial obligatory bounce from the gap buyers), and I will let my single call option hedge sit.
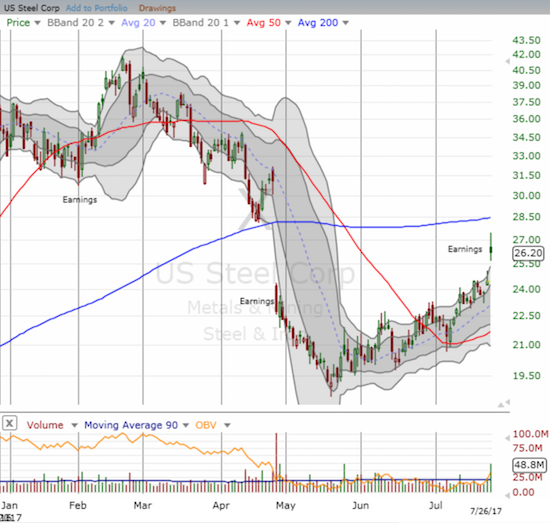
U.S. Steel (X)
In early June, I wrote about the case for speculating in U.S. Steel (X) after the stock was finally showing signs of life in the wake of April’s massive post-earnings sell-off. I did not initiate a new trade in X ahead of its earnings. I wish I did! X is now up 19.9% since my post.
In other trades: Caterpillar (CAT) soared ever closer to a new all-time high after earnings on Tuesday. Deere (DE) jumped in sympathy, and I took profits.
— – —
FOLLOW Dr. Duru’s commentary on financial markets via email, StockTwits, Twitter, and even Instagram!
“Above the 40” uses the percentage of stocks trading above their respective 40-day moving averages (DMAs) to assess the technical health of the stock market and to identify extremes in market sentiment that are likely to reverse. Abbreviated as AT40, Above the 40 is an alternative label for “T2108” which was created by Worden. Learn more about T2108 on my T2108 Resource Page. AT200, or T2107, measures the percentage of stocks trading above their respective 200DMAs.
Active AT40 (T2108) periods: Day #362 over 20%, Day #176 over 30%, Day #43 over 40%, Day #14 over 50%, Day #9 over 60% (overperiod), Day #122 under 70%
Daily AT40 (T2108)
")
Black line: AT40 (T2108) (% measured on the right)
Red line: Overbought threshold (70%); Blue line: Oversold threshold (20%)
Weekly AT40 (T2108)

*All charts created using freestockcharts.com unless otherwise stated
The charts above are my LATEST updates independent of the date of this given AT40 post. For my latest AT40 post click here.
Related links:
The T2108 Resource Page
You can follow real-time T2108 commentary on twitter using the #T2108 or #AT40 hashtags. T2108-related trades and other trades are occasionally posted on twitter using the #120trade hashtag.
Be careful out there!
Full disclosure: long SHLD call options
*Charting notes: FreeStockCharts.com uses midnight U.S. Eastern time as the close for currencies.
After yesterday’s move I waited to now to short NZD.USD. I think AU is a short here too with the weak inflation numbers last week. NZD I like more because the long spec positioning must be even more massive than last week and with the general election in 2 months that positioning may well get crushed. I like the odds. Not as good a lay up as long CAD last month but pretty good.
The short Aussie worked like a charm. It looks like now the Aussie will generally be strong when the USD is weak and vice versa…
Yes went off surprisingly well and I am flat again.
Looks like CHF is in play again. Any thoughts DD ?
I think the current consensus is that ecb will move and Snb will stay at -75bps. Hence the big move in eur.chf this week. But how realistic is that ?? The snb should move before the ecb. Instead they seem to react. When the ecb moves, they have to get out of the way. What does that mean for eur.chf and usd.chf ? I have to say I have not traded chf for a while because of the lack of volatility so I probably need to do some research.
I am in the exact same boat as you with CHF. I was JUST reading about what’s going on yesterday. It seems the market is finally acting on the SNB’s claim that the franc is severely over-valued. Preparations for a tightening ECB is the driver getting traders to act. I do not want to chase this first move though. I will look for better entry points and probably use a different pair as the euro could be getting a little stretched finally. Note the franc is weak against all major currencies, not just EUR.
I am thinking usd.chf could be a punt. The eur.chf move is based on snb leaving rates at -75bps and ecb tightening bias. But the snb can’t stay pat. They will get rid of their euro excess reserves and eur.chf will move back. The floor was artificially high so I would not be surprised for it not to get back there.
However, if the snb were to move to say -50bps or the market anticipated this, what would be the effect on usd.chf ? One would presume chf would strengthen on the rate differentials but I am not sure about the flow effects.
As soon as the market anticipates the SNB will move , the Franc will strengthen. Just the nature of the market to try to get ahead of everything.
Until then, the franc SHOULD tend to weaken along with expectations of ECB tightening.
Very clear thinking DD. The key will be anticipating where SNB eur reserves are up to. Hence the current CHF weakness could have a way to go unless the SNB acts earlier to hint at weakening. But in fact it is in their interests to do the opposite and hint at resolution in keeping at -75bps To maximize the chance they can offload the eur reserves they have accumulated in the last 2 years hopefully at a profit.
The Difference with 2 years ago is that with no floor, all they need to do is sell eur until they run out and will not be in the position of being forced to move before the ECB. They might even want to accumulate a significant long CHF position for further intervention.
I doubt the macro fundamentals in Switzerland warrant -75bps, particularly with depreciation in CHF. It is probably a more compelling case than the ECB or BOJ moving earlier to hike. But then the snb perceives CHF as already so overvalued, and according to PPP it is, one wonders where it will go when they normalise rates to even 0.
And all of this means that the franc could very soon be one of the more interesting currecies to track and trade again. It’s on my radar!
Another one on the radar is the long interest accumulating in AUD, NZD, MXN. The latter 2 getting quite large. NZD will move to a hiking bias but they have a general election soon. MXN unlikely to hike so that actually might be a good expression of a long dollar view, whenever the dollar bottoms out.
Do you have any thoughts about MXN currently ?
I finally took a look at NZD. Wowza! That’s huge interest accumulating.
I am still bullish MXN for all my previously stated reasons. Perhaps I should be concerned with the spec, but USD/MXN is still well above previous lows. Until my current trading method fails me, I will stick with it: fading rallies and taking profits on the resumption of the downtrend.