
AT40 = 64.0% of stocks are trading above their respective 40-day moving averages (DMAs)
AT200 = 60.4% of stocks are trading above their respective 200DMAs
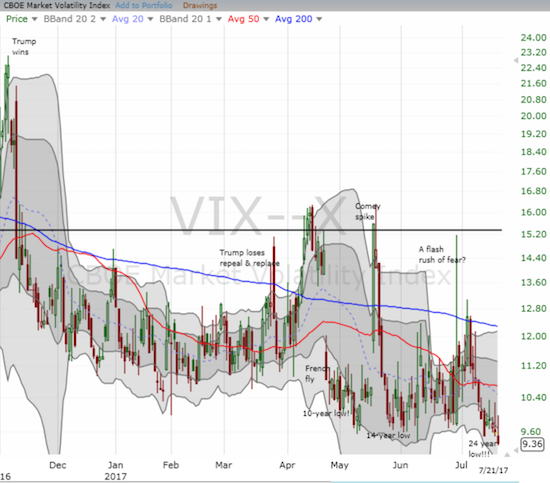
VIX = 9.4 (volatility index) (2nd lowest VIX since at least 1990!)
Short-term Trading Call: cautiously bullish
Commentary
The S&P 500 (SPY) is soaring high since its impressive breakout two weeks ago.
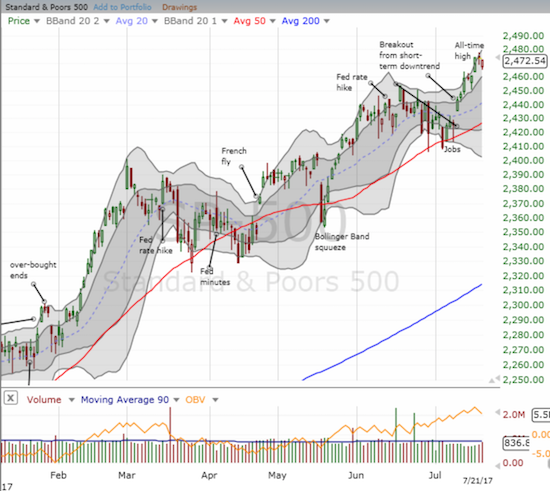
The NASDAQ and PowerShares QQQ ETF (QQQ) have charts very similar to the S&P 500. Unfortunately, the stall of the last two trading days happened to occur right at the edge of the overbought threshold. AT40 (T2108), the percentage of stocks trading above their respective 40-day moving averages (DMAs), closed at 68.2% on Wednesday, June 19th. AT40 got as high as 68.9% the next day. On Friday, AT40 closed at 64.0%. This fade from the 70% overbought threshold counts as a bearish signal.
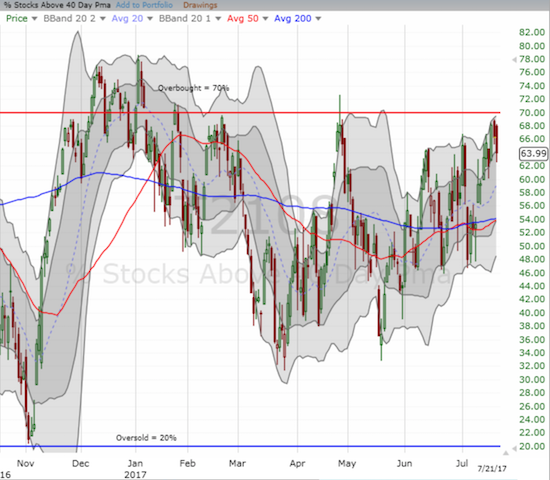
For some context, AT40 last faded from overbought on April 26th. In three weeks, my favorite technical indicator plunged as low as 32.8%. The good news: the S&P 500 stayed remarkably resilient over this period. The index actually drifted slightly HIGHER over this time until, all at once, the pent-up selling pressure unleashed in one day. On May 17th, the S&P 500 knifed through 50DMA support in a move that forced me to downgrade my short-term trading call to neutral (but I was NOT bearish). The plunge turned out to be a speed bump on the road of resilience. The S&P 500 turned right around from there and rallied nearly straight up until time approached for the next Fed meeting.
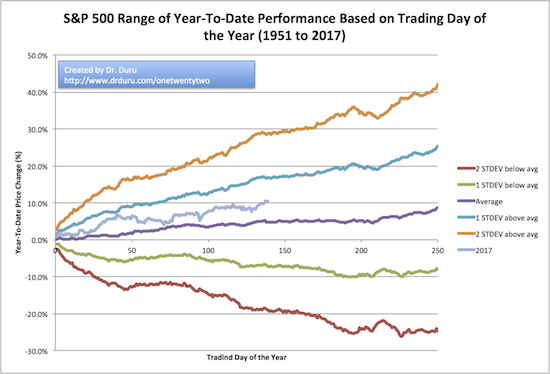
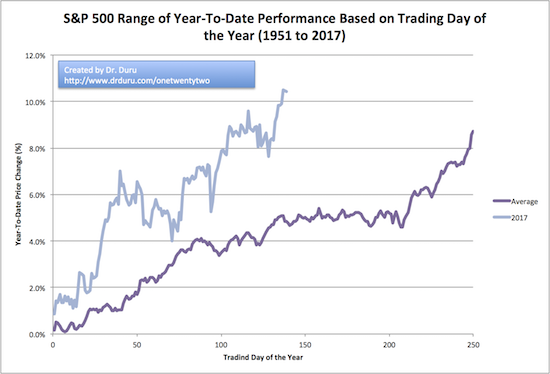
Every AT40 bearish divergence seems to unfold slightly differently – with some divergences skirting the edge of bearishness – but the prospect of some kind of selling event for this divergence seems quite palpable. For example, inspired by a StockTwits poster, I created these relative performance charts of the S&P 500 that includes bands for one and two standard deviations.
Source for Data: Yahoo Finance
I was greatly intrigued to see that the S&P 500’s average year-to-date (YTD) performance since 1951 completely flattens out from around now until the 210th trading day (which is right around late October or early November). After that, the S&P 500’s YTD performance soars. However, on average, the S&P 500 soars to an annual performance right around the S&P 500’s current performance just seven months into the year. So, if we think averages, we cannot expect much better from the S&P 500 for the rest of the year. If we think seasonality, the S&P 500 should stall out for the next 3 or so months. If we think a range of “reasonable” outcomes, the S&P 500 is not doing anything unusual at all. Performance within plus or minus one standard deviation covers about 68% of all outcomes. Performance within plus or minus two standard deviations covers about 95% of all outcomes. Note well that these are approximations since the S&P 500’s performance is NOT normally distributed and as a skew to to the downside. See Math Is Fun and scroll down to “standard deviation” for a simplified explanation of this concept. Click here to download the spreadsheet I used for these charts.
So, while my short-term trading call remains cautiously bullish, I am uninterested in taking on new bullish positions for more than swing trades or special cases (like SHLD below). If AT40 manages to close above the overbought threshold, I will likely change my tune and turn my gaze to outer bands of YTD performance. First things first though: let’s see what happens after the policy announcement from the U.S. Federal Reserve this Wednesday, July 26th.
While I await resolution of this latest technical drama in the stock market, there is plenty of action in individual stocks for earnings-based swing trades. Amazon Panic also continues to generate tradable cascades.
Chipotle Mexican Grill (CMG)
I last mentioned CMG in the wake of the company’s latest food-borne illness scare. I was fortunate to go into that selling holding onto a put option, but I did not capitalize on the full extent of the large gain in that put. I then flipped around and went bullish to bet on a bottoming process. While I was able to snatch profits on the related call options, overall, I would have been better served staying bearish for the rest of the week.
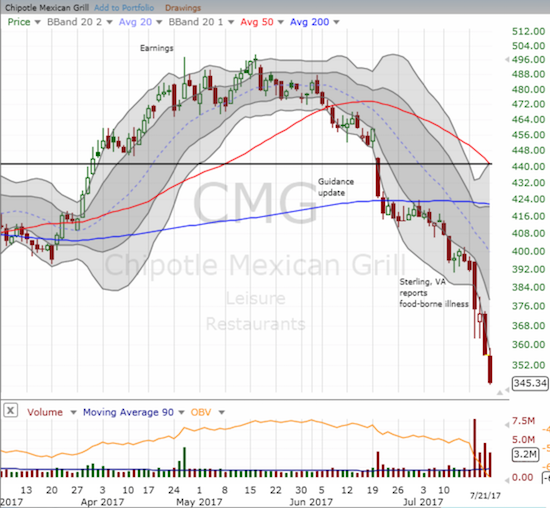
There are several features of interest in this chart. First, CMG held the intraday low as support on the trading day following the breakdown. It was a setup very similar to what happened December 6th and 7th at the EXACT same price point after CMG posted disappointing guidance for 2017. This time around a bottom was not to be: CMG sliced through that low on Thursday and the selling barely abated on Friday. In the middle of trying to play bottoms I alleviated the pain with some puts but the frenetic trading was a waste of time and energy given staying short made the most sense once the presumed double-bottom failed.
Jim Cramer was another disappointment. Cramer was a fan of CMG and promoted the idea that 18 months after a calamity from a food-borne illness, restaurants recover and consumers fully forget. With the 18-month clock ending, Cramer opined on Monday, ahead of Tuesday’s sell-off, that he would start loading up on CMG under $400 if he could get the price. Instead, when he next mentioned CMG he reset the 18-month clock. While I understand the reset, I was surprised given norovirus can hit anywhere, and this outbreak does not appear to reflect poorly on CMG’s food chain.
In the middle of all this, the company has stayed silent with no related press releases. I imagine with an earnings call coming up, management has little choice given the quiet period. The main potential upside here is that a good deal of motivated sellers SHOULD finally be out the stock ahead of earnings. If CMG can somehow manage to avoid reporting any worse news, the stock could pop. I am looking to bet that way for one more speculative bet. I am glad at least Guy Adami from CNBC’s Fast Money agrees with me…
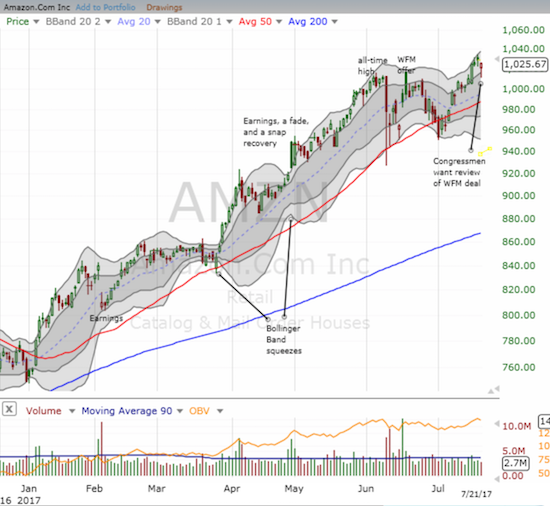
The Amazon Panic
In this post, I am creating a special section for the on-going “Amazon Panic” that continues to cascade through the stock market. The Amazon Panic has put traders and investors on edge. Jim Cramer even capitulated last week on retail for fear of waking up one morning to find his stock down 10% from AZN panic.
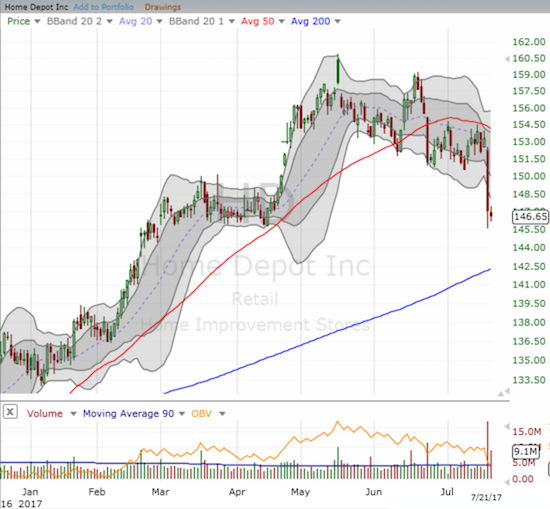
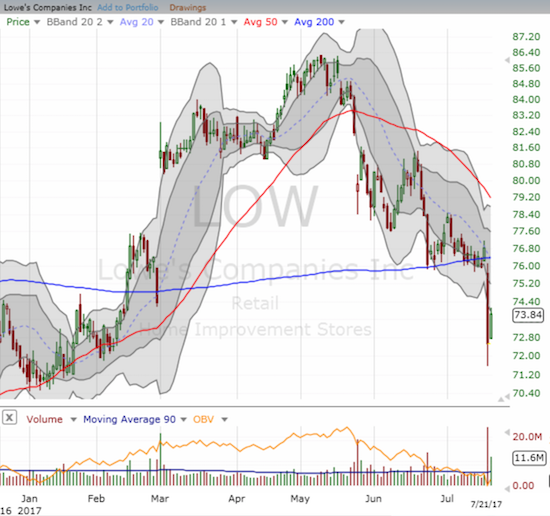
This time, the big headline was Sears Holding Corporation (SHLD) which made a deal with Amazon.com (AMZN) to sell Kenmore appliances online. This deal amounts to opening up another distribution channel for Sears. SHLD initially gapped higher but by the next day SHLD lost all its gains. I decided to accumulate call options into this selling. While the market swung wildly from acting as if this deal would save SHLD to acting like it was a non-event for SHLD, losses were sustained at a host of appliance sellers: for example, Best Buy (BBY), Lowe’s (LOW), and Home Depot (HD). The technical damage was significant in all three stocks.
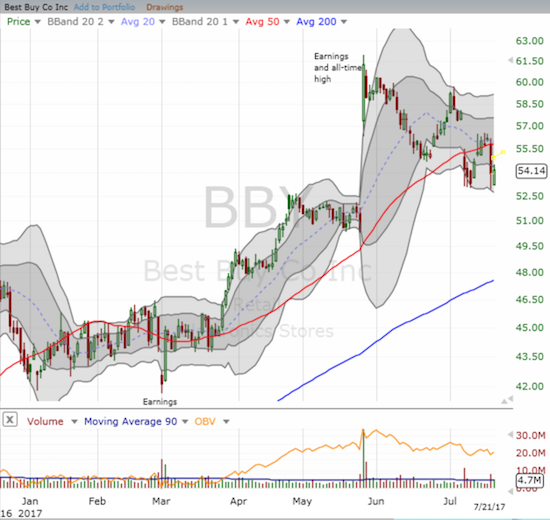
When Amazon Panic first pummeled BBY, I laid out a simple trading strategy. I decided to take a hedged approach and ended the week even thanks to profits on my short shares. With BBY below its 50DMA again, I am inclined to go short and stay short with a stop above the last intraday high around $56.50.
I would normally look to buy HD and/or LOW on this trigger-finger dip, but the technicals on both stocks are compromised. Both stocks have confirmed bearish breakdowns. They are guilty of bearishness until proven innocent.
Meanwhile AMZN barely registered a blip on the SHLD deal. Bigger news came the next day when some Congressmen urged a review of AMZN’s deal for Whole Foods Market (WFM)…and AMZN almost recovered completely from that dip.
Ulta Beauty (ULTA)
ULTA has yet to get hit by Amazon Panic, but the chart certainly makes me think that previously comfortable investors are trying to ease their way out the stock ahead of any such surprises.
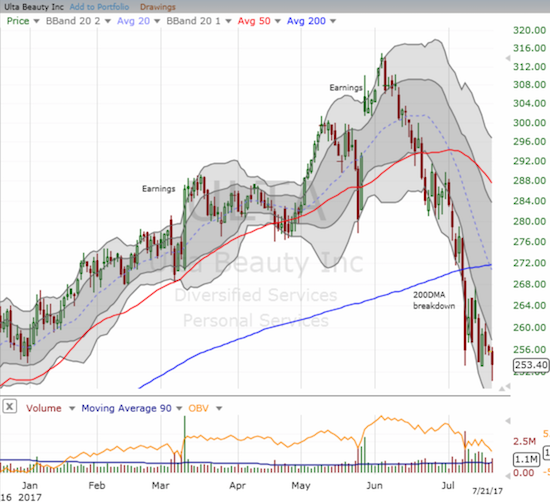
When I discussed the trade in ULTA, I noted switching from an outright bearish position to a hedged one. The selling on Friday got me out that trade even and confirmed for me I am better off just betting on further downside for now. Note well how buyers took ULTA off its low but stopped right under the low of the week. ULTA sits at a 7-month low.
The volatility index (VIX)
I saved the best for last: he volatility index is now at its second lowest level since at least 1990. Yahoo Finance provides data back to 1990. All I have to say is….wow. And, yes, extremely low volatility is generally a bullish sign.
— – —
FOLLOW Dr. Duru’s commentary on financial markets via email, StockTwits, Twitter, and even Instagram!
“Above the 40” uses the percentage of stocks trading above their respective 40-day moving averages (DMAs) to assess the technical health of the stock market and to identify extremes in market sentiment that are likely to reverse. Abbreviated as AT40, Above the 40 is an alternative label for “T2108” which was created by Worden. Learn more about T2108 on my T2108 Resource Page. AT200, or T2107, measures the percentage of stocks trading above their respective 200DMAs.
Active AT40 (T2108) periods: Day #359 over 20%, Day #173 over 30%, Day #40 over 40%, Day #11 over 50%, Day #6 over 60% (overperiod), Day #119 under 70%
Daily AT40 (T2108)
")
Black line: AT40 (T2108) (% measured on the right)
Red line: Overbought threshold (70%); Blue line: Oversold threshold (20%)
Weekly AT40 (T2108)

*All charts created using freestockcharts.com unless otherwise stated
The charts above are my LATEST updates independent of the date of this given AT40 post. For my latest AT40 post click here.
Related links:
The T2108 Resource Page
You can follow real-time T2108 commentary on twitter using the #T2108 or #AT40 hashtags. T2108-related trades and other trades are occasionally posted on twitter using the #120trade hashtag.
Be careful out there!
Full disclosure: long SHLD call options
*Charting notes: FreeStockCharts.com uses midnight U.S. Eastern time as the close for currencies.