
AT40 = 52.7% of stocks are trading above their respective 40-day moving averages (DMAs)
AT200 = 55.6% of stocks are trading above their respective 200DMAs
VIX = 11.1 (flat) (volatility index)
Short-term Trading Call: neutral
Commentary
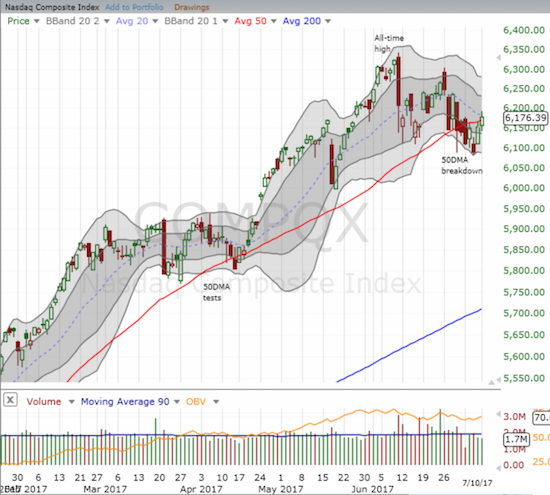
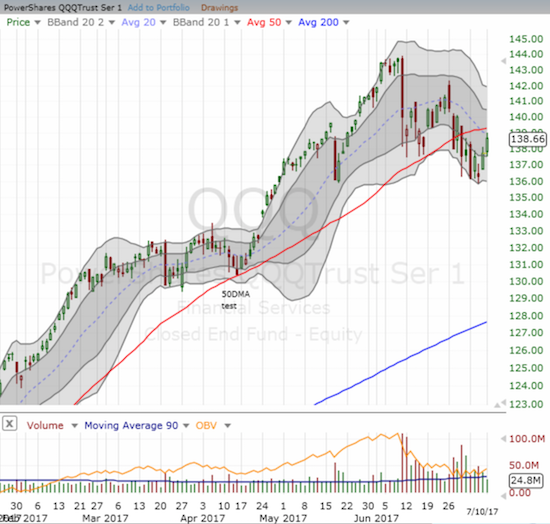
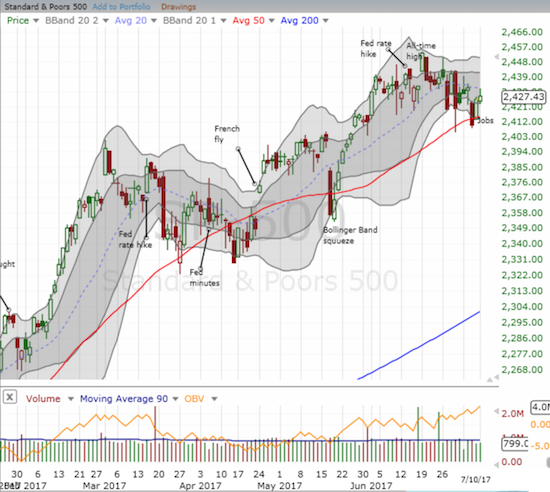
Tech was back today sucking energy out of other parts of the stock market. The NASDAQ increased 0.4%, and the PowerShares QQQ ETF (QQQ) increased 0.7%. The S&P 500 (SPY) barely eked out a gain at 0.1%. Yet, AT40 (T2108), the percentage of stocks trading above their respective 40-day moving averages (DMAs), declined slightly by 2 percentage points to 52.7%.
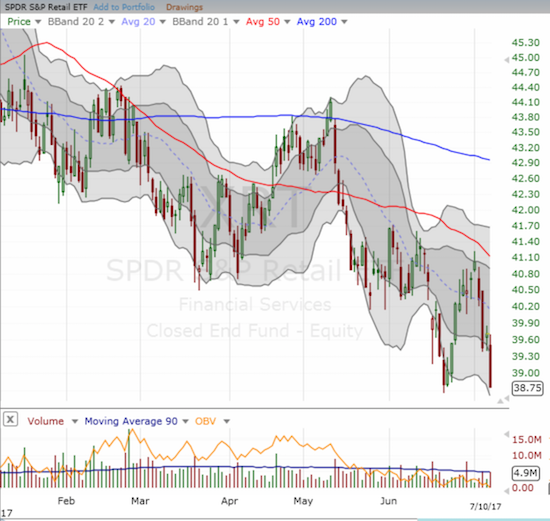
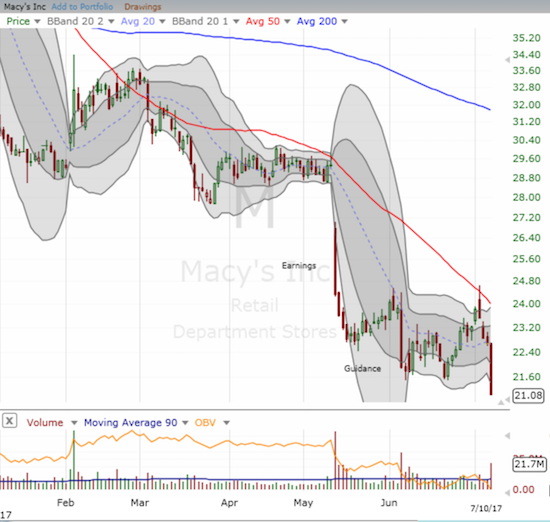
The apt representation of the sucking sound was Amazon.com (AMZN) which was on the eve of raking in big dollars from its much anticipated Amazon Prime Day. AMZN popped 1.8% in a move that confirmed a 50DMA breakout and reconfirmed the 50DMA as uptrending support. On the other side of the ledger was the SPDR S&P Retail ETF (XRT) and its 2.4% loss to a (marginal) new 17-month low. Macy’s (M) was just minding its business and lost 7.1% to a near 7-year low on heavy trading volume just for being one of the many hapless retailers looking like sitting ducks on Prime Day eve (ok, MAYBE it had something to do with sympathy for Abercrombie & Fitch’s (ANF) 21% loss after announcing there is no buy-out on the horizon).
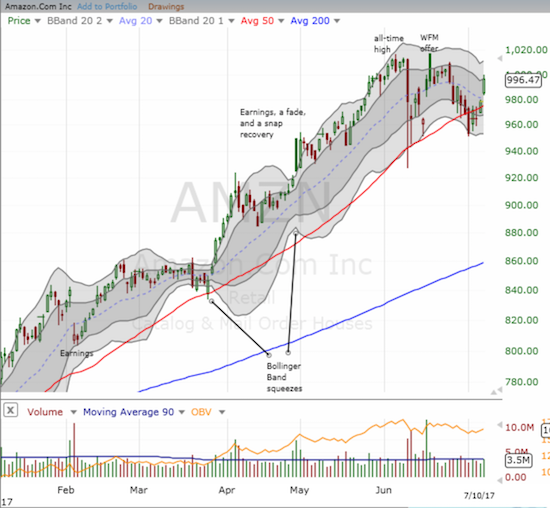
With AMZN gapping up at the open, I traded on near automatic and bought a call option with a $1000 strike. I set a sell limit for a 40%+ gain and was first pleasantly surprised that the trade triggered within two hours and was second a bit disappointed I did not reach for more as the call option ended the day with a 130% gain. I will be looking for any signs of a “sell the news” reaction after Prime Day ends. (In related trades, later in the day, I locked in profits on my latest tranche of QQQ call options. Anticipating the yo-yo to go back down, I doubled down on my Apple (AAPL) puts but did not add to the Netflix (NFLX) put options).
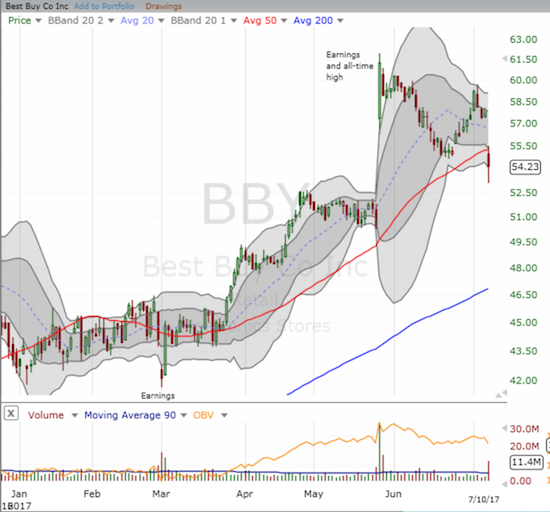
Just for emphasis, Best Buy (BBY) got pummeled on the heels of more Amazon panic. News headlines spread quickly about Amazon Smart Home Services which reportedly rivals Best Buy’s Geek Squad. On this news alone, BBY lost 6.3% and broke down below its 50DMA support. BBY lost $1B in market cap for a threat to a business that was at most $1.8B in revenue in fiscal 2017 or 5% of the total (according to BBY’s annual report). While the sell-off seems overdone given the Geek Squad’s revenue size, it is certainly possible that the run-up to an all-time high in late May was the move that was overdone. For example, BBY’s revenue has flatlined the past three fiscal years: 0.6% annual growth for fiscal 2015, 0.9% for 2016, and -0.3%for 2017. For FY 2018, BBY guided to 1.0% enterprise revenue growth on a 52-week basis. With these kinds of numbers any revenue loss with a billion on the end can be precious.
Regardless, my technical trade here is pretty straightforward: 1) go short on the breakdown and hold, 2) stop out shorts and/or go long on a confirmed fresh breakout above the 50DMA and hang around for a gap fill.
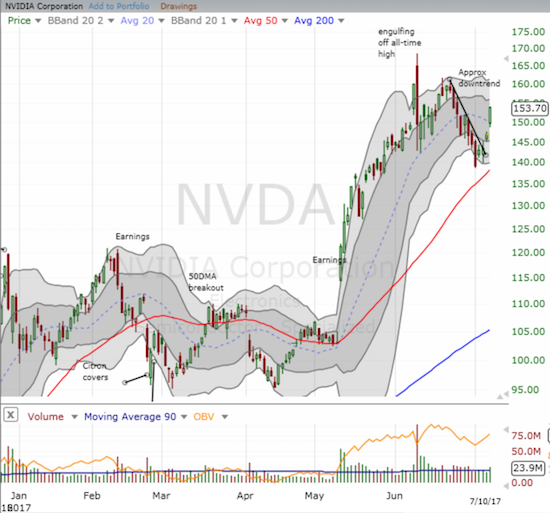
AMZN was not the only one of the usual suspects to enjoy a breakout. Nvidia (NVDA) confirmed its breakout from a short-term downtrend with a 4.7% gain. NVDA joined AMZN and Facebook (FB) as part of the usual suspects that are back in bullish mode.
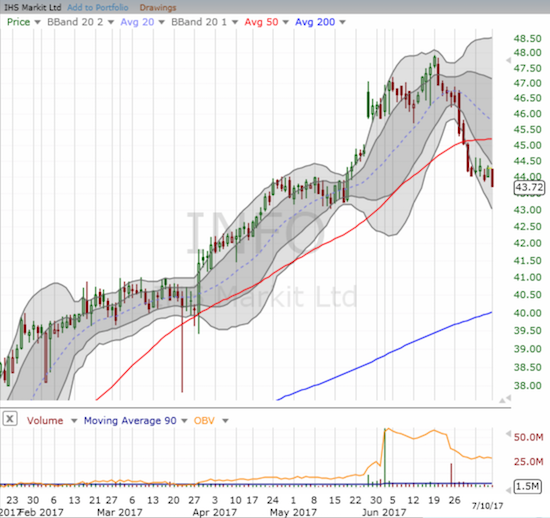
Finally, a LONG overdue trading update on IHS Markit Ltd. (INFO). In late May, INFO jumped nicely on news it would join the S&P 500. At the time, I was hopeful that the index could help INFO retain its gains. Such was not the case. While the index is marginally higher since then, INFO has given up all its gains and then some. I am definitely disappointed, but I fully recognize that these kinds of gains are hard to sustain. Still, this is just one of those stocks that has earned my stubbornness. I am holding for the 200DMA uptrend and am prepared to buy near that level as a gift from the market. I would have bailed on INFO on the 50DMA breakdown if I had bought it for a short-term trade. My position is back to flat-line.
Be careful out there!
— – —
FOLLOW Dr. Duru’s commentary on financial markets via email, StockTwits, Twitter, and even Instagram!
“Above the 40” uses the percentage of stocks trading above their respective 40-day moving averages (DMAs) to assess the technical health of the stock market and to identify extremes in market sentiment that are likely to reverse. Abbreviated as AT40, Above the 40 is an alternative label for “T2108” which was created by Worden. Learn more about T2108 on my T2108 Resource Page. AT200, or T2107, measures the percentage of stocks trading above their respective 200DMAs.
Active AT40 (T2108) periods: Day #350 over 20%, Day #164 over 30%, Day #31 over 40%, Day #2 over 50% (overperiod), Day #4 under 60% (underperiod), Day #110 under 70%
Daily AT40 (T2108)
")
Black line: AT40 (T2108) (% measured on the right)
Red line: Overbought threshold (70%); Blue line: Oversold threshold (20%)
Weekly AT40 (T2108)

*All charts created using freestockcharts.com unless otherwise stated
The charts above are my LATEST updates independent of the date of this given AT40 post. For my latest AT40 post click here.
Related links:
The T2108 Resource Page
You can follow real-time T2108 commentary on twitter using the #T2108 or #AT40 hashtags. T2108-related trades and other trades are occasionally posted on twitter using the #120trade hashtag.
Be careful out there!
Full disclosure: long NVDA call spread and puts, long AAPL puts, long NFLX puts
*Charting notes: FreeStockCharts.com uses midnight U.S. Eastern time as the close for currencies.