
(T2108 measures the percentage of stocks trading above their respective 40-day moving averages [DMAs]. It helps to identify extremes in market sentiment that are likely to reverse. To learn more about T2108, see my T2108 Resource Page. T2107 measures the percentage of stocks trading above their respective 200DMAs.)
T2108 Status: 53.9%
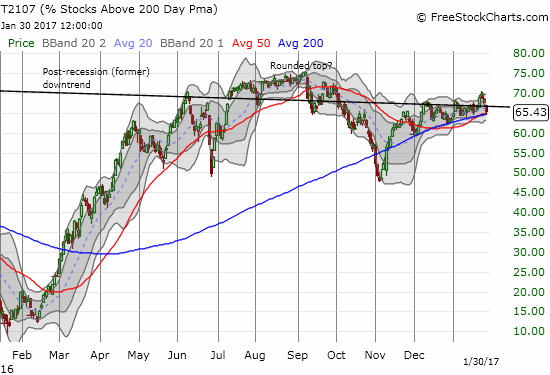
T2107 Status: 65.4%
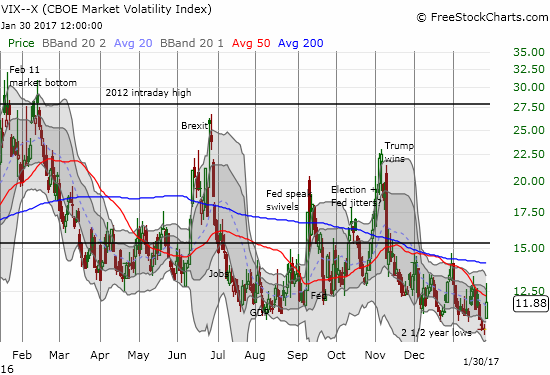
VIX Status: 11.9 (up 12.3%, was up as high as 22.8%)
General (Short-term) Trading Call: neutral
Active T2108 periods: Day #237 over 20%, Day #57 over 30%, Day #56 over 40%, Day #54 over 50% (overperiod), Day #1 under 60% (underperiod, ending 4 days over 60%), Day #3 under 70%
Commentary
In my last T2108 Update, I drew 2,080 as the line in the sand dividing my short-term neutral trading call on the S&P 500 (SPY) from flipping to a bearish trading call. On a day of raucous disruptions, the index somehow closed exactly on my line of significance.
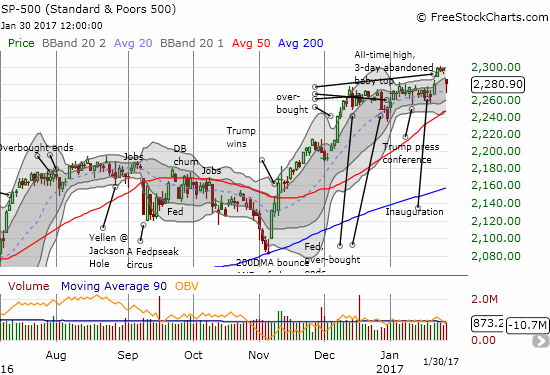
This inability to close with a clear signal is quite appropriate for an S&P 500 that has stubbornly refused to provide much in the way of directional trading signals since early December. For a while, I thought the S&P 500 had finally delivered a definitively bearish sell-off. However, buyers stepped into the breach ahead of lunchtime and managed to close out the day with a final burst to 2080.5.
However, I am duly noting a potential “abandoned baby top” in the S&P 500. This pattern occurs when excited buyers gap a stock higher one day and then sellers gap the stock back down the next day. The signal is most powerful when the stock fades from its high in between gaps as the move solidifies the notion of exhausted buyers. For the S&P 500 here, the abandoned baby top pattern played out over 3 days. A close below today’s low of 2,268 will confirm this top – at which point I would likely get aggressively bearish in my short-term trades.
The trading action was even more dramatic for T2108, the percentage of stocks trading above their respective 40-day moving averages (DMAs). At one point, T2108 traded as low as 49.2%, a level last seen two days after the U.S. Presidential election. The recovery back to 53.9% is still a 2 1/2 month low.
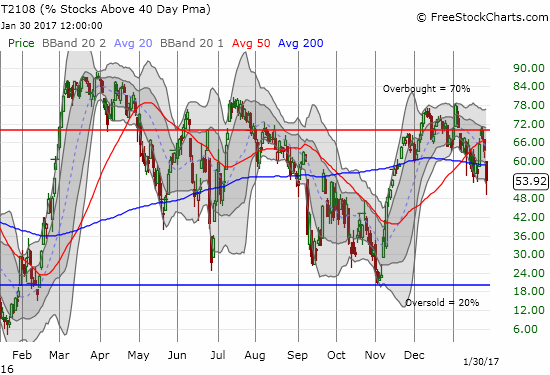
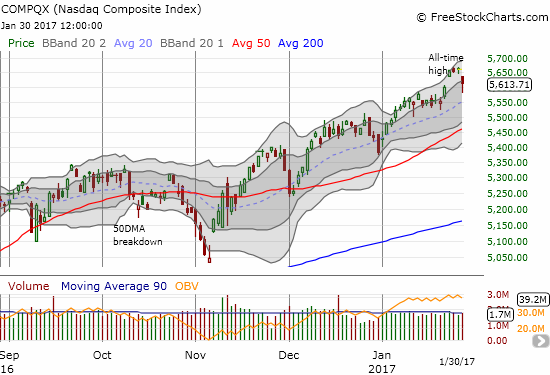
T2108’s 3-day plunge from overbought conditions brings bearish divergence back into sharp relief. I first noted the (surprising) bearish divergence on January 6th. Since then, the S&P 500 has gained a mere 4 points while somehow managing to avoid getting dragged into T2108’s sinkhole, The NASDAQ has stayed even more resilient. Unless the abandoned baby top gets invalidated, the guideposts closing in on the S&P 500 point to a meaningful sell-off in the near future.
din
On significant days like this one I like to look at T2107, the percentage of stocks trading above their respective 200DMAs, as a peak into longer-term health. T2107 dropped back to converged support at its own 50/200DMA combination. Even more importantly, the old post-recession downtrend asserted itself again as a pivot point. More selling from here would confirm a bearish change in events for the longer-term outlook. Otherwise, T2107 is still sitting pretty, healthy, and borderline bullish.
The volatility index, the VIX, tried its best to put on a show. The VIX launched off a 2 1/2 year low to gain 12.3%. The VIX gained as much as 22.8% at its peak on the day. This awakening once again confirmed that the lower bound of the VIX fuels the next big move upward in the VIX.
The dramatic and disruptive action was spread far and wide in stocks. Uncertainty soared on the day as a result of renewed geopolitical and domestic tensions generated by the on-going flow of executive orders from President Donald Trump. Orders on immigration and refugees marketed as anti-terrorism measures and rumored imminent orders on work VISAs roiled numerous sectors from airlines, to high-tech, to IT outsourcing, and many other firms with significant international dealings like Goldman Sachs (GS) and Caterpillar (CAT). Even currencies twisted in the wind with the British pound (FXB) getting slammed presumably in sympathy with renewed fears of the potential economic damage from a more isolationist approach to the global economy. It was as if the Trump honeymoon had come to a crashing end in just one day.
While I find it tempting to declare an end to the Trump rally and plan bearish trades, I am quickly reminded that two big fundamental stories lay ahead for the week that could disrupt the narrative all over again. The Federal Reserve issues its next pronouncement on monetary policy on Wednesday, February 1st. (If volatility can actually remain elevated going into the Fed meeting, I may fade it for a day trade.) Two days later, the market gets to see the U.S. jobs report for January. Moreover, the market was so complacent going into the weekend that it was vulnerable to any kind of dramatic news. The willingness of buyers to carry the load well off the lows demonstrated the on-going appetite of buyers. In other words, I am treading carefully in interpreting the swirl of signals. The bottom-line from T2108 sits at neutral and still awaits a definitive directional signal.
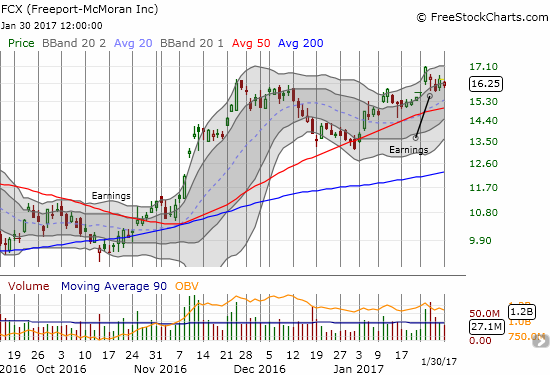
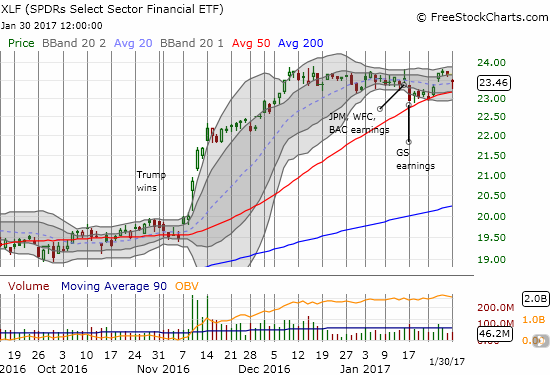
Based on my switch to neutral, I had two outstanding trades that triggered on Monday (they actually triggered before I could think to cancel them!): call options on Freeport-McMoRan Inc. (FCX) and Financial Select Sector SPDR ETF (XLF). These positions should do well IF Monday turns out to be a blip in the narrative of the Trump rally.
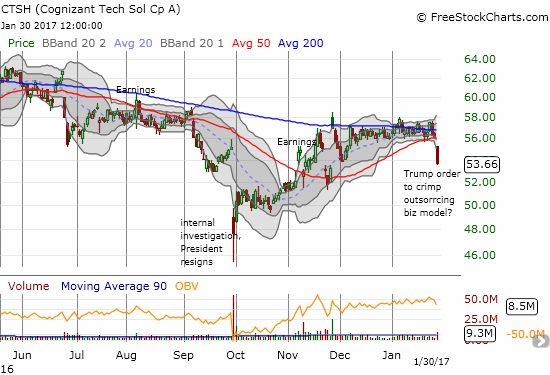
IT outsourcer Cognizant Technology (CTSH) took a 4.4% tumble that marked a clean and bearish breakdown from 50DMA support and a confirmation of standing resistance at its 200DMA. CTSH has long struggled to regain former momentum. The stock last peaked in late 2015, so today’s move makes CTSH a short with a clear stop-loss above the 50DMA.
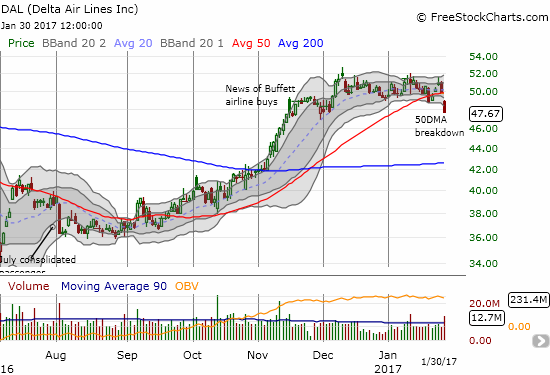
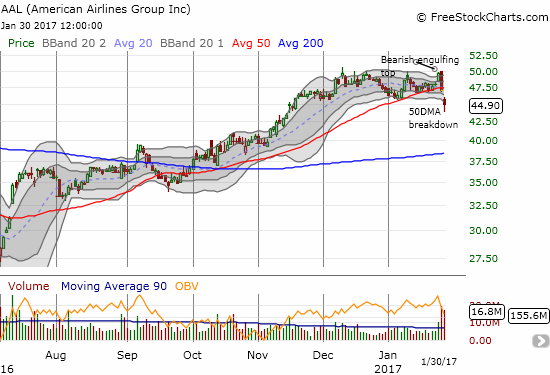
Disruptions and chaos at airports dealing with protestors and confusion over Trump’s travel bands and the subsequent response of the judicial system had traders flocking to sell airlines with significant international business. Delta Airlines (DAL) and American Airlines (AAL) look like the most precarious as both suffered significant selling on Friday. AAL suffered a bearish engulfing pattern that looks like a top. Both stocks broke down below 50DMA support but have also logged significant gains for months going into today’s troubles. I think the current disruption is a temporary disturbance for the airline stocks, but these bearish technicals are compelling…
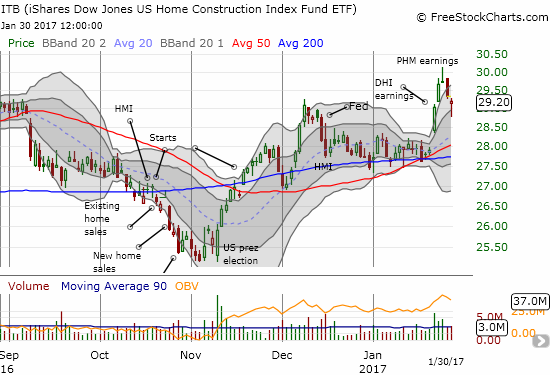
In my last T2108 Update, I grimaced at the fade in iShares US Home Construction (ITB). I noted my plan to sell if the fade received confirmation from sellers. That signal came right at the open the next day, and I wasted no time in locking in my profits on my call options. I am looking to re-enter on a test of 50DMA support.
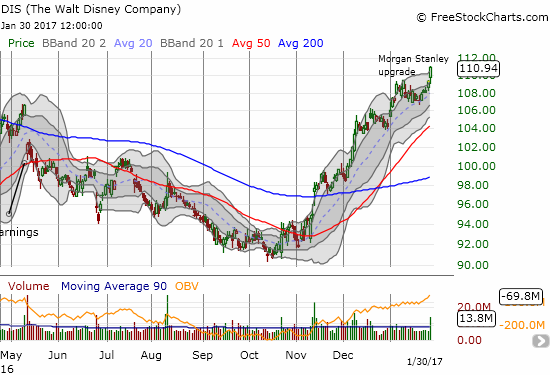
The market of course contains plenty of hope. On a day of global disruptions, Disney (DIS) gained 1.5% and put on an impressive show with a breakout to a new 13-month high. This move is bittersweet as my long-term call options expired a week and half ago with $110 strikes. It was one of those rare moments where a longer-term (bullish) trade completely failed. The biggest irony for me is that I could have turned DIS into a shorter-term trade (as I would normally do) and made significant gains. DIS is up 21.8% from the October low and up 6.4% year-to-date, easily outpacing the S&P 500. I now await the next entry point even as I suspect DIS will finally deliver another well-received earnings report next month.
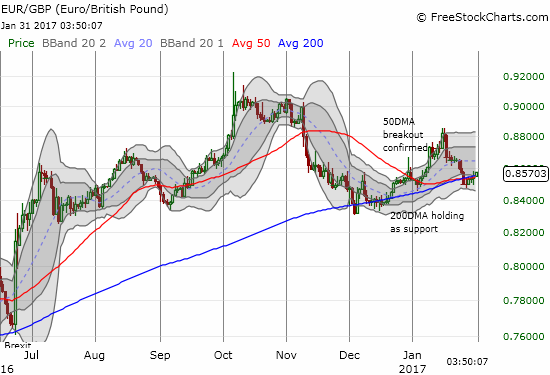
As I noted earlier, the British pound took severe blows that have abated at the time of writing. I am assuming the growing moves by the U.S. to insulate itself from global influences reminded currency traders about the same momentum in the United Kingdom (think Brexit), a country likely to be hurt a lot more than the U.S. by a withdrawal from globalization. Most significantly, GBP/JPY broke below its 50DMA again. EUR/GBP looks like it will hold converged support at its 50 and 200DMAs.
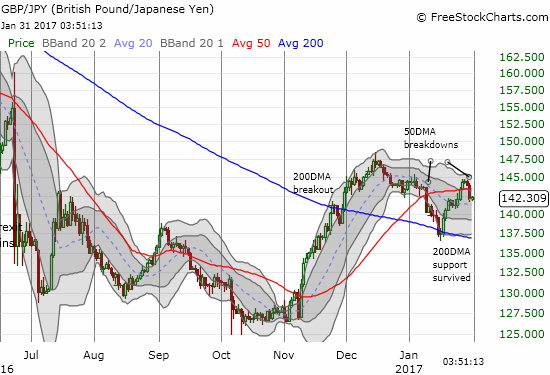
The British pound has experienced a wild ride in recent weeks. I am long overdue to write an update describing my changing trading strategies to accommodate the twist and turns of the technicals and the Brexit-related drama. Recent action has turned me more bearish.
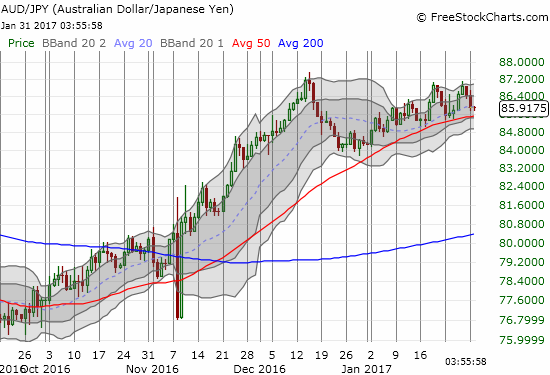
Finally, AUD/JPY, my favorite check on risk appetite in financial markets in general, continues to hold its own. The 50DMA, and now the 20DMA, is clearly holding firm as support. I will need to see AUD/JPY break down to get confident that any bearish turn in financial markets can sustain itself.
— – —
FOLLOW Dr. Duru’s commentary on financial markets via email, StockTwits, Twitter, and even Instagram!
Daily T2108 vs the S&P 500
")
Black line: T2108 (measured on the right); Green line: S&P 500 (for comparative purposes)
Red line: T2108 Overbought (70%); Blue line: T2108 Oversold (20%)
Weekly T2108

*All charts created using freestockcharts.com unless otherwise stated
The charts above are the my LATEST updates independent of the date of this given T2108 post. For my latest T2108 post click here.
Related links:
The T2108 Resource Page
You can follow real-time T2108 commentary on twitter using the #T2108 hashtag. T2108-related trades and other trades are occasionally posted on twitter using the #120trade hashtag.
Be careful out there!
Full disclosure: long FCX call options, long FXB, short GBP/JPY, long XLF call options