
(T2108 measures the percentage of stocks trading above their respective 40-day moving averages [DMAs]. It helps to identify extremes in market sentiment that are likely to reverse. To learn more about it, see my T2108 Resource Page. You can follow real-time T2108 commentary on twitter using the #T2108 hashtag. T2108-related trades and other trades are occasionally posted on twitter using the #120trade hashtag. T2107 measures the percentage of stocks trading above their respective 200DMAs)
T2108 Status: 67.3% (ended 1-day overbought period)
T2107 Status: 68.8%
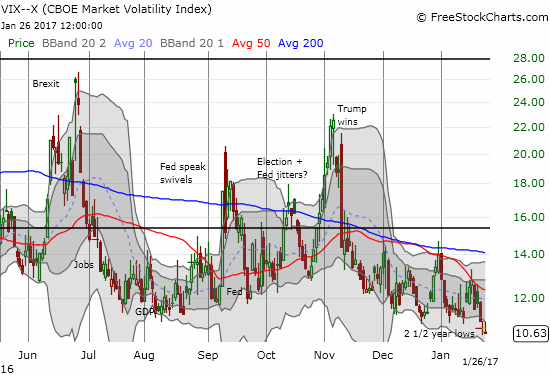
VIX Status: 10.6
General (Short-term) Trading Call: neutral
Active T2108 periods: Day #235 over 20%, Day #55 over 30%, Day #54 over 40%, Day #52 over 50%, Day #3 over 60%, Day #1 under 70% (underperiod, ended 1-day overbought period)
Commentary
For the fourth time in 6 weeks, T2108, the percentage of stocks trading above their respective 40-day moving averages (DMAs), dropped out of an overbought period. This time around, the overbought period lasted just one day. In my last T2108 Update, I noted that I flipped the short-term trading call to “neutral” to avoid further churn until the S&P 500 (SPY) delivers new technical news. As a result, I am not flipping the trading call to bearish as the T2108 trading rules dictate when an overbought period ends. From here it will take a close below 2280 to move the trading call back to bearish. As a reminder, the combination of constant churn in overbought status combined with an extremely low volatility index (VIX) mean that I do not plan to set the trading call to bullish if the S&P 500 breakout continues.

The lack of follow-through on the S&P 500 did not stir the VIX. In fact, the VIX lost yet more ground.
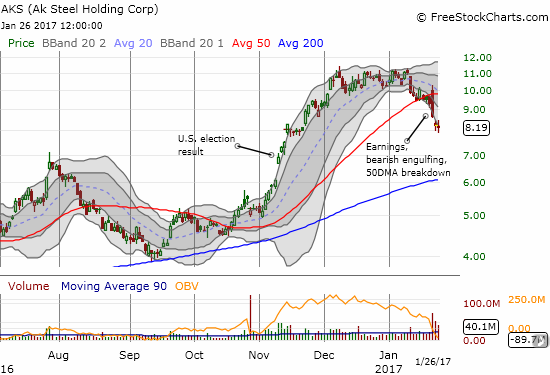
In an earlier T2108 Update, I noted that I am watching post-earnings behavior to see whether bulls and buyers continue to consider dips for any reason as fresh buying opportunities. This is particularly true on Trump-related trades. Ak Steel (AKS) was in focus earlier this week. So far, buyers have shown little interest in “bargain shopping.” The post-earnings breakdown continued for AKS and a lasting top is looking more and more likely.
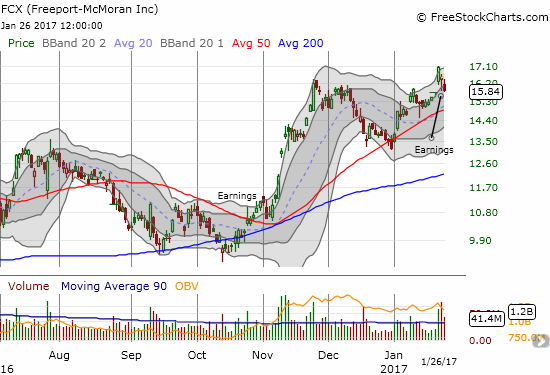
Traders and investors did not react well to earnings from commodities play Freeport McMoran (FCX) (think copper, oil, natural gas, and gold). The high-volume selling continued on Thursday. This time the selling was strong enough to close FCX at the bottom of the gap up that looked like a very bullish breakout ahead of earnings. I have my finger hovering over the buy button in case the selling momentum abates and the gap holds as support.
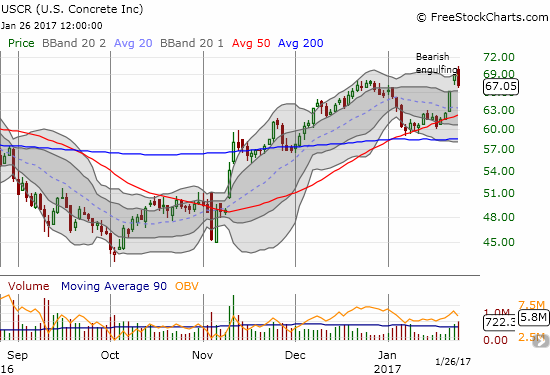
US Concrete (USCR) is another Trump trade (think infrastructure spending and big walls). USCR recently bounced neatly off 50DMA support. Thursday, the stock punched higher on more news about Trump’s proposed wall for the U.S.-Mexican border but ended the day with a 2.8% loss. This pattern is a bearish engulfing pattern, typical of tops. The high trading volume further underlines the possibility of a top. I am watching this trade very closely now.
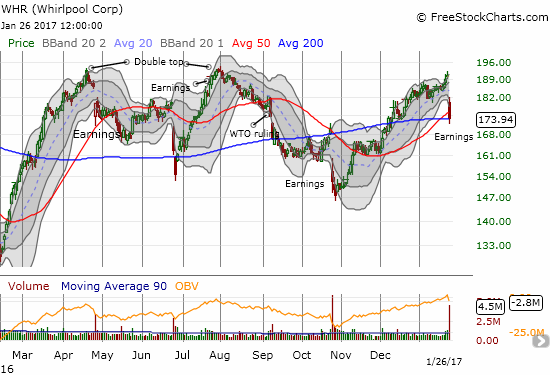
Whirlpool (WHR) had another poor post-earnings performance. A loss of 8.6% plunged the stock through 50DMA support. Support at its 200DMA managed to hold at the close. I decided to buy a single call option. This could be the first part of a hedged trade. If WHR cracks through 200DMA support, I will add put options to the mix in anticipation of a major rollback of post-election gains.
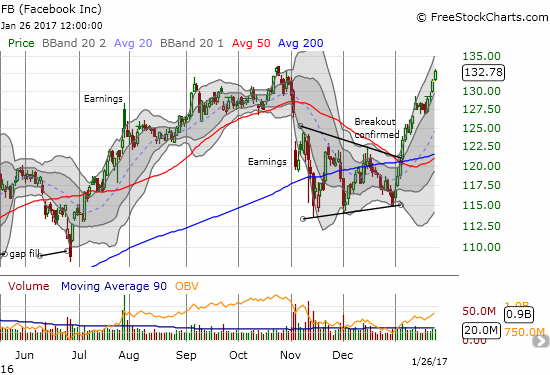
Facebook (FB) continues to perform exceptionally well. This is easily my biggest missed trade of 2017 so far. As a reminder, I pointed out Facebook’s bearish technical breakdown last month and guessed that FB could be the target of buyers in 2017. The buyers wasted no time and went right to work on the first trading day of the year. The buying has taken just four days of very brief rest since then. I should have at least jumped on the bandwagon at the breakout point above the convergence of the 50 and 200DMAs.
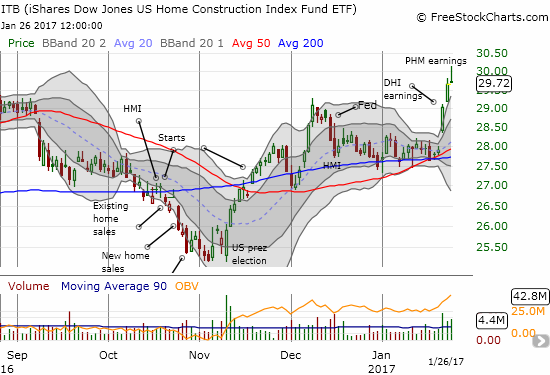
Finally, I am keeping a close eye on my call options on iShares US Home Construction (ITB). The good earnings news on home builders continued to roll in, but buyers were not able to close out the day in strength. The steep fade from the highs puts me on notice for potential topping action. I will look to lock in profits if the selling gets follow-through. Per the seasonal strength in home builder stocks, I will buy into the next dip.
{In other trade news, I sold my small number of shares in SDS as planned. I also finally cut bait on my AUD/JPY short.}
— – —
FOLLOW Dr. Duru’s commentary on financial markets via email, StockTwits, Twitter, and even Instagram!
Daily T2108 vs the S&P 500
")
Black line: T2108 (measured on the right); Green line: S&P 500 (for comparative purposes)
Red line: T2108 Overbought (70%); Blue line: T2108 Oversold (20%)
Weekly T2108

*All charts created using freestockcharts.com unless otherwise stated
The charts above are the my LATEST updates independent of the date of this given T2108 post. For my latest T2108 post click here.
Related links:
The T2108 Resource Page
Be careful out there!
Full disclosure: long FCX, long WHR call option, long USCR call option, long ITB call options