
(T2108 measures the percentage of stocks trading above their respective 40-day moving averages [DMAs]. It helps to identify extremes in market sentiment that are likely to reverse. To learn more about it, see my T2108 Resource Page. You can follow real-time T2108 commentary on twitter using the #T2108 hashtag. T2108-related trades and other trades are occasionally posted on twitter using the #120trade hashtag. T2107 measures the percentage of stocks trading above their respective 200DMAs)
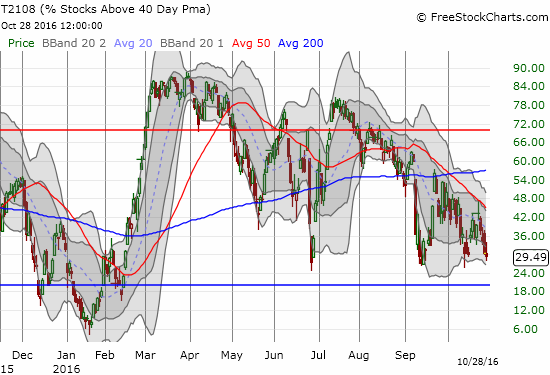
T2108 Status: 29.5%
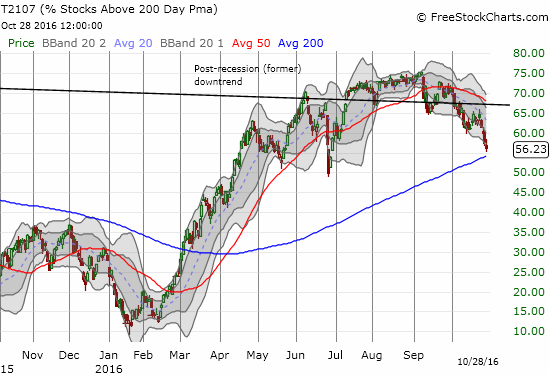
T2107 Status: 56.2%
VIX Status: 16.2
General (Short-term) Trading Call: neutral
Active T2108 periods: Day #176 over 20%, Day #1 under 30% (underperiod), Day #4 under 40%, Day #21 under 50%, Day #36 under 60%, Day #62 under 70%
Commentary
The complacency going into this earnings season came to a definitive end this past week. The divergences exposing the stock market’s underlying weakness further expanded and are even more striking. The pressures have pushed T2108, the percentage of stocks trading above their respective 40-day moving averages (DMAs), ever closer to oversold territory (below 20%). T2107, the percentage of stocks trading above their respective 200DMAs, looks like it topped out.
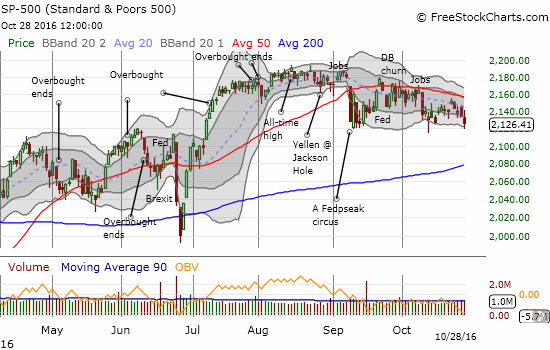
The S&P 500 (SPY) is performing valiantly given it has failed to break free from 50DMA resistance since Fedspeak helped knock it down in early September. I am still assuming that a trading range is in effect until the U.S. Presidential election, but that assumption looks ever more tenuous.
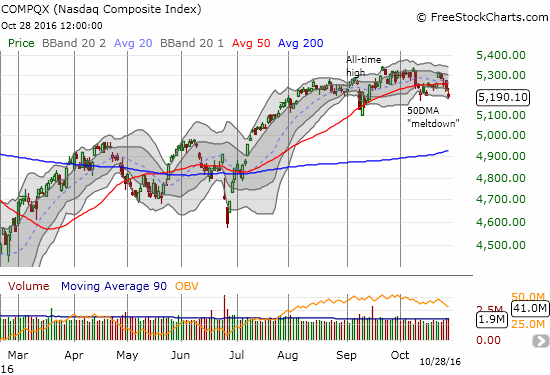
Suddenly the NASDAQ (QQQ) is also struggling with its 50DMA. Just a month ago, the NASDAQ’s out-performance shone as a market beacon. On Monday, the tech-laden index gapped up convincingly toward its all-time high. The index sold off for four straight days and ended the week with a 50DMA breakdown. The chart below suggests that the NASDAQ is working on a double top. A breach of September’s low would confirm the double top. Bears should duly note how the sharp and intense selling following Brexit set the stage for invalidating the last double top that formed with the April and June highs.
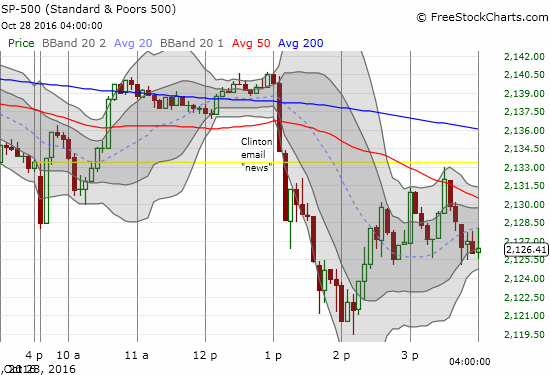
Interestingly, election-related news likely drove the market’s latest bout of weakness. The S&P 500 was working on drifting into the close with a small gain when news broke about FBI Director James Comey sending a letter to Congress about new Hillary Clinton emails. Rumors, commentary, and counter-commentary swirled, but the stock market never managed to stage a complete comeback. The 5-minute chart below shows the knockdown and subsequent volatility.
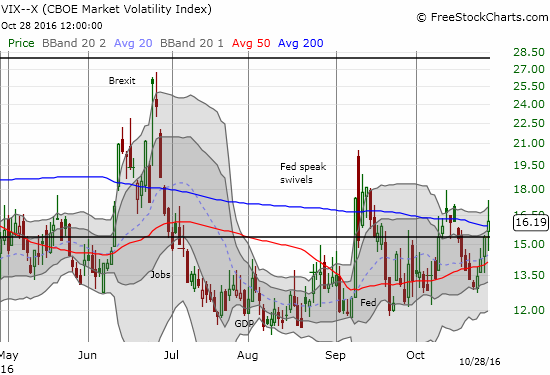
Given T2108 was around 30% and seeing how fast the market reacted to a developing story, I decided to jump on SPY call options. When the market first bounced, I was astounded to see the call options gain over 30%. I quickly took profits and set a limit order to buy again at my original price. Sure enough, the market obliged. I then decided to double down with put options on ProShares Ultra VIX Short-Term Futures (UVXY). The volatility index, the VIX, soared on the day but faded hard from its intraday high. I strongly suspect that the VIX will cool down on Monday. This assumption is risky since the VIX closed above the 15.35 pivot. Note the series of lower highs and higher lows forming a subtle wedge pattern on the VIX. I am basically betting that volatility will quickly calm back down as it has done with recent spikes.
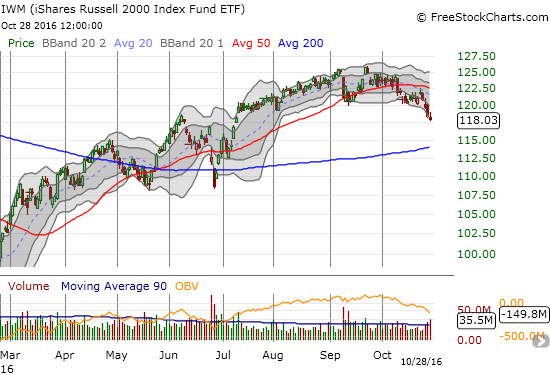
I consider my bullish trades as a “special case” given the overall deterioration in the underpinnings of the market. I am keeping my short-term bias on neutral only because T2108 is so close to oversold territory. My favorite technical indicator demonstrates most clearly the dangers in the market when juxtaposed with the S&P 500. T2107 confirms the red flag. Small cap stocks are also adding to the danger signs. The iShares Russell 2000 (IWM) closed at a new four month low and confirmed resistance at the 50DMA. A retest of 200DMA support is now in play.
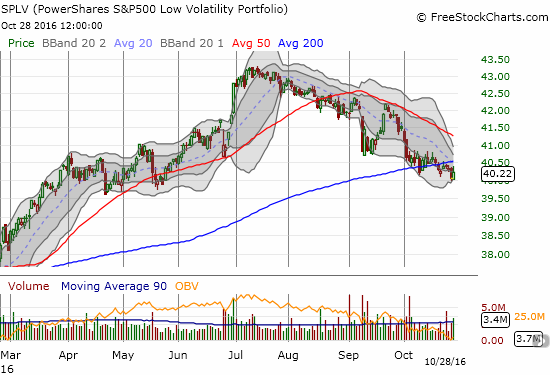
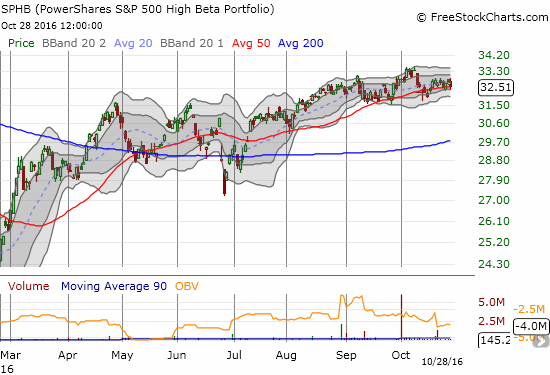
The long-standing deterioration in PowerShares S&P 500 Low Volatility ETF (SPLV) resumed this week with a confirmation of a 200DMA breakdown (granted it bounced slightly on Friday). The PowerShares S&P 500 High Beta ETF (SPHB) continued to hold its ground with rising 50DMA support. It looks like these high beta stocks will be the last to go…
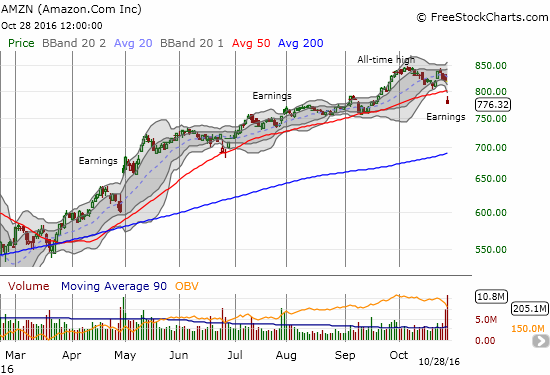
The process for breaking down the high beta stocks may have finally begun with Amazon.com (AMZN) and Alphabet (GOOG) putting on poor post-earnings performances on Friday.
AMZN cleanly broke down below 50DMA support and even closed on its lows. However, assuming the market is in trading range mode, I pulled a play out of the AMZN post-earnings rule book and bought a 790/800 call spread expiring in two weeks. If I am correct about the trading range going into the election, I think AMZN could easily mount a relief rally back to 50DMA resistance and my $800 upside target.
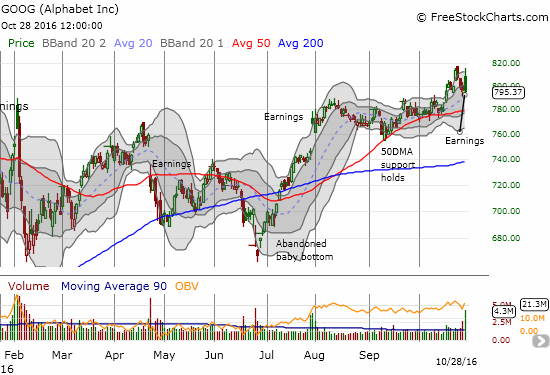
Like AMZN, GOOG succumbed to mounting selling pressure going into earnings. Yet, GOOG’s earnings results were enough to generate a gap up and even a follow-up run back to all-time highs. The sellers returned at that point and closed GOOG out exactly flat with the pre-earnings close. I think this fade served as a sufficient confirmation that GOOG’s rally will stall here. Support at the 50DMA is now in play.
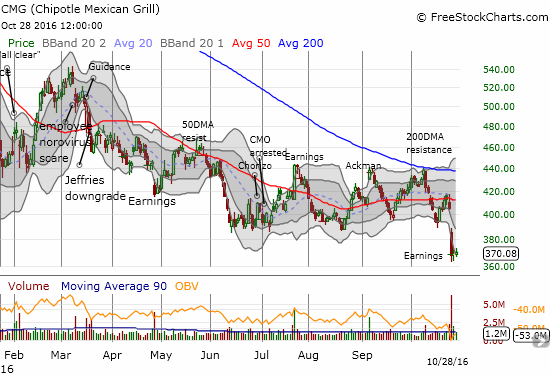
Pre-earnings selling pressure was also telling for Chipotle Mexican Grill (CMG). CMG failed to break 200DMA resistance on October 10th, broke down below 50DMA support, made a half-hearted recovery, sold off ahead of earnings, and then gapped down convincingly post-earnings. CMG now trades at a fresh 3-year and 3-month low. Yet, sellers have not made more progress in the two following trading days. I am holding onto a call option that is the result of another successful trade on CMG using a long/short configuration. This time around, I went back to options on both sides. I initiated the trade right after the open as CMG broke through its 52-week low. I locked in profits on the put as sellers pressured CMG well below its lower-Bollinger Band (BB).
In general, the long/short trades are working very well in the wake of earnings reactions. I was burned enough with earlier attempts to anticipate the direction of post-earnings trades. One time the market follows momentum, another time the market fades momentum – I managed to find myself on the wrong side with Netflix (NFLX) and Caterpillar (CAT). As part of my lesson, I followed my trading call to short Whirlpool (WHR) but married call options to my put options. Sure enough, WHR soared on Friday. I locked in profits on the call options as a partial payment for the put options.
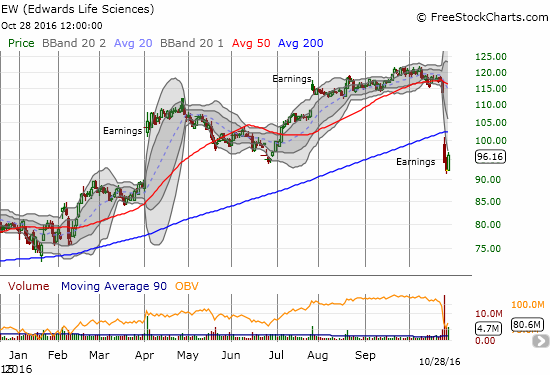
Edwards Life Sciences (EW) provided another dramatic post-earnings failure. In a rare bout of bad news, EW gapped down so hard it crashed through 200DMA support with a devastating 17.1% loss. On the next day, sellers looked primed to reverse all the gains form the April post-earnings gap up. Buyers closed out the week and provided some hope that EW will at least challenge 200DMA resistance soon.
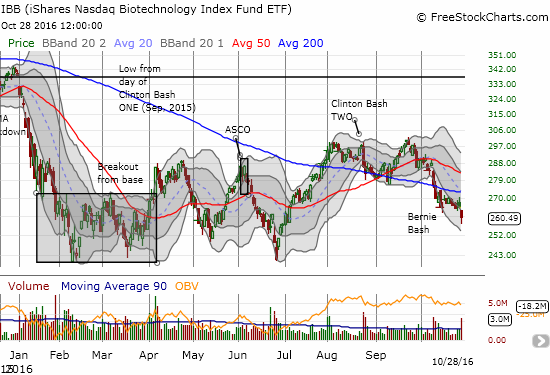
The Bernie Bash apparently continues to weigh on the iShares Nasdaq Biotechnology (IBB). On Friday, IBB confirmed its 200DMA breakdown with a gap down on heavy selling volume. I am a little bit late to the game, but I wanted to wait for confirmation. I bought my put option on an intraday relief rally.
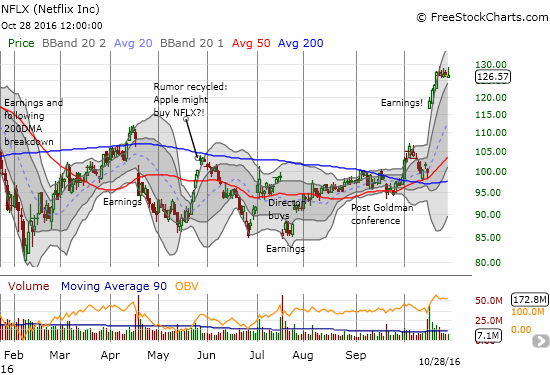
Netflix had a stellar post-earnings week but this week completely stalled out. After ignoring momentum and buying put options in the immediate wake of earnings, I am now eyeing NFLX like a hawk for a break from the current consolidation.
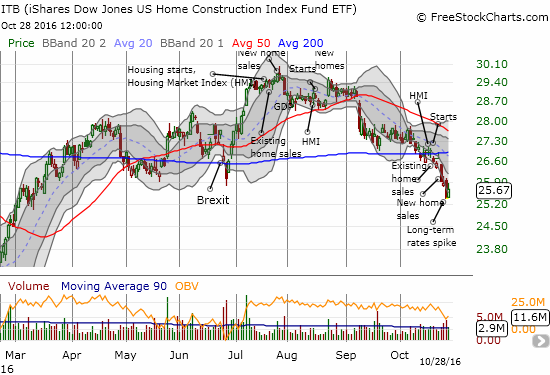
The iShares US Home Construction (ITB) has created one of the most disappointing breakdowns that I am tracking. I will write more about ITB in my next Housing Market Review. For now, I will just note how ITB broke down below 200DMA support and dropped straight through a series of housing reports. A big spike in long-term bond yields pretty much confirmed the breakdown.
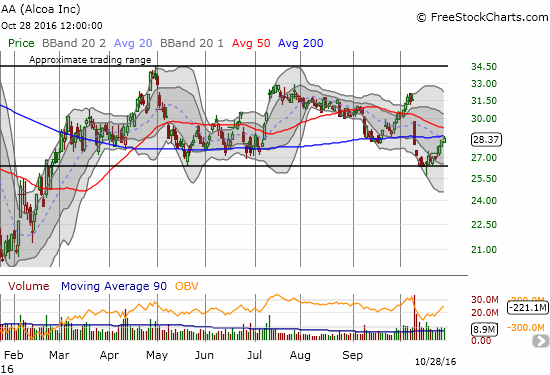
On the bullish side, my trade on Alcoa (AA) worked out as the stock held support. I locked in profits on Friday with AA pressed against 200DMA resistance. The post-earnings sell-off was so strong, I doubt that AA can retest the top of it trading range anytime soon.
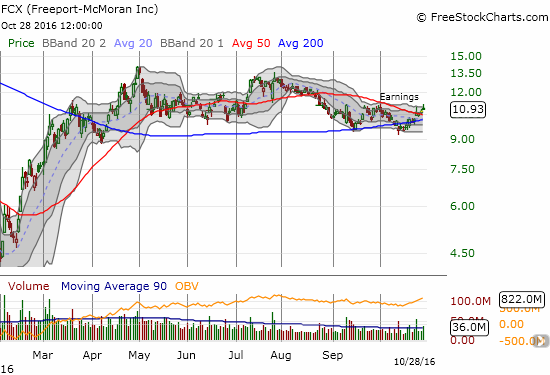
Also on the bullish side, I bought the post-earnings 50DMA breakout for Freeport-McMoRan Inc. (FCX). I have been eyeing FCX for almost 2 weeks for my next play on its extended trading range. I bought call options and am targeting a run to the top of the range by December.
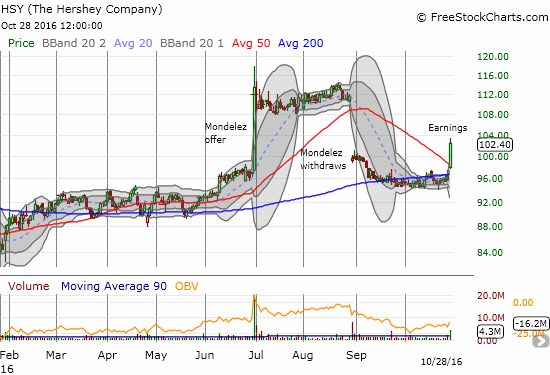
Hershey (HSY) soared after its earnings report. This breakout is so impressive, HSY looks ready to return to the highs carved out by the buyout offer from Mondelez. I am holding long-term call options from buying on the test of 200DMA support. I was tempted to sell but did not. I think HSY is a clear buy on the dips going forward.
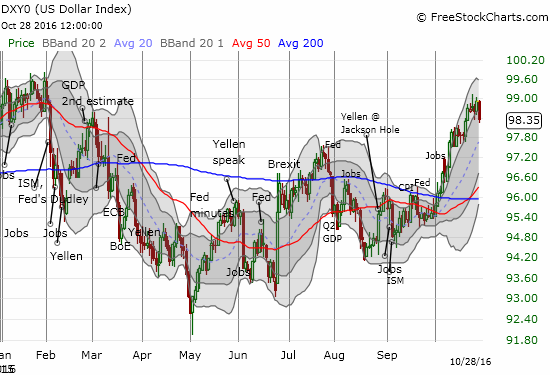
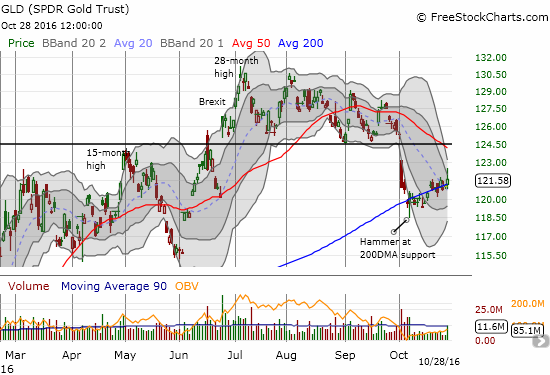
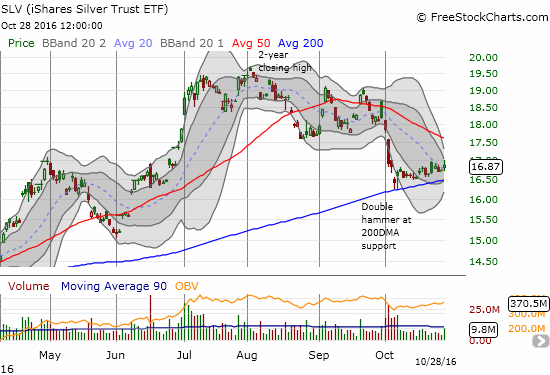
One of the more intriguing dynamics in the market has developed between the U.S. dollar index (DXY0) and precious metals. The U.S. dollar index experienced a very strong October. Yet, neither SPDR Gold Shares (GLD) nor iShares Silver Trust (SLV) were thrown off their respective uptrending support lines from 200DMAs. My play on support still sits with SLV call options. I am not yet ready to add to the play with VanEck Vectors Gold Miners ETF (GDX) call options: I am still waiting for GLD to make a convincing push away from support. Regardless, I am thinking something has to give way in this dynamic. The U.S. Presidential election will likely deliver the catalyst…
— – —
FOLLOW Dr. Duru’s commentary on financial markets via email, StockTwits, Twitter, and even Instagram!
Daily T2108 vs the S&P 500
")
Black line: T2108 (measured on the right); Green line: S&P 500 (for comparative purposes)
Red line: T2108 Overbought (70%); Blue line: T2108 Oversold (20%)
Weekly T2108

*All charts created using freestockcharts.com unless otherwise stated
The charts above are the my LATEST updates independent of the date of this given T2108 post. For my latest T2108 post click here.
Related links:
The T2108 Resource Page
Be careful out there!
Full disclosure: long SDS, long SPY call options, long UVXY shares and short UVXY call and long UVXY put options, long CAT call and put options, net long the U.S. dollar index, long GLD, long SLV shares and call options, long WHR put options, long AMZN call spread, long IBB put options, long HSY call options